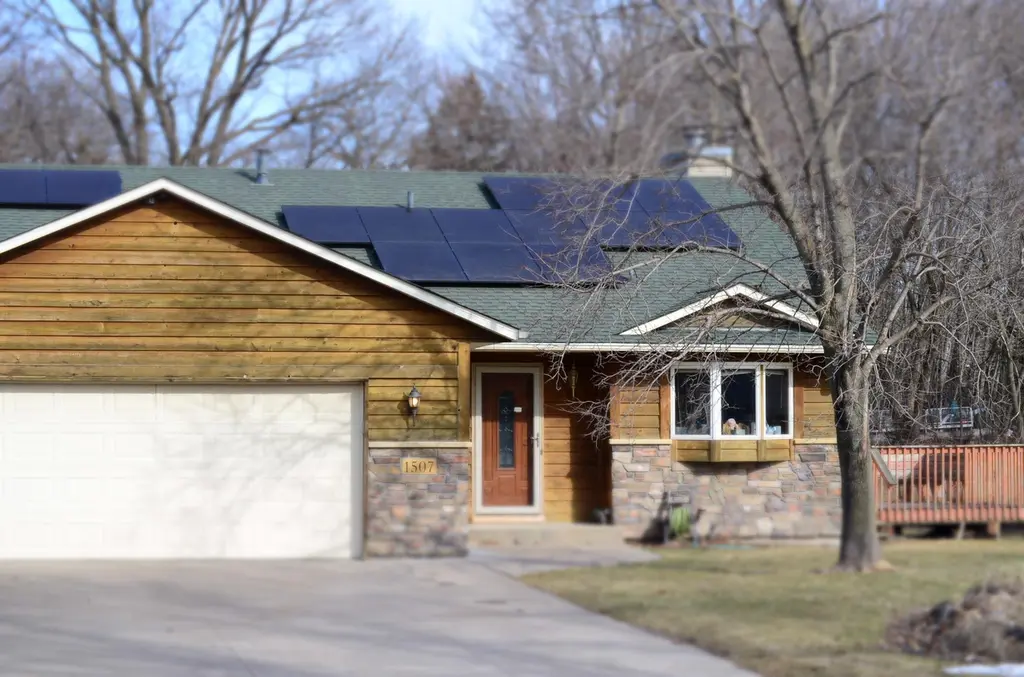
1507 9th St SE · Forest Lake, MN
Flood risk 1/10 · Minimal
- FEMA flood zone
- X (unshaded)
- Chance of flooding over 30 yrs
- 0.0%
- Est. flood insurance / yr
- $473 – $860
Fire risk 1/10 · Minimal
- Est. fire insurance / yr
- $888 – $1,650
Heat risk 2/10 · Minimal
- Hot days now (above 99°F)
- 7 days/yr
- Hot days in 30 yrs
- 14 days/yr
Wind risk 2/10 · Minimal
- Chance of severe wind over 30 yrs
- —
Air-quality risk 2/10 · Minimal
- Unhealthy air days now
- 1 days/yr
- Unhealthy air days in 30 yrs
- 2 days/yr
Risk factors via First Street. Map © Google.
Why this score? — see what drove the D- grade
The composite is a weighted blend of 9 inputs, each scored 0–100. Each bar is that input's sub-score; the figure is the points it added to the 100-point composite (weight × sub-score).
- ARV discount +11.6/15.0
- Cash flow +8.9/30.0
- Schools +4.5/10.0
- Livability +3.8/5.0
- Rent growth +3.3/5.0
- 1% rule +2.6/10.0
- DSCR +2.5/10.0
- Condition / age +2.5/5.0
- Appreciation +0.0/10.0
$359,900
🖨 Deal sheet 📄 Offer letter ✓ Due diligence
Listing remarks MLS
3 BRs on 1 level, wood FP in family room, deck off dining area, large foyer, corner lot, privacy. Some updates are in process, won't take much to complete floors on main and upper level. Extra parking pad next to garage.
Key facts
- Newer ac
- Fresh paint
- Newer furnace
Tags
Property features AI
Exterior
- Parking: Attached heated garage; 2-car garage
- Utilities: City water (connected); City sewer (connected); Natural gas; Electric service provided by Xcel Energy
- Home design: Residential property; Three-level split; Entry includes a foyer (8x6); Above-grade and below-grade finished living areas
- Construction: Brick and concrete construction; Asphalt roof (over 8 years old); Block foundation
- Exterior features: Corner lot; Deck; Vinyl exterior; No fencing; Road frontage includes county road, sidewalks, and street lights; Publicly maintained road access
Interior
- Kitchen: Kitchen with window; Dishwasher; Microwave; Refrigerator; Tile floors in kitchen/dining area
- Bedrooms: 4 bedrooms total (bedrooms located on upper and lower levels; 3 bedrooms on one level); Bedroom sizes include 14x11, 12x10, 10x10, and 11x10
- Flooring: Tile floors (kitchen/dining mentioned); Finished basement flooring
- Bathrooms: One full bathroom on upper level; One three-quarter bathroom in basement
- Heating & cooling: Forced air heating; Central air conditioning
- Interior features: Finished basement; Brick fireplace in family room; Kitchen/Dining combo; 3 bedrooms on one level
- Laundry & utility: Washer and dryer (washer/dryer hookup); Laundry located in basement; Electric water heater
Neighborhood map
What this means for you Summary
Snapshot
- This is a 4-bed/1.5-bath single-family listed at $360k.
Deal economics
- At list price, monthly cash flow is $-288 ($-3k/yr) — negative.
- To cash-flow at today's rent, offer at most $309k (14.2% below list).
- To meet the 1% rule (rent ≥ 1% of price), the offer needs to be $273k (24.2% below list).
- Recommended offer: $273k (24.2% below list) — sets the bar for 1% rule.
- Cap rate 5.3% vs local median 3.0% in Forest Lake — top-decile yield for the area; either an underpriced asset or a hidden risk that comps aren't pricing in. Stress-test before assuming the spread holds.
Location & tenants
- Location reads 75/100 on livability (#194 in MN, #4,132 nationally) — a middle-class / working-renter tenant base. Strengths: schools A+, employment A+, housing A+; Watch: cost of living C-, amenities F, commute F.
- Forest Lake Public School District (town): math 48% / reading 52% proficiency, ranked #90 of 301 in MN (top 30%) — acceptable for families but not a draw, mixed tenant base, ~2y average lease; only 17% free/reduced lunch — higher-income household profile.
- Market conditions: Rents rising (+3.3%/yr); 164 active listings in the ZIP; 2 comparable units currently listed for rent nearby; solid renter incomes; 1,405 units permitted in Washington County in 2024 (121 in 5+ unit buildings).
- This rent runs 33% of the median local income ($98k/yr) — at the standard rent-burdened threshold; future hikes will face affordability resistance.
Forward outlook
- Local home prices are declining (-3.0%/yr); year-one equity from $2k of loan paydown is wiped out by about $11k of value loss. Plan a longer hold.
- Washington County population projected at +16% by 2050 — long-run rental-demand tailwind backs the buy-and-hold thesis.
Negotiation context
- Only 14 days on market — expect competitive offers; lowballing is unlikely to land.
- 5 sale attempts since 33y ago with the ask held roughly flat each time — persistent listings suggest the price (not the market) is what's stuck; bring a comps-based counter.
- Current owner paid $128k; list at $360k implies a 180% gain — meaningful room to come down on a strong offer.
Questions for the listing agent
- What do current leases actually rent for vs. the listed asking? Can we see a recent rent roll and the last 12 months of T-12 income?
- Is there a deadline driving the sale (1031 exchange, divorce, estate, relocation)? That informs how much negotiation room exists.
- Schools are A-rated — typically a magnet for longer-tenancy family renters. What's the average tenant stay here, and is there a school-zone premium baked into asking?
- The area grade is low — what's the realistic commute time and amenity access for the typical tenant pool here? Any planned neighborhood developments (good or bad) we should know about?
- What's the average days-on-market for RENTAL listings here right now (not sales)? A rising rental-DOM trend means longer vacancies and softer asking-rent achievability than the comps imply.
- What's the recent tenant-quality profile in this submarket — average credit score on applications, eviction rate, late-payment / NSF rate, and stable-employment percentage? A property-management company in the area should have these aggregated.
- How much new for-sale + rental construction is in the pipeline within 1–3 miles? Heavy new supply typically softens prices + rents 12–24 months out; constrained supply supports both.
Investment metrics
- 1% rule
- 0.76% ✗
- Cap rate
- 5.33%
- Cash-on-cash
- -3.43%
- DSCR
- 0.85
- GRM
- 11.0
CMA / ARV
- ARV (median comp)
- $396,176
- List price
- $359,900
- Delta
- -9.16%
- Verdict
- FAIR
- Comps
- 6 within 2.0 mi
Projected returns pro-forma
-3.0% appreciation · 3.33% rent growth · sell at horizon
- IRR
- -21.7%
- Equity multiple
- 0.25×
- Total profit
- $-75,760
- Equity at exit
- $53,662
- IRR
- -14.7%
- Equity multiple
- 0.15×
- Total profit
- $-85,806
- Equity at exit
- $31,118
Cash invested: $100,772 (down + closing). Projections, not guarantees.
Landlord ↔ Tenant lean methodology
- Overall (STATE)
- 46 Balanced
- State Minnesota
- 46 Balanced · D+2
- County
- — inherits STATE
- City
- — inherits STATE
ZIP-level market 55025
- Rents YoY
- 3.3%
- Active inventory
- 164
- Price-to-rent
- 11.0×
Monthly cashflow live
- Estimated rent
- $2,727 medium interval (Pro) →
- Mortgage (P&I)
- −$1,887
- Tax from tax record
- −$406 /mo · $4,866/yr
- Insurance
- −$150
- HOA
- −$0
- Vacancy / Maint / Mgmt
- −$573
- Net cashflow
- $-288
Break-even live
UW: 25.0% down · 7.5% · 30yr · 1.5% tax · 5.0% vac · 8.0% maint · 8.0% mgmt
Financing live
Cash to close
- Down payment
- $89,975
- Closing costs
- $10,797
- Reserves months
- —
- Total cash needed
- —
Loan-product check · same deal, 3 products live
Conventional
25% down · 7.5% · 30yr
- Down + closing
- —
- Monthly P&I
- —
- Monthly cashflow
- —
- DSCR
- —
- Eligible?
- —
Personal DTI + credit; lowest rate.
DSCR
20% down · 8.5% · 30yr
- Down + closing
- —
- Monthly P&I
- —
- Monthly cashflow
- —
- DSCR
- —
- Eligible?
- —
No personal income docs; deal must DSCR.
Hard money
10% down · 12.0% · 12mo
- Down + closing
- —
- Monthly P&I
- —
- Monthly cashflow
- —
- DSCR
- —
- Eligible?
- —
Short-term bridge; refi at stabilization.
Rent comps 2 comps
| Address | Beds | Baths | Sqft | Rent | $/sqft | DOM | Units | Dist |
|---|---|---|---|---|---|---|---|---|
| 1081 4th St SW Forest Lake, MN | 1.0–3.0 | 1.0–2.0 | 939 | $2,455 | $2.61 | 1d | 12 | 0.86mi |
| 22692 Hayward Ave N Forest Lake, MN | 5.0 | 2.0 | 1800 | $3,250 | $1.81 | 43d | 1 | 1.25mi |
Listing history 17 events
-
2026-05-14$359,900 Active 670-char remark
-
2011-01-27soldstatus $128,500 222-char remark
Show marketing remark (222 chars)
3 BRs on 1 level, wood FP in family room, deck off dining area, large foyer, corner lot, privacy. Some updates are in process, won't take much to complete floors on main and upper level. Extra parking pad next to garage.
-
2011-01-04historical 222-char remark
Show marketing remark (222 chars)
3 BRs on 1 level, wood FP in family room, deck off dining area, large foyer, corner lot, privacy. Some updates are in process, won't take much to complete floors on main and upper level. Extra parking pad next to garage.
-
2010-09-20$119,900 222-char remark
Show marketing remark (222 chars)
3 BRs on 1 level, wood FP in family room, deck off dining area, large foyer, corner lot, privacy. Some updates are in process, won't take much to complete floors on main and upper level. Extra parking pad next to garage.
-
2004-06-17soldstatus $208,250
-
2004-04-29soldstatus $208,250
Show marketing remark (163 chars)
This home offers everything. 3 bedrooms on one level and two great bathrooms. The lower level has a fireplace and a nice sized family room. Just move in and enjoy!
-
2004-04-13historical
Show marketing remark (163 chars)
This home offers everything. 3 bedrooms on one level and two great bathrooms. The lower level has a fireplace and a nice sized family room. Just move in and enjoy!
-
2004-04-04$209,900
Show marketing remark (163 chars)
This home offers everything. 3 bedrooms on one level and two great bathrooms. The lower level has a fireplace and a nice sized family room. Just move in and enjoy!
-
2000-06-20soldstatus $155,185
-
2000-06-20soldstatus $155,185
-
2000-05-09historical
-
2000-03-21$159,900
-
1993-10-21soldstatus $112,400
-
1993-10-15soldstatus $112,400
-
1993-09-04historical
-
1993-05-16$114,900
-
1989-09-01soldstatus $102,570
ⓘ Source: listings_history table (triggers on properties + properties_extension) + one-shot
backfill from property_details.listing_events for pre-trigger history.
Tax reassessment forecast MN · Partial reset (capped growth)
- Current annual tax
- $4,866 · $406/mo
- Projected year-2 tax
- $4,866 · $406/mo
- Expected delta
- $0/yr ($0/mo · 0.0%)
ⓘ Screening estimate from a state-policy table — verify with the county assessor before closing.
Climate risk First Street
- Flood 1/10 Low FEMA zone X (unshaded) · 0% chance over 30 yrs
- Wildfire 1/10 Low
- Heat 2/10 Low 7 d/yr ≥99°F today · 14 d/yr by 30 yrs out
- Wind 2/10 Low
- Air quality 2/10 Low 1 unhealthy d/yr today · 2 by 30 yrs out
Nearby sold comps map
Loading sold comps map…
Walkable amenities ~0.75 mi
Loading nearby amenities…
Taxation est. · year 1
- Rental income
- $32,727
- − Mortgage interest
- −$20,160
- − Property taxes
- −$4,866
- − Insurance
- −$1,800
- − Repairs & maintenance
- −$2,618
- − Management
- −$2,618
- − Depreciation
- −$10,470
- Taxable loss
- −$9,805
- Est. tax savings @ 24.0%
- +$2,353
- After-tax cash flow
- $-1,107/yr
For passive investors: Depreciation is non-cash, so a rental often shows a tax loss while cash-flowing — sheltering income. Rental losses are passive: they offset passive income freely, and up to $25,000/yr can offset ordinary (W-2) income if you actively participate and your MAGI is under $100k (phasing out to $0 by $150k); unused losses carry forward. On sale, claimed depreciation is recaptured at up to 25%, and gains may owe capital-gains tax (a 1031 exchange can defer both). Figures are a year-1 estimate at your 24.0% rate — not tax advice; consult a CPA.
Schools (NCES district)
- District
- Forest Lake Public School District
- NCES district ID
- 2712270
- Math proficiency
- 48% ▼ -12.00%
- Reading proficiency
- 52% ▼ -9.00%
- Median HH income
- $75,736
- Composite
- 45.24/100
- National rank
- #2664
- State rank
- #90 of 301 in MN
Livability — Forest Lake
- Score
- 75/100
- State rank
- #194
- US rank
- #4132
Category grades
Schools grade is shown separately in the Schools card above.
Census & demographics
- Census place
- Forest Lake, MN
- County
- Washington County · 235,613 people
- City population
- 25,891
- Metro
- Minneapolis-St. Paul-Bloomington, MN-WI
- Population (ZIP)
- 25,891
- Household income
- $98,382
- Rent vs Own
- Severe rent burden
- 420.0
Population outlook (Washington County) Hauer SSP2
- Today (2025)
- 278,554 people
- By 2030
- 290,465 · +4.3%
- By 2040
- 310,014 · +11.3%
- By 2050
- 324,118 · +16.4%
- By 2075
- 362,697 · +30.2%
- By 2100
- 381,491 · +37.0%
Race, ethnicity, and origin ACS 2023
- Neighborhood character
- Predominantly White (84%)
- Race & ethnicity
- White 84% Asian 5% Two or more races 5% Hispanic / Latino 4% Black 3%
- Common ancestry
- Portuguese 10% Romanian 4% Lithuanian 3%
- Foreign-born
- 5% · Canada, China
- Languages at home
- 92% English-only · Other Asian/Pacific 3% Spanish 2% Chinese 1%
Political lean MEDSL · Washington
- 2024 margin
- Lean D (+8.9) · D 53.5% · R 44.6% · Other 1.9%
- 2008→2024 swing
- +4.6pp toward D · 2008: 4.3pp · 2024: 8.9pp
- All cycles
- 2024: D+8.9 2020: D+9.2 2016: D+1.9 2012: D+0.8 2008: D+4.3
Not yet ingested
- Civics
- —
Market trends
- HPI YoY
- ▼ -280.92%
- Current HPI
- 235.3166
- Rent YoY
- ▲ 3.33%
- Metro
- Minneapolis-St. Paul-Bloomington, MN-WI
- State GDP YoY
- ▲ 2.41%
- F500 in state
- 34
Industry mix (Fortune 500 HQ in MN)
| Industry | F500 HQs | Revenue |
|---|---|---|
| Healthcare | 2 | $407B |
|
||
| Retail | 2 | $150B |
|
||
| Consumer Goods | 2 | $32B |
|
||
| Industrial Machinery | 2 | $6B |
|
||
| Agriculture | 1 | $40B |
|
||
| Healthcare / Medical Devices | 1 | $32B |
|
||
Price history
+250.9% since first listed17 events — show timeline
- 2026-05-14 Listed $359,900 NORTHSTARMLS as Distributed by MLS Grid
- 2011-01-27 Sold (MLS) $128,500 NORTHSTARMLS as Distributed by MLS Grid
- 2011-01-04 Listing Removed — NORTHSTARMLS as Distributed by MLS Grid
- 2010-09-20 Listed $119,900 NORTHSTARMLS as Distributed by MLS Grid
- 2004-06-17 Sold (Public Records) $208,250 Public Records
- 2004-04-29 Sold (MLS) $208,250 NORTHSTARMLS as Distributed by MLS Grid
- 2004-04-13 Listing Removed — NORTHSTARMLS as Distributed by MLS Grid
- 2004-04-04 Listed $209,900 NORTHSTARMLS as Distributed by MLS Grid
- 2000-06-20 Sold (Public Records) $155,185 Public Records
- 2000-06-20 Sold (MLS) $155,185 NORTHSTARMLS as Distributed by MLS Grid
- 2000-05-09 Listing Removed — NORTHSTARMLS as Distributed by MLS Grid
- 2000-03-21 Listed $159,900 NORTHSTARMLS as Distributed by MLS Grid
- 1993-10-21 Sold (Public Records) $112,400 Public Records
- 1993-10-15 Sold (MLS) $112,400 NORTHSTARMLS as Distributed by MLS Grid
- 1993-09-04 Listing Removed — NORTHSTARMLS as Distributed by MLS Grid
- 1993-05-16 Listed $114,900 NORTHSTARMLS as Distributed by MLS Grid
- 1989-09-01 Sold (Public Records) $102,570 Public Records
Property tax history
+8.1%/yrLatest (2025): $4,866 · +21.6% YoY. Source: county tax records.
Cash-flow waterfall
monthlySold comps — $/sqft
last 12 mo · ≤1 miLoading sold comps…