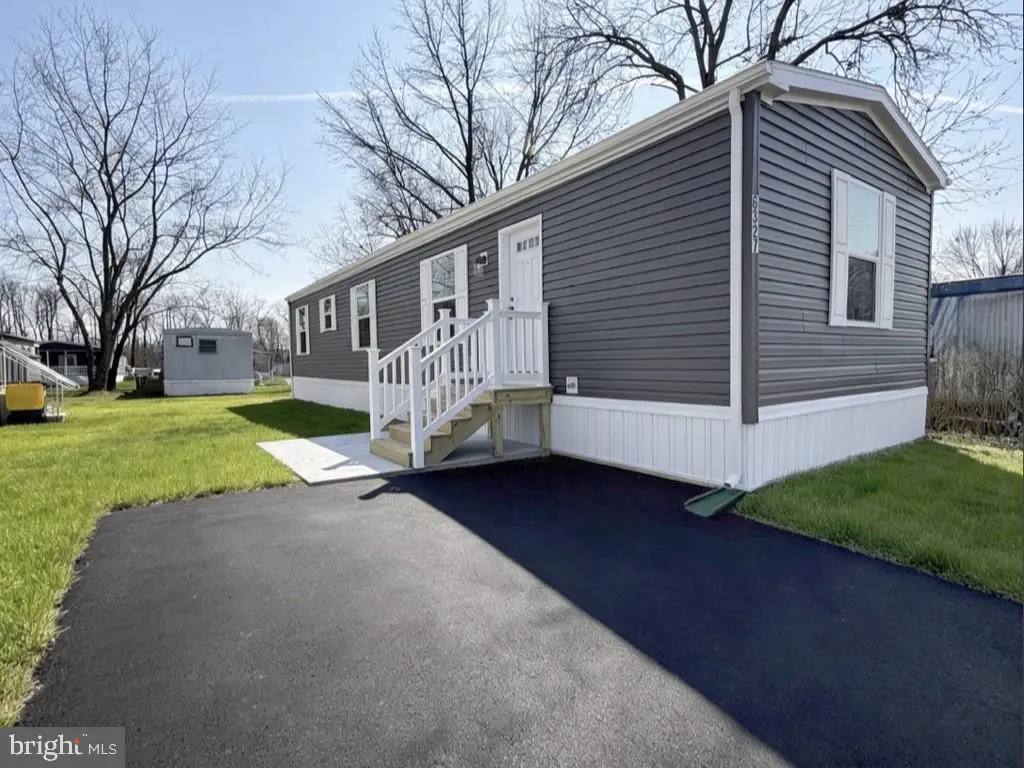
6327 Fuller Dr · Falls, PA
Flood risk 1/10 · Minimal
- FEMA flood zone
- X (unshaded)
- Chance of flooding over 30 yrs
- 0.0%
- Est. flood insurance / yr
- $473 – $860
Fire risk 1/10 · Minimal
- Est. fire insurance / yr
- $511 – $949
Heat risk 6/10 · Moderate
- Hot days now (above 103°F)
- 7 days/yr
- Hot days in 30 yrs
- 15 days/yr
Wind risk 6/10 · Moderate
- Chance of severe wind over 30 yrs
- 27.0%
Air-quality risk 5/10 · Moderate
- Unhealthy air days now
- 6 days/yr
- Unhealthy air days in 30 yrs
- 8 days/yr
Risk factors via First Street. Map © Google.
Why this score? — see what drove the C+ grade
The composite is a weighted blend of 9 inputs, each scored 0–100. Each bar is that input's sub-score; the figure is the points it added to the 100-point composite (weight × sub-score).
- Cash flow +30.0/30.0
- DSCR +10.0/10.0
- 1% rule +9.5/10.0
- Schools +5.2/10.0
- Condition / age +4.0/5.0
- Rent growth +3.3/5.0
- Livability +2.5/5.0
- ARV discount +0.0/15.0
- Appreciation +0.0/10.0
$144,000
🖨 Deal sheet 📄 Offer letter ✓ Due diligence
Listing remarks MLS
New 2-bedroom, 1 bath home with open living space. The kitchen has counter height seating, plenty of cabinet space, stainless steel sink, and appliances. Two bedrooms with nice sized closets and a hall bath with tub/shower combo. The home comes with central air, an 8’ x 8’ shed and a 1-year manufacturer warranty plus a 2 through 7-year warranty paid for by the factory. Schedule your showing today. * * Driveways are being redone on April 7th and the lots have been graded and seed – Outside Photos only are AI generated
Key facts
- Stainless steel sink
- 8 x 8 shed
- Open living space
Tags
Neighborhood map
What this means for you Summary
Snapshot
- This is a 2-bed/1.0-bath single-family listed at $144k. Condition is rated good.
Deal economics
- At list price, monthly cash flow is $651 ($8k/yr) — positive.
- The deal already cash-flows at list — no discount required.
- Meets the 1% rule at list price ($2k rent vs $144k).
- Recommended offer: $135k (6.0% below list) — sets the bar for market timing.
Location & tenants
- Location reads: area grade C — affects rentability + tenant quality, not the cash-flow math above.
- Pennsbury SD (suburban): math 46% / reading 69% proficiency, ranked #67 of 539 in PA (top 12%) — acceptable for families but not a draw, mixed tenant base, ~2y average lease; only 15% free/reduced lunch — higher-income household profile.
- Market conditions: Rents rising (+3.1%/yr); 168 active listings in the ZIP; high-income renter base; 663 units permitted in Bucks County in 2024 (106 in 5+ unit buildings).
Forward outlook
- Local home prices are declining (-3.0%/yr); year-one equity from $996 of loan paydown is wiped out by about $4k of value loss. Plan a longer hold.
- Bucks County population projected to shrink 7% by 2050 — rents likely to lag national; underwrite the cash flow, not the appreciation.
- At projected returns (-3.0% appreciation + 3.1% rent growth), your $40k cash investment doubles in ~7 years — after that, you're playing with house money.
Negotiation context
- It's been on market 81 days — a 6% lower offer ($135k) is reasonable based on typical stale-listing flexibility.
Risks & watch-outs
- Climate carrying-cost: major wind risk, 27% chance of damaging wind over 30y; extreme-heat days projected 7→15/yr by 2055 (HVAC capex compounding) — expect insurance premiums to compound above CPI over the hold.
Questions for the listing agent
- It's been on market 81 days. Have you received any prior offers? Is the seller open to a 6% concession, seller financing, or rate buy-down credit?
- Why hasn't it sold? Are there any deal-killer items the seller is aware of (foundation, flood, title, zoning, code violations)?
- Is there a deadline driving the sale (1031 exchange, divorce, estate, relocation)? That informs how much negotiation room exists.
- What's the average days-on-market for RENTAL listings here right now (not sales)? A rising rental-DOM trend means longer vacancies and softer asking-rent achievability than the comps imply.
- What's the recent tenant-quality profile in this submarket — average credit score on applications, eviction rate, late-payment / NSF rate, and stable-employment percentage? A property-management company in the area should have these aggregated.
- How much new for-sale + rental construction is in the pipeline within 1–3 miles? Heavy new supply typically softens prices + rents 12–24 months out; constrained supply supports both.
Investment metrics
- 1% rule
- 1.45% ✓
- Cap rate
- 11.72%
- Cash-on-cash
- 19.38%
- DSCR
- 1.86
- GRM
- 5.8
CMA / ARV
- ARV (median comp)
- $103,813
- List price
- $144,000
- Delta
- 38.71%
- Verdict
- OVERPRICED
- Comps
- 20 within 1.0 mi
Show comp detail 12 sales within ~0.75 mi
| Address | Dist | Beds/Ba | Sqft | Sold | Price | $/sf | Match |
|---|---|---|---|---|---|---|---|
| 6412 Finley Dr | 0.06mi | 2/1.0 | 912 (0%) | 14mo | $128,900 | $141 | 86 |
| 1445-LOT 1 Old Bristol Pike #1 | 0.13mi | 1/1.0 (-1) | 896 (-2%) | 6mo | $130,500 | $146 | 81 |
| 6315 Fuller Dr | 0.07mi | 2/2.0 | 910 (-0%) | 16mo | $129,000 | $142 | 79 |
| 9812 Lawson Dr | 0.20mi | 2/2.0 | 938 (+3%) | 11mo | $106,500 | $114 | 73 |
| 6319 Fuller Dr | 0.07mi | 3/2.0 (+1) | 1,000 (+10%) | 1mo | $72,000 | $72 | 71 |
| 5028 Garner Dr | 0.39mi | 2/2.0 | 924 (+1%) | 13mo | $144,500 | $156 | 65 |
| 9908 Lindley Dr | 0.18mi | 3/1.0 (+1) | 980 (+8%) | 14mo | $70,000 | $71 | 63 |
| 4009 Dalton Way | 0.24mi | 2/1.0 | 784 (-14%) | 8mo | $131,500 | $168 | 58 |
| 7503 Harper Dr Unit T 7503 | 0.46mi | 2/2.0 | 980 (+8%) | 5mo | $67,000 | $68 | 58 |
| 9808 Lawson Dr | 0.18mi | 3/2.0 (+1) | 840 (-8%) | 19mo | $75,000 | $89 | 53 |
| 5082 Grace Dr | 0.52mi | 2/2.0 | 1,040 (+14%) | 14mo | $148,900 | $143 | 37 |
| 9202 Wheatsheaf Rd | 0.62mi | 2/1.0 | 1,042 (+14%) | 22mo | $306,000 | $294 | 29 |
Match score weights: distance 35% · size 25% · config 20% · recency 20%. Top-matched comps best support the ARV.
Projected returns pro-forma
-3.0% appreciation · 3.12% rent growth · sell at horizon
- IRR
- 11.5%
- Equity multiple
- 1.46×
- Total profit
- $18,427
- Equity at exit
- $21,471
- IRR
- 20.6%
- Equity multiple
- 2.75×
- Total profit
- $70,619
- Equity at exit
- $12,450
Cash invested: $40,320 (down + closing). Projections, not guarantees.
Landlord ↔ Tenant lean methodology
- Overall (STATE)
- 62 Landlord-Friendly
- State Pennsylvania
- 62 Landlord-Friendly · EVEN
- County
- — inherits STATE
- City
- — inherits STATE
ZIP-level market 19067
- Rents YoY
- 3.1%
- Active inventory
- 168
- Price-to-rent
- 5.8×
Monthly cashflow live
- Estimated rent
- $2,084 medium interval (Pro) →
- Mortgage (P&I)
- −$755
- Tax est. 1.5%
- −$180 /mo · $2,160/yr
- Insurance
- −$60
- HOA
- −$0
- Vacancy / Maint / Mgmt
- −$438
- Net cashflow
- $651
Break-even live
UW: 25.0% down · 7.5% · 30yr · 1.5% tax · 5.0% vac · 8.0% maint · 8.0% mgmt
Financing live
Cash to close
- Down payment
- $36,000
- Closing costs
- $4,320
- Reserves months
- —
- Total cash needed
- —
Loan-product check · same deal, 3 products live
Conventional
25% down · 7.5% · 30yr
- Down + closing
- —
- Monthly P&I
- —
- Monthly cashflow
- —
- DSCR
- —
- Eligible?
- —
Personal DTI + credit; lowest rate.
DSCR
20% down · 8.5% · 30yr
- Down + closing
- —
- Monthly P&I
- —
- Monthly cashflow
- —
- DSCR
- —
- Eligible?
- —
No personal income docs; deal must DSCR.
Hard money
10% down · 12.0% · 12mo
- Down + closing
- —
- Monthly P&I
- —
- Monthly cashflow
- —
- DSCR
- —
- Eligible?
- —
Short-term bridge; refi at stabilization.
Listing history 15 events
-
2026-06-18days on market $144,000 Active 81 DOM
-
2026-06-17days on market $144,000 Active 80 DOM
-
2026-06-16days on market $144,000 Active 79 DOM
-
2026-06-15days on market $144,000 Active 78 DOM
-
2026-06-13days on market $144,000 Active 76 DOM
-
2026-06-13days on market $144,000 Active 75 DOM
-
2026-06-09days on market $144,000 Active 72 DOM
-
2026-06-08days on market $144,000 Active 71 DOM
-
2026-06-07days on market $144,000 Active 70 DOM
-
2026-06-04days on market $144,000 Active 67 DOM
-
2026-06-03days on market $144,000 Active 66 DOM
-
2026-06-02days on market $144,000 Active 65 DOM
-
2026-06-01days on market $144,000 Active 64 DOM
-
2026-05-31days on market $144,000 Active 63 DOM
-
2026-03-29$144,000 Active 541-char remark
Show marketing remark (541 chars)
New 2-bedroom, 1 bath home with open living space. The kitchen has counter height seating, plenty of cabinet space, stainless steel sink, and appliances. Two bedrooms with nice sized closets and a hall bath with tub/shower combo. The home comes with central air, an 8’ x 8’ shed and a 1-year manufacturer warranty plus a 2 through 7-year warranty paid for by the factory. Schedule your showing today. * * Driveways are being redone on April 7th and the lots have been graded and seed – Outside Photos only are AI generated
ⓘ Source: listings_history table (triggers on properties + properties_extension) + one-shot
backfill from property_details.listing_events for pre-trigger history.
Climate risk First Street
- Flood 1/10 Low FEMA zone X (unshaded) · 0% chance over 30 yrs
- Wildfire 1/10 Low
- Heat 6/10 Major 7 d/yr ≥103°F today · 15 d/yr by 30 yrs out
- Wind 6/10 Major 27% chance of damaging wind over 30 yrs
- Air quality 5/10 Major 6 unhealthy d/yr today · 8 by 30 yrs out
Nearby sold comps map
Loading sold comps map…
Walkable amenities ~0.75 mi
Loading nearby amenities…
Taxation est. · year 1
- Rental income
- $25,008
- − Mortgage interest
- −$8,066
- − Property taxes
- −$2,160
- − Insurance
- −$720
- − Repairs & maintenance
- −$2,001
- − Management
- −$2,001
- − Depreciation
- −$4,189
- Taxable income
- $5,872
- Est. tax owed @ 24.0%
- −$1,409
- After-tax cash flow
- $6,406/yr
For passive investors: Depreciation is non-cash, so a rental often shows a tax loss while cash-flowing — sheltering income. Rental losses are passive: they offset passive income freely, and up to $25,000/yr can offset ordinary (W-2) income if you actively participate and your MAGI is under $100k (phasing out to $0 by $150k); unused losses carry forward. On sale, claimed depreciation is recaptured at up to 25%, and gains may owe capital-gains tax (a 1031 exchange can defer both). Figures are a year-1 estimate at your 24.0% rate — not tax advice; consult a CPA.
Condition & rehab AI · 12 photos
This home is in good condition with a modern kitchen and well-maintained exterior. It has potential for further value increases through minor cosmetic improvements and smart home features.
Value-add opportunities
- Both Painting exterior and interior walls — Fresh paint can enhance curb appeal and interior aesthetics.
- Both Landscaping improvements — Enhanced landscaping can increase curb appeal and property value.
- Both Add a small outdoor seating area — A small outdoor seating area can increase the appeal for both resale and rental purposes.
- Both Install smart home features — Smart home features can increase the home's appeal and value for both buyers and renters.
- Both Add a small outdoor storage shed — A small outdoor storage shed can increase the home's functionality and appeal for both resale and rental purposes.
Renovation cost estimate screening
Value-add ROI direction
- Both Painting exterior and interior walls — Fresh paint can enhance curb appeal and interior aesthetics. ↑
- Both Landscaping improvements — Enhanced landscaping can increase curb appeal and property value. ↑
- Both Add a small outdoor seating area — A small outdoor seating area can increase the appeal for both resale and rental purposes. ↑
- Both Install smart home features — Smart home features can increase the home's appeal and value for both buyers and renters. ↑
- Both Add a small outdoor storage shed — A small outdoor storage shed can increase the home's functionality and appeal for both resale and rental purposes. ↑
ⓘ Cost ranges are severity-bucket heuristics (US national rule-of-thumb). Get contractor quotes + a written scope before underwriting a rehab budget.
Schools (NCES district)
- District
- Pennsbury SD
- NCES district ID
- 4218840
- Math proficiency
- 46% ▼ -13.00%
- Reading proficiency
- 69% ▼ -8.00%
- Median HH income
- $85,495
- Composite
- 52.3/100
- National rank
- #1594
- State rank
- #67 of 539 in PA
Livability — Falls
No livability data for this city. (Only ~50 U.S. cities are tracked.)
Census & demographics
- County
- Bucks County · 506,477 people
- Metro
- Philadelphia-Camden-Wilmington, PA-NJ-DE-MD
- Population (ZIP)
- 53,885
- Household income
- $133,630
- Rent vs Own
- Severe rent burden
- 1036.0
Population outlook (Bucks County) Hauer SSP2
- Today (2025)
- 630,973 people
- By 2030
- 627,093 · -0.6%
- By 2040
- 609,680 · -3.4%
- By 2050
- 584,225 · -7.4%
- By 2075
- 539,840 · -14.4%
- By 2100
- 483,970 · -23.3%
Race, ethnicity, and origin ACS 2023
- Neighborhood character
- Predominantly White (80%)
- Race & ethnicity
- White 80% Hispanic / Latino 7% Asian 6% Two or more races 5% Black 4%
- Hispanic origin (detail)
- Mexican 2% Puerto Rican 1% Dominican 1%
- Common ancestry
- Romanian 10% Scotch-Irish 2% Italian 2%
- Foreign-born
- 11% · Canada, China, Jamaica
- Languages at home
- 88% English-only · Spanish 5% Other Indo-European 3% Russian/Polish/Slavic 2%
Political lean MEDSL · Bucks
- 2024 margin
- Toss-up / Even · D 49.5% · R 49.5%
- 2008→2024 swing
- -8.7pp toward R · 2008: 8.7pp · 2024: -0.1pp
- All cycles
- 2024: R+0.1 2020: D+4.4 2016: D+0.6 2012: D+1.2 2008: D+8.7
Not yet ingested
- Civics
- —
Market trends
- HPI YoY
- ▼ -435.62%
- Current HPI
- 281.8167
- Rent YoY
- ▲ 3.12%
- Metro
- Philadelphia-Camden-Wilmington, PA-NJ-DE-MD
- State GDP YoY
- ▲ 1.68%
- F500 in state
- 34
Industry mix (Fortune 500 HQ in PA)
| Industry | F500 HQs | Revenue |
|---|---|---|
| Healthcare | 2 | $309B |
|
||
| Insurance | 2 | $27B |
|
||
| Telecommunications / Media | 1 | $124B |
|
||
| Industrial Distribution | 1 | $22B |
|
||
| Financial Services | 1 | $20B |
|
||
| Chemicals / Materials | 1 | $18B |
|
||
Price history
1 event — show timeline
- 2026-03-29 Listed $144,000 BRIGHT MLS
Cash-flow waterfall
monthlySold comps — $/sqft
last 12 mo · ≤1 miLoading sold comps…