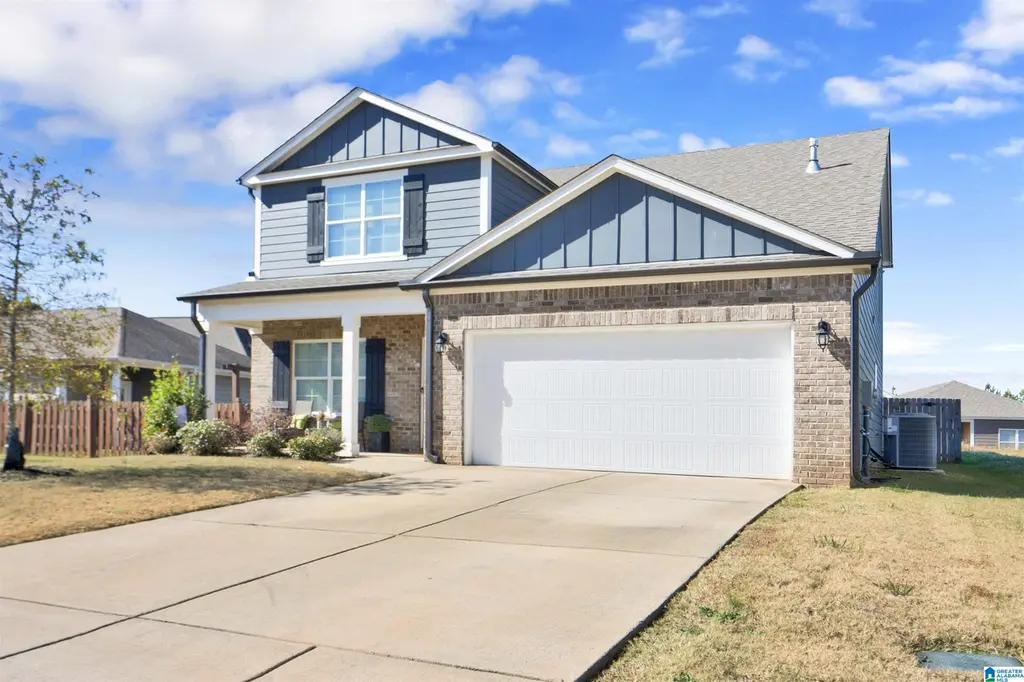
5849 Ridgeline Dr · McCalla, AL
Flood risk 1/10 · Minimal
- FEMA flood zone
- X (unshaded)
- Chance of flooding over 30 yrs
- 0.0%
- Est. flood insurance / yr
- $507 – $1,088
Fire risk 4/10 · Minor
- Est. fire insurance / yr
- $916 – $1,700
Heat risk 6/10 · Moderate
- Hot days now (above 108°F)
- 7 days/yr
- Hot days in 30 yrs
- 19 days/yr
Wind risk 6/10 · Moderate
- Chance of severe wind over 30 yrs
- 44.0%
Air-quality risk 2/10 · Minimal
- Unhealthy air days now
- 2 days/yr
- Unhealthy air days in 30 yrs
- 2 days/yr
Risk factors via First Street. Map © Google.
Why this score? — see what drove the F grade
The composite is a weighted blend of 9 inputs, each scored 0–100. Each bar is that input's sub-score; the figure is the points it added to the 100-point composite (weight × sub-score).
- ARV discount +7.7/15.0
- Cash flow +7.4/30.0
- Rent growth +5.0/5.0
- Livability +2.5/5.0
- Condition / age +2.5/5.0
- Schools +1.8/10.0
- DSCR +1.5/10.0
- 1% rule +1.2/10.0
- Appreciation +0.0/10.0
$362,900
🖨 Deal sheet (PDF) 📄 Offer letter ✓ Due diligence
Listing remarks MLS
Thanks for taking the time to read me but will you take the time to see me? I have everything you've been looking for, from the fence yard, screened in porch, master on the main and easy access to anywhere you want to go! I can tell you what you want to hear but I rather you see me for yourself. With this weather being cold, if you make me your home, I'll keep you warm! Hopefully, I'll see you soon!
Key facts
- Screened in porch
- Fenced yard
- Master on the main
Tags
Neighborhood map
What this means for you Summary
Snapshot
- This is a 4-bed/2.0-bath single-family listed at $363k.
Deal economics
- At list price, monthly cash flow is $-466 ($-6k/yr) — negative.
- To cash-flow at today's rent, offer at most $280k (22.7% below list).
- To meet the 1% rule (rent ≥ 1% of price), the offer needs to be $224k (38.4% below list).
- Recommended offer: $224k (38.4% below list) — sets the bar for 1% rule.
Location & tenants
- Location reads: area grade F — affects rentability + tenant quality, not the cash-flow math above.
- Jefferson County (suburban): math 9% / reading 32% proficiency, ranked #104 of 129 in AL (top 81%) — low school quality limits family demand, transient renter base, plan for 1-2y turnover.
- Zoned schools: Mcadory Elementary School (math 14% / reading 40%, grade F, #392 of 627 statewide, top 65%, 667 students, 61% FRL); Mcadory Middle School (math 2% / reading 33%, grade F, #199 of 257 statewide, top 77%, 854 students, 74% FRL); Mcadory High School (math 8% / reading 17%, grade F, #237 of 305 statewide, top 78%, 1,162 students, 72% FRL) — zoned schools average 69% FRL vs 49% district-wide (21 pts higher); higher-poverty schools than district average — tighter screening recommended.
- Market conditions: Rents rising fast (+14.8%/yr); 311 active listings in the ZIP; 3 comparable units currently listed for rent nearby; rentals leasing fast (median 4d on market — plan ~1-2 weeks tenant-placement turnaround); solid renter incomes; 2,114 units permitted in Jefferson County in 2024 (556 in 5+ unit buildings).
- This rent runs 33% of the median local income ($82k/yr) — at the standard rent-burdened threshold; future hikes will face affordability resistance.
Forward outlook
- Local home prices are declining (-3.0%/yr); year-one equity from $3k of loan paydown is wiped out by about $11k of value loss. Plan a longer hold.
- Jefferson County population projected to shrink 4% by 2050 — rents likely to lag national; underwrite the cash flow, not the appreciation.
Negotiation context
- It's been on market 216 days — a 12% lower offer ($319k) is reasonable based on typical stale-listing flexibility.
- 2 sale attempts with the ask held roughly flat each time — persistent listings suggest the price (not the market) is what's stuck; bring a comps-based counter.
Risks & watch-outs
- Climate carrying-cost: major wind risk, 44% chance of damaging wind over 30y; extreme-heat days projected 7→19/yr by 2055 (HVAC capex compounding) — expect insurance premiums to compound above CPI over the hold.
Questions for the listing agent
- What do current leases actually rent for vs. the listed asking? Can we see a recent rent roll and the last 12 months of T-12 income?
- It's been on market 216 days. Have you received any prior offers? Is the seller open to a 38% concession, seller financing, or rate buy-down credit?
- What does the HOA fee cover, when was the last increase, and are there any pending special assessments or reserve-fund shortfalls?
- Why hasn't it sold? Are there any deal-killer items the seller is aware of (foundation, flood, title, zoning, code violations)?
- Is there a deadline driving the sale (1031 exchange, divorce, estate, relocation)? That informs how much negotiation room exists.
- The area grade is low — what's the realistic commute time and amenity access for the typical tenant pool here? Any planned neighborhood developments (good or bad) we should know about?
- What's the average days-on-market for RENTAL listings here right now (not sales)? A rising rental-DOM trend means longer vacancies and softer asking-rent achievability than the comps imply.
- What's the recent tenant-quality profile in this submarket — average credit score on applications, eviction rate, late-payment / NSF rate, and stable-employment percentage? A property-management company in the area should have these aggregated.
- How much new for-sale + rental construction is in the pipeline within 1–3 miles? Heavy new supply typically softens prices + rents 12–24 months out; constrained supply supports both.
Investment metrics
- 1% rule
- 0.62% ✗
- Cap rate
- 4.75%
- Cash-on-cash
- -5.51%
- DSCR
- 0.75
- GRM
- 13.5
CMA / ARV
- ARV (median comp)
- $364,769
- List price
- $362,900
- Delta
- -0.51%
- Verdict
- FAIR
- Comps
- 20 within 1.0 mi
Show comp detail 12 sales within ~0.75 mi
| Address | Dist | Beds/Ba | Sqft | Sold | Price | $/sf | Match |
|---|---|---|---|---|---|---|---|
| 4935 Owens Loop | 0.18mi | 3/2.0 (-1) | 1,469 (+2%) | 10mo | $270,000 | $184 | 74 |
| 4617 Riverbirch Ln | 0.53mi | 3/2.0 (-1) | 1,412 (-2%) | 8mo | $268,000 | $190 | 61 |
| 4456 Rosser Farms Pkwy | 0.38mi | 3/2.0 (-1) | 1,618 (+13%) | 4mo | $314,900 | $195 | 53 |
| 5733 Riverbirch Dr | 0.59mi | 3/2.0 (-1) | 1,561 (+9%) | 3mo | $249,000 | $160 | 50 |
| 5809 Riverbirch Dr | 0.44mi | 3/2.0 (-1) | 1,635 (+14%) | 4mo | $260,000 | $159 | 48 |
| 4501 Rosser Farms Pkwy | 0.52mi | 3/2.0 (-1) | 1,618 (+13%) | 4mo | $299,900 | $185 | 46 |
| 4468 Rosser Farms Pkwy | 0.49mi | 3/2.0 (-1) | 1,618 (+13%) | 10mo | $319,900 | $198 | 42 |
| 5179 Meadow Ridge Trl | 0.47mi | 3/2.0 (-1) | 1,618 (+13%) | 13mo | $309,900 | $192 | 41 |
| 5187 Meadow Ridge Trl | 0.53mi | 3/2.0 (-1) | 1,618 (+13%) | 11mo | $309,900 | $192 | 40 |
| 5143 Meadow Ridge Trl | 0.58mi | 3/2.0 (-1) | 1,618 (+13%) | 11mo | $314,900 | $195 | 37 |
| 5721 Riverbirch Dr | 0.62mi | 3/2.0 (-1) | 1,617 (+13%) | 12mo | $270,000 | $167 | 35 |
| 5159 Meadow Ridge Trl | 0.58mi | 3/2.0 (-1) | 1,618 (+13%) | 14mo | $304,900 | $188 | 35 |
Match score weights: distance 35% · size 25% · config 20% · recency 20%. Top-matched comps best support the ARV.
Projected returns pro-forma
-3.0% appreciation · 8.0% rent growth · sell at horizon
- IRR
- -21.0%
- Equity multiple
- 0.24×
- Total profit
- $-76,827
- Equity at exit
- $54,110
- IRR
- -6.7%
- Equity multiple
- 0.49×
- Total profit
- $-51,891
- Equity at exit
- $31,377
Cash invested: $101,612 (down + closing). Projections, not guarantees.
Landlord ↔ Tenant lean methodology
- Overall (STATE)
- 90 Strongly Landlord-Friendly
- State Alabama
- 90 Strongly Landlord-Friendly · R+15
- County
- — inherits STATE
- City
- — inherits STATE
ZIP-level market 35022
- Home prices YoY
- -20.2%
- Rents YoY
- 14.8%
- Active inventory
- 311
- Price-to-rent
- 13.5×
Monthly cashflow live
- Estimated rent
- $2,237 medium interval (Pro) →
- Mortgage (P&I)
- −$1,903
- Tax from tax record
- −$147 /mo · $1,759/yr
- Insurance
- −$151
- HOA
- −$33
- Vacancy / Maint / Mgmt
- −$470
- Net cashflow
- $-466
Break-even live
Sensitivity live
| Price | -10% $-261 | -5% $-364 | +0% $-466 | +5% $-569 | +10% $-672 |
|---|---|---|---|---|---|
| Rent | -10% $-643 | -5% $-555 | +0% $-466 | +5% $-378 | +10% $-290 |
| Rate | -1.0pp $-284 | -0.5pp $-374 | base $-466 | +0.5pp $-561 | +1.0pp $-656 |
UW: 25.0% down · 7.5% · 30yr · 1.5% tax · 5.0% vac · 8.0% maint · 8.0% mgmt
Financing live
Cash to close
- Down payment
- $90,725
- Closing costs
- $10,887
- Reserves months
- —
- Total cash needed
- —
Loan-product check · same deal, 3 products live
Conventional
25% down · 7.5% · 30yr
- Down + closing
- —
- Monthly P&I
- —
- Monthly cashflow
- —
- DSCR
- —
- Eligible?
- —
Personal DTI + credit; lowest rate.
DSCR
20% down · 8.5% · 30yr
- Down + closing
- —
- Monthly P&I
- —
- Monthly cashflow
- —
- DSCR
- —
- Eligible?
- —
No personal income docs; deal must DSCR.
Hard money
10% down · 12.0% · 12mo
- Down + closing
- —
- Monthly P&I
- —
- Monthly cashflow
- —
- DSCR
- —
- Eligible?
- —
Short-term bridge; refi at stabilization.
Rent comps 3 comps
| Address | Beds | Baths | Sqft | Rent | $/sqft | DOM | Units | Dist |
|---|---|---|---|---|---|---|---|---|
| 5725 Riverbirch Dr Bessemer, AL | 3.0 | 2.0 | 1620 | $2,050 | $1.27 | 3d | 1 | 0.63mi |
| 4737 Longmeadow Dr Bessemer, AL | 3.0 | 2.0 | 1356 | $1,815 | $1.34 | 12d | 1 | 1.07mi |
| 4737 Rosser Loop Dr Bessemer, AL | 3.0 | 2.0 | 1638 | $1,886 | $1.15 | 3d | 1 | 1.07mi |
HOA detail
- Monthly dues
- $33 · $396/yr
Listing history 19 events
-
2026-06-22days on market $362,900 Active 216 DOM
-
2026-06-18days on market $362,900 Active 213 DOM
-
2026-06-17days on market $362,900 Active 212 DOM
-
2026-06-16days on market $362,900 Active 211 DOM
-
2026-06-15days on market $362,900 Active 210 DOM
-
2026-06-13days on market $362,900 Active 208 DOM
-
2026-06-10days on market $362,900 Active 205 DOM
-
2026-06-09days on market $362,900 Active 204 DOM
-
2026-06-08days on market $362,900 Active 203 DOM
-
2026-06-07days on market $362,900 Active 202 DOM
-
2026-06-03days on market $362,900 Active 198 DOM
-
2026-06-02days on market $362,900 Active 197 DOM
-
2026-06-01days on market $362,900 Active 196 DOM
-
2026-05-31days on market $362,900 Active 195 DOM
-
2025-11-25price $362,900 402-char remark
Show marketing remark (402 chars)
Thanks for taking the time to read me but will you take the time to see me? I have everything you've been looking for, from the fence yard, screened in porch, master on the main and easy access to anywhere you want to go! I can tell you what you want to hear but I rather you see me for yourself. With this weather being cold, if you make me your home, I'll keep you warm! Hopefully, I'll see you soon!
-
2025-11-17$379,900 Active 402-char remark
Show marketing remark (402 chars)
Thanks for taking the time to read me but will you take the time to see me? I have everything you've been looking for, from the fence yard, screened in porch, master on the main and easy access to anywhere you want to go! I can tell you what you want to hear but I rather you see me for yourself. With this weather being cold, if you make me your home, I'll keep you warm! Hopefully, I'll see you soon!
-
2025-10-11price $379,900
-
2025-09-29price $399,900
-
2025-08-25$435,900 Active
ⓘ Source: listings_history table (triggers on properties + properties_extension) + one-shot
backfill from property_details.listing_events for pre-trigger history.
Tax reassessment forecast AL · Resets to sale price
- Current annual tax
- $1,759 · $147/mo
- Projected year-2 tax
- $1,759 · $147/mo
- Expected delta
- $0/yr ($0/mo · 0.0%)
ⓘ Screening estimate from a state-policy table — verify with the county assessor before closing.
Climate risk First Street
- Flood 1/10 Low FEMA zone X (unshaded) · 0% chance over 30 yrs
- Wildfire 4/10 Moderate
- Heat 6/10 Major 7 d/yr ≥108°F today · 19 d/yr by 30 yrs out
- Wind 6/10 Major 44% chance of damaging wind over 30 yrs
- Air quality 2/10 Low 2 unhealthy d/yr today · 2 by 30 yrs out
Nearby sold comps map
Loading sold comps map…
Walkable amenities ~0.75 mi
Loading nearby amenities…
Taxation est. · year 1
- Rental income
- $26,846
- − Mortgage interest
- −$20,328
- − Property taxes
- −$1,759
- − Insurance
- −$1,814
- − Repairs & maintenance
- −$2,148
- − Management
- −$2,148
- − HOA
- −$396
- − Depreciation
- −$10,557
- Taxable loss
- −$12,303
- Est. tax savings @ 24.0%
- +$2,953
- After-tax cash flow
- $-2,645/yr
For passive investors: Depreciation is non-cash, so a rental often shows a tax loss while cash-flowing — sheltering income. Rental losses are passive: they offset passive income freely, and up to $25,000/yr can offset ordinary (W-2) income if you actively participate and your MAGI is under $100k (phasing out to $0 by $150k); unused losses carry forward. On sale, claimed depreciation is recaptured at up to 25%, and gains may owe capital-gains tax (a 1031 exchange can defer both). Figures are a year-1 estimate at your 24.0% rate — not tax advice; consult a CPA.
Schools (NCES district)
- District
- Jefferson County
- NCES district ID
- 0101920
- Math proficiency
- 9% ▼ -24.00%
- Reading proficiency
- 32% ▼ -5.00%
- Median HH income
- $51,712
- Composite
- 18.4/100
- National rank
- #8937
- State rank
- #104 of 129 in AL
Livability — McCalla
No livability data for this city. (Only ~50 U.S. cities are tracked.)
Census & demographics
- Census place
- McCalla, AL
- County
- Jefferson County · 527,445 people
- Metro
- Birmingham-Hoover, AL
- Population (ZIP)
- 23,126
- Household income
- $81,846
- Rent vs Own
- Severe rent burden
- 554.0
Population outlook (Jefferson County) Hauer SSP2
- Today (2025)
- 669,185 people
- By 2030
- 669,694 · +0.1%
- By 2040
- 661,388 · -1.2%
- By 2050
- 643,086 · -3.9%
- By 2075
- 577,267 · -13.7%
- By 2100
- 474,758 · -29.1%
Race, ethnicity, and origin ACS 2023
- Neighborhood character
- Diverse neighborhood (Simpson 0.56)
- Race & ethnicity
- Black 53% White 41% Hispanic / Latino 3% Two or more races 2% Asian 1%
- Common ancestry
- Italian 1% Slovak 1% Iranian 1%
- Foreign-born
- 4% · Canada, China
- Languages at home
- 96% English-only · Spanish 3% Chinese 1%
Political lean MEDSL · Jefferson
- 2024 margin
- D (+10.4) · D 54.6% · R 44.2% · Other 1.2%
- 2008→2024 swing
- +5.4pp toward D · 2008: 5.1pp · 2024: 10.4pp
- All cycles
- 2024: D+10.4 2020: D+13.2 2016: D+7.2 2012: D+6.0 2008: D+5.1
Not yet ingested
- Civics
- —
Market trends
- HPI YoY
- ▼ -55.40%
- Current HPI
- 219.3839
- Rent YoY
- ▲ 14.80%
- Metro
- Birmingham-Hoover, AL
- State GDP YoY
- ▲ 2.94%
- F500 in state
- 4
Industry mix (Fortune 500 HQ in AL)
| Industry | F500 HQs | Revenue |
|---|---|---|
| Financial Services | 1 | $8B |
|
||
| Healthcare | 1 | $5B |
|
||
Price history
-16.7% since first listed5 events — show timeline
- 2025-11-25 Price Changed $362,900 Greater Alabama MLS
- 2025-11-17 Listed $379,900 Greater Alabama MLS
- 2025-10-11 Price Changed $379,900 Greater Alabama MLS
- 2025-09-29 Price Changed $399,900 Greater Alabama MLS
- 2025-08-25 Listed $435,900 WAMLS
Property tax history
-17.3%/yrLatest (2025): $1,759 · -0.8% YoY. Source: county tax records.
Cash-flow waterfall
monthlySold comps — $/sqft
last 12 mo · ≤1 miLoading sold comps…