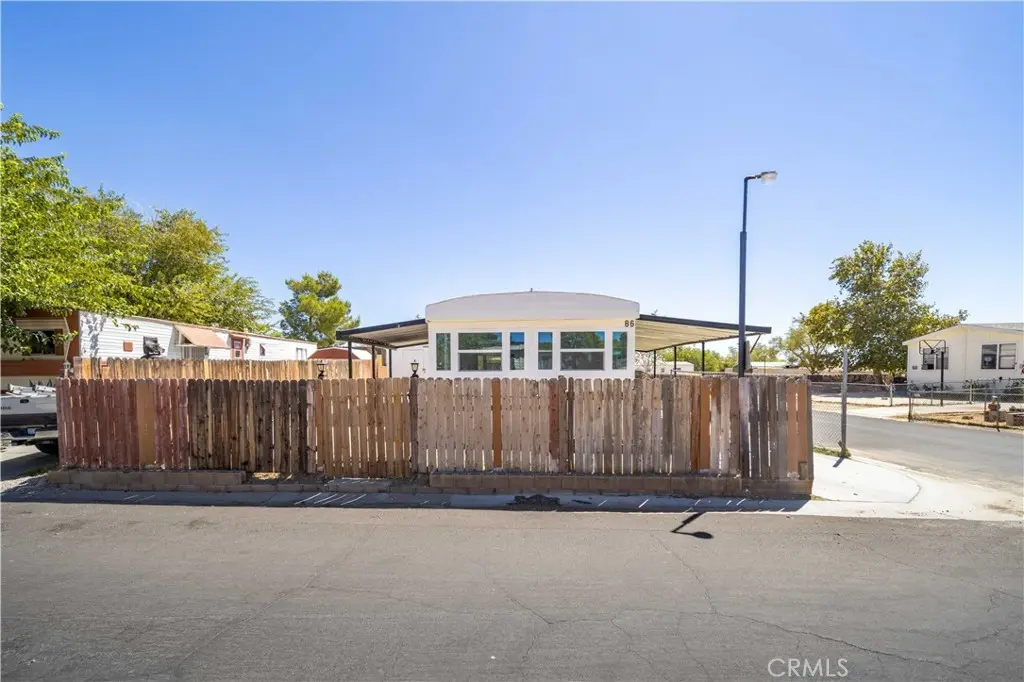
3300 15th W · Rosamond, CA
Flood risk 1/10 · Minimal
- FEMA flood zone
- X (shaded)
- Chance of flooding over 30 yrs
- 0.0%
- Est. flood insurance / yr
- $507 – $1,088
Fire risk 5/10 · Moderate
- Est. fire insurance / yr
- $659 – $1,223
Heat risk 7/10 · Major
- Hot days now (above 101°F)
- 5 days/yr
- Hot days in 30 yrs
- 14 days/yr
Wind risk 1/10 · Minimal
- Chance of severe wind over 30 yrs
- —
Air-quality risk 7/10 · Major
- Unhealthy air days now
- 14 days/yr
- Unhealthy air days in 30 yrs
- 18 days/yr
Risk factors via First Street. Map © Google.
Why this score? — see what drove the B grade
The composite is a weighted blend of 9 inputs, each scored 0–100. Each bar is that input's sub-score; the figure is the points it added to the 100-point composite (weight × sub-score).
- Cash flow +30.0/30.0
- 1% rule +10.0/10.0
- DSCR +10.0/10.0
- ARV discount +7.5/15.0
- Appreciation +6.2/10.0
- Rent growth +2.5/5.0
- Livability +2.5/5.0
- Condition / age +2.5/5.0
- Schools +2.2/10.0
$99,999
🖨 Deal sheet 📄 Offer letter ✓ Due diligence
Listing remarks MLS
Newly remodeled and move in ready. Property features 2 bedrooms and 2 bathrooms. In a great location in Rosamond close to grocery stores and freeways.
Key facts
- 2 parking spots
- Built 1964
- Listed 56 days
Neighborhood map
What this means for you Summary
Snapshot
- This is a 2-bed/2.0-bath land listed at $100k.
Deal economics
- At list price, monthly cash flow is $719 ($9k/yr) — positive.
- The deal already cash-flows at list — no discount required.
- Meets the 1% rule at list price ($2k rent vs $100k).
- Recommended offer: $97k (3.0% below list) — sets the bar for market timing.
- Cap rate 14.9% vs local median 4.3% in Rosamond — top-decile yield for the area; either an underpriced asset or a hidden risk that comps aren't pricing in. Stress-test before assuming the spread holds.
Location & tenants
- Location reads 49/100 on livability (#1,178 in CA) — a working-class tenant base; expect higher turnover. Strengths: housing A+; Watch: schools F, crime F, amenities F.
- Southern Kern Unified (town): math 25% / reading 25% proficiency, ranked #387 of 517 in CA (top 75%) — low school quality limits family demand, transient renter base, plan for 1-2y turnover; 67% free/reduced lunch — lower-income household profile, screen leases tightly.
- Market conditions: 458 active listings in the ZIP; 23 comparable units currently listed for rent nearby; rentals leasing fast (median 1d on market — plan ~1-2 weeks tenant-placement turnaround); solid renter incomes; 3,244 units permitted in Kern County in 2024 (73 in 5+ unit buildings).
Forward outlook
- In year one you build about $3k of equity ($691 loan paydown + $2k appreciation (2.4% local appreciation)).
- Kern County population projected at +17% by 2050 — long-run rental-demand tailwind backs the buy-and-hold thesis.
- At projected returns (2.4% appreciation + 3.0% rent growth), your $28k cash investment doubles in ~3 years — after that, you're playing with house money.
- By year 10, paydown + projected appreciation supports a ~$30k cash-out refi (75% LTV) — recoverable capital for the next deal without selling this one.
Negotiation context
- It's been on market 57 days — a 3% lower offer ($97k) is reasonable based on typical stale-listing flexibility.
- 23 sale attempts since 22y ago with the ask held roughly flat each time — persistent listings suggest the price (not the market) is what's stuck; bring a comps-based counter.
- Current owner paid $75k; 33% above their basis — modest negotiation headroom, anchor on the comps not their cost.
Risks & watch-outs
- Climate carrying-cost: moderate wildfire risk; extreme-heat days projected 5→14/yr by 2055 (HVAC capex compounding) — expect insurance premiums to compound above CPI over the hold.
Questions for the listing agent
- It's been on market 57 days. Have you received any prior offers? Is the seller open to a 3% concession, seller financing, or rate buy-down credit?
- Built in 1964 — when were the roof, HVAC, electrical panel, plumbing, and water heater last replaced?
- Is there a deadline driving the sale (1031 exchange, divorce, estate, relocation)? That informs how much negotiation room exists.
- Schools are F-rated, which usually means shorter tenancies and higher turnover. Who's the typical renter profile here, and what's been the actual vacancy rate?
- Crime grade is F in this area — have there been break-ins, vandalism, or insurance claims at this property in the last 3 years? What carrier currently insures it and at what premium?
- What's the average days-on-market for RENTAL listings here right now (not sales)? A rising rental-DOM trend means longer vacancies and softer asking-rent achievability than the comps imply.
- What's the recent tenant-quality profile in this submarket — average credit score on applications, eviction rate, late-payment / NSF rate, and stable-employment percentage? A property-management company in the area should have these aggregated.
- How much new for-sale + rental construction is in the pipeline within 1–3 miles? Heavy new supply typically softens prices + rents 12–24 months out; constrained supply supports both.
Investment metrics
- 1% rule
- 1.78% ✓
- Cap rate
- 14.92%
- Cash-on-cash
- 30.80%
- DSCR
- 2.37
- GRM
- 4.7
CMA / ARV
- ARV (median comp)
- $127,204,898
- List price
- $99,999
- Delta
- -99.92%
- Verdict
- UNDERPRICED
- Comps
- 6 within 1.0 mi
Projected returns pro-forma
2.4% appreciation · 3.0% rent growth · sell at horizon
- IRR
- 35.6%
- Equity multiple
- 2.95×
- Total profit
- $54,729
- Equity at exit
- $41,652
- IRR
- 36.3%
- Equity multiple
- 5.81×
- Total profit
- $134,707
- Equity at exit
- $61,726
Cash invested: $28,000 (down + closing). Projections, not guarantees.
Landlord ↔ Tenant lean methodology
- Overall (STATE)
- 18 Strongly Tenant-Friendly
- State California
- 18 Strongly Tenant-Friendly · D+13
- County
- — inherits STATE
- City
- — inherits STATE
ZIP-level market 93560
- Home prices YoY
- 0.6%
- Active inventory
- 458
- Price-to-rent
- 4.7×
Monthly cashflow live
- Estimated rent
- $1,784 high interval (Pro) →
- Mortgage (P&I)
- −$524
- Tax est. 1.5%
- −$125 /mo · $1,500/yr
- Insurance
- −$42
- HOA
- −$0
- Vacancy / Maint / Mgmt
- −$375
- Net cashflow
- $719
Break-even live
UW: 25.0% down · 7.5% · 30yr · 1.5% tax · 5.0% vac · 8.0% maint · 8.0% mgmt
Financing live
Cash to close
- Down payment
- $25,000
- Closing costs
- $3,000
- Reserves months
- —
- Total cash needed
- —
Loan-product check · same deal, 3 products live
Conventional
25% down · 7.5% · 30yr
- Down + closing
- —
- Monthly P&I
- —
- Monthly cashflow
- —
- DSCR
- —
- Eligible?
- —
Personal DTI + credit; lowest rate.
DSCR
20% down · 8.5% · 30yr
- Down + closing
- —
- Monthly P&I
- —
- Monthly cashflow
- —
- DSCR
- —
- Eligible?
- —
No personal income docs; deal must DSCR.
Hard money
10% down · 12.0% · 12mo
- Down + closing
- —
- Monthly P&I
- —
- Monthly cashflow
- —
- DSCR
- —
- Eligible?
- —
Short-term bridge; refi at stabilization.
Rent comps 23 comps
| Address | Beds | Baths | Sqft | Rent | $/sqft | DOM | Units | Dist |
|---|---|---|---|---|---|---|---|---|
| 3400 15th St W Unit 118 Rosamond, CA | 2.0 | 1.5 | 1050 | $1,600 | $1.52 | 10d | 1 | 0.11mi |
| 3400 15th St W Unit 21 Rosamond, CA | 2.0 | 1.0 | 950 | $1,495 | $1.57 | 10d | 1 | 0.12mi |
| 3400 15th St W Rosamond, CA | 2.0 | 1.0 | 1000 | $1,498 | $1.50 | 1d | 4 | 0.18mi |
| 1048 W Rosamond Blvd Rosamond, CA | 1.0 | 1.0 | — | $900 | — | 2d | 1 | 0.56mi |
| 1225 Barrington Ave Rosamond, CA | 3.0 | 2.0 | 1072 | $2,200 | $2.05 | 1d | 1 | 0.57mi |
| 3448 Glendower St Rosamond, CA | 1.0 | 1.0 | — | $800 | — | 1d | 1 | 0.75mi |
| 2821 Desert St Unit C Rosamond, CA | 2.0 | 1.0 | 975 | $1,795 | $1.84 | 1d | 1 | 0.80mi |
| 2910 B St Rosamond, CA | 2.0 | 1.5 | 1775 | $1,542 | $0.87 | 19d | 1 | 0.86mi |
| 1838 Center St Unit A Rosamond, CA | 3.0 | 2.5 | 1495 | $2,000 | $1.34 | 1d | 1 | 0.87mi |
| 1838 Center St Unit A Rosamond, CA | 3.0 | 2.5 | 1475 | $2,000 | $1.36 | 10d | 1 | 0.87mi |
| 2634 Desert St Unit 8 Rosamond, CA | 1.0 | 1.0 | 700 | $1,050 | $1.50 | 1d | 1 | 0.90mi |
| 2612 Desert St #9 Rosamond, CA | 1.0 | 1.0 | 600 | $1,050 | $1.75 | 1d | 1 | 0.92mi |
| 1839 Elm St #4 Rosamond, CA | 1.0 | 1.0 | 700 | $1,099 | $1.57 | 11d | 1 | 0.92mi |
| 1857 Elm St #1 Rosamond, CA | 1.0 | 1.0 | 700 | $1,150 | $1.64 | 18d | 1 | 0.92mi |
| 2541 Diamond St Unit 3 Rosamond, CA | 2.0 | 1.0 | 700 | $1,200 | $1.71 | 1d | 1 | 0.94mi |
| 2300 Panorama Ln Rosamond, CA | 2.0 | 2.0 | 1121 | $2,300 | $2.05 | 43d | 1 | 0.94mi |
| 2841 B St Unit 8 Rosamond, CA | 1.0 | 1.0 | 608 | $1,295 | $2.13 | 1d | 1 | 0.95mi |
| 2416 W Valley Vis Rosamond, CA | 3.0 | 2.0 | 1343 | $2,250 | $1.68 | 15d | 1 | 1.07mi |
| 2436 Horizon Dr Rosamond, CA | 3.0 | 2.0 | 1416 | $4,500 | $3.18 | 43d | 1 | 1.10mi |
| 2516 Starbrite Ave Rosamond, CA | 3.0 | 2.0 | 1542 | $2,900 | $1.88 | 1d | 1 | 1.20mi |
| 2051 Candice Ave Rosamond, CA | 3.0 | 2.0 | 1345 | $2,395 | $1.78 | 15d | 1 | 1.21mi |
| 1933 Harvell St Rosamond, CA | 2.0 | 1.0 | 600 | $1,250 | $2.08 | 1d | 1 | 1.25mi |
| 3317 Dale Ct Rosamond, CA | 3.0 | 2.0 | 1330 | $800 | $0.60 | 1d | 1 | 1.34mi |
Listing history 50 events
-
2026-06-09days on market $99,999 Active 57 DOM
-
2026-06-08days on market $99,999 Active 56 DOM
-
2026-06-07days on market $99,999 Active 55 DOM
-
2026-06-04days on market $99,999 Active 52 DOM
-
2026-06-03days on market $99,999 Active 51 DOM
-
2026-06-02days on market $99,999 Active 50 DOM
-
2026-06-01days on market $99,999 Active 49 DOM
-
2026-05-31days on market $99,999 Active 48 DOM
-
2026-04-13$99,999 Active 150-char remark
Show marketing remark (150 chars)
Newly remodeled and move in ready. Property features 2 bedrooms and 2 bathrooms. In a great location in Rosamond close to grocery stores and freeways.
-
2026-02-19soldstatus $75,000 Closed Sale 793-char remark
Show marketing remark (793 chars)
Comfort, Style, and Affordability! This charming double-wide mobile home features 2 bedrooms, 1 bathrooms, and 672 sq. ft. of functional living space with thoughtful upgrades. Enjoy year-round comfort with new dual-pane windows and the convenience of an indoor laundry area. Step outside to your private side yard, fully fenced for gatherings, BBQs, or simply relaxing outdoors. The community offers fantastic amenities including a sparkling swimming pool, basketball courts, and more. Located just minutes from the 14 Freeway, shopping centers, and Edwards Air Force Base, this home combines comfort and convenience. With low space rent, it's an excellent opportunity for first-time buyers or anyone seeking a well-maintained home at a great value. Don't miss your chance make it yours today!
-
2026-01-29status Pending Sale 793-char remark
Show marketing remark (793 chars)
Comfort, Style, and Affordability! This charming double-wide mobile home features 2 bedrooms, 1 bathrooms, and 672 sq. ft. of functional living space with thoughtful upgrades. Enjoy year-round comfort with new dual-pane windows and the convenience of an indoor laundry area. Step outside to your private side yard, fully fenced for gatherings, BBQs, or simply relaxing outdoors. The community offers fantastic amenities including a sparkling swimming pool, basketball courts, and more. Located just minutes from the 14 Freeway, shopping centers, and Edwards Air Force Base, this home combines comfort and convenience. With low space rent, it's an excellent opportunity for first-time buyers or anyone seeking a well-maintained home at a great value. Don't miss your chance make it yours today!
-
2025-12-30$70,000 Active 793-char remark
Show marketing remark (793 chars)
Comfort, Style, and Affordability! This charming double-wide mobile home features 2 bedrooms, 1 bathrooms, and 672 sq. ft. of functional living space with thoughtful upgrades. Enjoy year-round comfort with new dual-pane windows and the convenience of an indoor laundry area. Step outside to your private side yard, fully fenced for gatherings, BBQs, or simply relaxing outdoors. The community offers fantastic amenities including a sparkling swimming pool, basketball courts, and more. Located just minutes from the 14 Freeway, shopping centers, and Edwards Air Force Base, this home combines comfort and convenience. With low space rent, it's an excellent opportunity for first-time buyers or anyone seeking a well-maintained home at a great value. Don't miss your chance make it yours today!
-
2024-02-22soldstatus $90,000 Closed Sale
-
2024-02-12status Pending Sale
-
2024-02-07soldstatus $90,000 Closed Sale
-
2023-12-20status Pending Sale
-
2023-11-16$93,000 Active
-
2022-12-19historical
-
2022-09-19$85,000 Active
-
2015-08-13historical
-
2015-08-03$19,900 Active
-
2015-03-28historical
-
2015-03-28historical
-
2015-03-28historical
-
2015-03-27historical
-
2015-03-27historical
-
2015-03-27historical
-
2015-03-23historical
-
2015-03-19historical
-
2015-03-19historical
-
2015-03-19historical
-
2015-03-19historical
-
2015-03-18historical
-
2015-03-16historical
-
2015-03-16historical
-
2014-09-10$29,900
-
2014-05-27$25,000
-
2013-11-02$18,500
-
2013-10-30historical
-
2013-09-20$13,500
-
2013-01-01$14,499
-
2012-09-18$14,999
-
2010-07-06$26,900
-
2009-08-07$20,500
-
2009-05-08$25,000
-
2008-09-22historical
-
2008-04-03$34,900
-
2008-01-12$40,000
-
2007-08-26$40,000
-
2007-06-28historical
ⓘ Source: listings_history table (triggers on properties + properties_extension) + one-shot
backfill from property_details.listing_events for pre-trigger history.
Climate risk First Street
- Flood 1/10 Low FEMA zone X (shaded) · 0% chance over 30 yrs
- Wildfire 5/10 Major
- Heat 7/10 Severe 5 d/yr ≥101°F today · 14 d/yr by 30 yrs out
- Wind 1/10 Low
- Air quality 7/10 Severe 14 unhealthy d/yr today · 18 by 30 yrs out
Nearby sold comps map
Loading sold comps map…
Walkable amenities ~0.75 mi
Loading nearby amenities…
Taxation est. · year 1
- Rental income
- $21,413
- − Mortgage interest
- −$5,601
- − Property taxes
- −$1,500
- − Insurance
- −$500
- − Repairs & maintenance
- −$1,713
- − Management
- −$1,713
- − Depreciation
- −$2,909
- Taxable income
- $7,476
- Est. tax owed @ 24.0%
- −$1,794
- After-tax cash flow
- $6,829/yr
For passive investors: Depreciation is non-cash, so a rental often shows a tax loss while cash-flowing — sheltering income. Rental losses are passive: they offset passive income freely, and up to $25,000/yr can offset ordinary (W-2) income if you actively participate and your MAGI is under $100k (phasing out to $0 by $150k); unused losses carry forward. On sale, claimed depreciation is recaptured at up to 25%, and gains may owe capital-gains tax (a 1031 exchange can defer both). Figures are a year-1 estimate at your 24.0% rate — not tax advice; consult a CPA.
Schools (NCES district)
- District
- Southern Kern Unified
- NCES district ID
- 0637620
- Math proficiency
- 25% ▲ 7.00%
- Reading proficiency
- 25% ▼ -8.00%
- Median HH income
- $54,523
- Composite
- 22.5/100
- National rank
- #8093
- State rank
- #387 of 517 in CA
Livability — Rosamond
- Score
- 49/100
- State rank
- #1178
- US rank
- #25952
Category grades
Schools grade is shown separately in the Schools card above.
Census & demographics
- Census place
- Rosamond, CA
- County
- Kern County · 710,371 people
- City population
- 22,119
- Metro
- Bakersfield, CA
- Population (ZIP)
- 22,119
- Household income
- $77,431
- Rent vs Own
- Severe rent burden
- 425.0
Population outlook (Kern County) Hauer SSP2
- Today (2025)
- 947,286 people
- By 2030
- 978,984 · +3.3%
- By 2040
- 1,045,018 · +10.3%
- By 2050
- 1,105,232 · +16.7%
- By 2075
- 1,229,538 · +29.8%
- By 2100
- 1,238,059 · +30.7%
Race, ethnicity, and origin ACS 2023
- Neighborhood character
- Diverse neighborhood (Simpson 0.68)
- Race & ethnicity
- Hispanic / Latino 45% White 32% Two or more races 17% Black 13% Asian 3% Native American 1%
- Hispanic origin (detail)
- Mexican 35%
- Common ancestry
- Portuguese 2% Italian 2% Lithuanian 1%
- Foreign-born
- 13% · Canada
- Languages at home
- 68% English-only · Spanish 28% Other Indo-European 2% Other Asian/Pacific 1%
Political lean MEDSL · Kern
- 2024 margin
- Strong R (+21.1) · D 38.2% · R 59.3% · Other 2.5%
- 2008→2024 swing
- -3.3pp toward R · 2008: -17.8pp · 2024: -21.1pp
- All cycles
- 2024: R+21.1 2020: R+10.2 2016: R+15.0 2012: R+20.9 2008: R+17.8
Not yet ingested
- Civics
- —
Market trends
- HPI YoY
- ▲ 2.40%
- Current HPI
- 403.7206
- Rent YoY
- —
- Metro
- Bakersfield, CA
- State GDP YoY
- ▲ 3.21%
- F500 in state
- 116
Industry mix (Fortune 500 HQ in CA)
| Industry | F500 HQs | Revenue |
|---|---|---|
| Technology | 27 | $1,492B |
|
||
| Financial Services | 3 | $174B |
|
||
| Retail | 3 | $44B |
|
||
| Insurance | 3 | $26B |
|
||
| Media / Entertainment | 2 | $115B |
|
||
| Pharmaceuticals / Biotech | 2 | $62B |
|
||
Price history
-93.7% since first listed53 events — show timeline
- 2026-04-13 Listed $99,999 CRMLS
- 2026-02-19 Sold (MLS) $75,000 CRMLS
- 2026-01-29 Pending — CRMLS
- 2025-12-30 Listed $70,000 CRMLS
- 2024-02-22 Sold (MLS) $90,000 CRMLS
- 2024-02-12 Pending — CRMLS
- 2024-02-07 Sold (MLS) $90,000 CRMLS
- 2023-12-20 Pending — CRMLS
- 2023-11-16 Listed $93,000 CRMLS
- 2022-12-19 Listing Removed — CRMLS
- 2022-09-19 Listed $85,000 CRMLS
- 2015-08-13 Listing Removed — AVMLS
- 2015-08-03 Listed $19,900 AVMLS
- 2015-03-28 Listing Removed — AVMLS
- 2015-03-28 Listing Removed — AVMLS
- 2015-03-28 Listing Removed — AVMLS
- 2015-03-27 Listing Removed — AVMLS
- 2015-03-27 Listing Removed — AVMLS
- 2015-03-27 Listing Removed — AVMLS
- 2015-03-23 Listing Removed — AVMLS
- 2015-03-19 Listing Removed — AVMLS
- 2015-03-19 Listing Removed — AVMLS
- 2015-03-19 Listing Removed — AVMLS
- 2015-03-19 Listing Removed — AVMLS
- 2015-03-18 Listing Removed — AVMLS
- 2015-03-16 Listing Removed — AVMLS
- 2015-03-16 Listing Removed — AVMLS
- 2014-09-10 Listed $29,900 AVMLS
- 2014-05-27 Listed $25,000 AVMLS
- 2013-11-02 Listed $18,500 AVMLS
- 2013-10-30 Listing Removed — AVMLS
- 2013-09-20 Listed $13,500 AVMLS
- 2013-01-01 Listed $14,499 AVMLS
- 2012-09-18 Listed $14,999 AVMLS
- 2010-07-06 Listed $26,900 AVMLS
- 2009-08-07 Listed $20,500 AVMLS
- 2009-05-08 Listed $25,000 AVMLS
- 2008-09-22 Listing Removed — AVMLS
- 2008-04-03 Listed $34,900 AVMLS
- 2008-01-12 Listed $40,000 AVMLS
- 2007-08-26 Listed $40,000 AVMLS
- 2007-06-28 Listing Removed — AVMLS
- 2007-04-18 Listing Removed — AVMLS
- 2007-02-26 Listed $49,900 AVMLS
- 2007-02-24 Listed $25,000 AVMLS
- 2006-09-13 Listed $67,000 AVMLS
- 2005-11-02 Listed $20,000 AVMLS
- 2004-12-10 Listed $30,000 AVMLS
- 2004-08-10 Listed $30,000 AVMLS
- 2000-09-01 Sold (Public Records) $355,000 Public Records
- 1997-06-10 Sold (Public Records) $17,500 Public Records
- 1987-12-29 Sold (Public Records) $404,500 Public Records
- 1986-03-03 Sold (Public Records) $1,575,000 Public Records
Property tax history
+95.5%/yrLatest (2025): $264,713 · +9.6% YoY. Source: county tax records.
Cash-flow waterfall
monthlySold comps — $/sqft
last 12 mo · ≤1 miLoading sold comps…