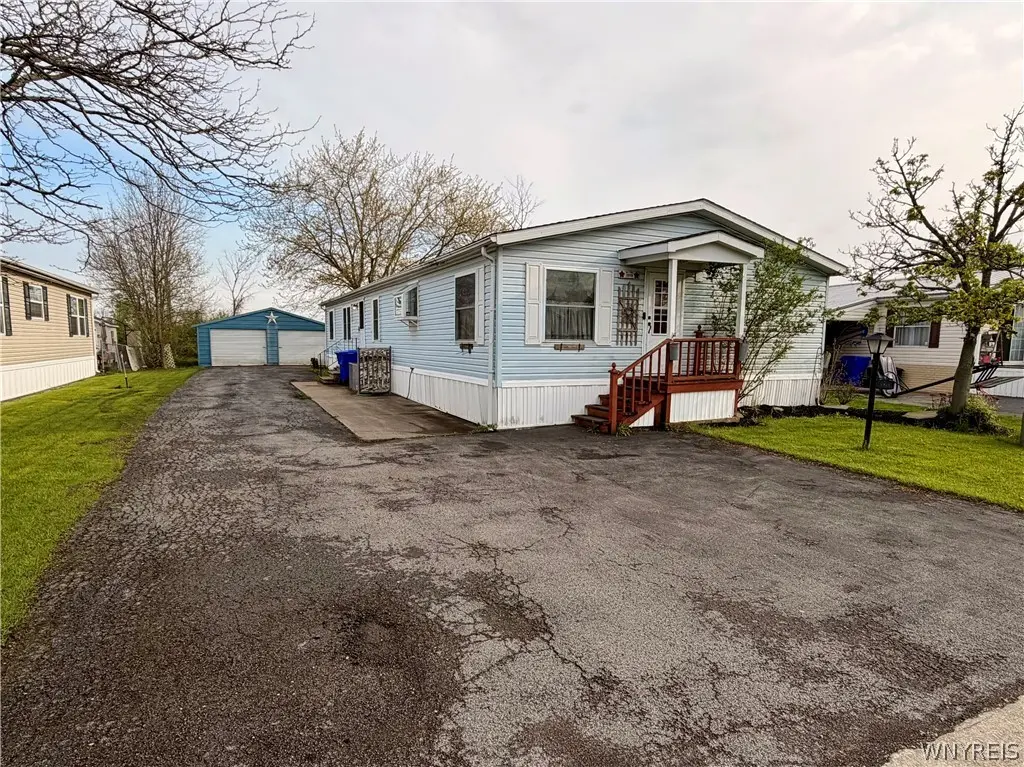
1009 Ridgewood · South Lockport, NY
Flood risk 6/10 · Moderate
- FEMA flood zone
- X (unshaded)
- Chance of flooding over 30 yrs
- 0.72%
- Est. flood insurance / yr
- $507 – $1,088
Fire risk 3/10 · Minor
- Est. fire insurance / yr
- $691 – $1,283
Heat risk 2/10 · Minimal
- Hot days now (above 94°F)
- 7 days/yr
- Hot days in 30 yrs
- 15 days/yr
Wind risk 1/10 · Minimal
- Chance of severe wind over 30 yrs
- —
Air-quality risk 2/10 · Minimal
- Unhealthy air days now
- 2 days/yr
- Unhealthy air days in 30 yrs
- 2 days/yr
Risk factors via First Street. Map © Google.
Why this score? — see what drove the A- grade
The composite is a weighted blend of 9 inputs, each scored 0–100. Each bar is that input's sub-score; the figure is the points it added to the 100-point composite (weight × sub-score).
- Cash flow +30.0/30.0
- ARV discount +15.0/15.0
- 1% rule +10.0/10.0
- DSCR +10.0/10.0
- Appreciation +5.0/10.0
- Schools +3.9/10.0
- Livability +3.3/5.0
- Rent growth +2.5/5.0
- Condition / age +2.2/5.0
$60,000
🖨 Deal sheet (PDF) 📄 Offer letter ✓ Due diligence
Listing remarks
Great opportunity to own an affordable manufactured home in Lockport! With some TLC and updates, this property has the potential to shine. Convenient location close to shopping, dining, and everyday amenities. * Seller will do no repairs, home is "as-is" "where-is" condition. Contents will be removed prior to closing *
Key facts
- 2 garage spots
- Built 1991
- Listed 24 days
Property features AI
Finance
- Financial info: Land lease payment: $855
- HOA & community: Has land lease
Exterior
- Parking: Detached garage; Driveway; 2-car garage
- Utilities: Cable available; High-speed internet available; Public water connected; Sewer connected; Circuit breaker electric
- Home design: Single-story home; Double-wide mobile home (Fleetwood); Existing/resale property; Asphalt roof; Vinyl siding; Rectangular lot
- Construction: Vinyl siding construction; Asphalt roof; Fleetwood model double-wide
- Exterior features: Blacktop driveway; Shed(s)/storage
Interior
- Kitchen: Country-style/eat-in kitchen with island and solid surface counters; Gas oven; Gas range
- Bedrooms: 3 main-level bedrooms
- Flooring: Carpet; Luxury vinyl; Vinyl; Varies
- Bathrooms: 2 full bathrooms (both on the main level)
- Heating & cooling: Gas heating, forced air; Central air conditioning
- Interior features: Ceiling fan(s); Separate/formal dining room; Eat-in kitchen; Separate/formal living room; Home office; Country kitchen; Kitchen island; Living/dining room; Solid surface counters; Primary suite with bath in primary bedroom; Bedroom on main level; Main level primary
- Laundry & utility: Main-level laundry; Gas water heater
Neighborhood map
What this means for you Summary
Snapshot
- This is a 3-bed/2.0-bath manufactured listed at $60k. Condition is rated fair.
Deal economics
- At list price, monthly cash flow is $551 ($7k/yr) — positive.
- The deal already cash-flows at list — no discount required.
- Meets the 1% rule at list price ($1k rent vs $60k).
- Recommended offer: $59k (1.5% below list) — sets the bar for market timing.
- Cap rate 17.3% vs local median 1.5% in South Lockport — top-decile yield for the area; either an underpriced asset or a hidden risk that comps aren't pricing in. Stress-test before assuming the spread holds.
Location & tenants
- Location reads 66/100 on livability (#633 in NY) — a middle-class / working-renter tenant base. Strengths: cost of living A+, health & safety A+; Watch: employment D+, schools F, crime F.
- Lockport City School District (town): math 44% / reading 49% proficiency, ranked #452 of 590 in NY (top 77%) — families likely to look elsewhere, expect single-tenant / working-renter base with shorter leases.
- Market conditions: 1 active listings in the ZIP; 167 units permitted in Niagara County in 2024 (0 in 5+ unit buildings).
Forward outlook
- In year one you build about $2k of equity ($415 loan paydown + $2k appreciation (3.0% local appreciation)).
- Niagara County population projected at -19% by 2050 — secular population decline; favor cash flow + early exit over multi-decade hold.
- At projected returns (3.0% appreciation + 3.0% rent growth), your $17k cash investment doubles in ~2 years — after that, you're playing with house money.
Negotiation context
- It's been on market 24 days — a 2% lower offer ($59k) is reasonable based on typical stale-listing flexibility.
Risks & watch-outs
- Climate carrying-cost: major flood risk — expect insurance premiums to compound above CPI over the hold.
Questions for the listing agent
- Have any recent inspections been done? Can we get a copy of the seller's disclosures and any deferred-maintenance estimates?
- Is there a deadline driving the sale (1031 exchange, divorce, estate, relocation)? That informs how much negotiation room exists.
- Schools are F-rated, which usually means shorter tenancies and higher turnover. Who's the typical renter profile here, and what's been the actual vacancy rate?
- Crime grade is F in this area — have there been break-ins, vandalism, or insurance claims at this property in the last 3 years? What carrier currently insures it and at what premium?
- What's the average days-on-market for RENTAL listings here right now (not sales)? A rising rental-DOM trend means longer vacancies and softer asking-rent achievability than the comps imply.
- What's the recent tenant-quality profile in this submarket — average credit score on applications, eviction rate, late-payment / NSF rate, and stable-employment percentage? A property-management company in the area should have these aggregated.
- How much new for-sale + rental construction is in the pipeline within 1–3 miles? Heavy new supply typically softens prices + rents 12–24 months out; constrained supply supports both.
Investment metrics
- 1% rule
- 2.04% ✓
- Cap rate
- 17.30%
- Cash-on-cash
- 39.32%
- DSCR
- 2.75
- GRM
- 4.1
CMA / ARV
- ARV (on-the-fly)
- $74,511
- Comps found
- 12
Show comp detail 12 sales within ~0.75 mi
| Address | Dist | Beds/Ba | Sqft | Sold | Price | $/sf | Match |
|---|---|---|---|---|---|---|---|
| 1009 Ridgewood | 0.00mi | 3/2.0 | 1,461 (0%) | 1mo | $50,000 | $34 | 99 |
| 901 Hollywood Dr | 0.20mi | 3/2.0 | 1,456 (-0%) | 2mo | $82,000 | $56 | 89 |
| 643 Birchwood Dr | 0.13mi | 3/2.0 | 1,366 (-6%) | 6mo | $69,000 | $51 | 78 |
| 1172 Underwood Ct | 0.12mi | 3/2.0 | 1,568 (+7%) | 5mo | $80,000 | $51 | 78 |
| 909 Hollywood Dr | 0.20mi | 3/2.0 | 1,400 (-4%) | 8mo | $80,000 | $57 | 77 |
| 1218 Maplewood Dr | 0.23mi | 3/2.0 | 1,568 (+7%) | 0mo | $70,000 | $45 | 77 |
| 1070 Fernwood Dr | 0.17mi | 3/2.0 | 1,344 (-8%) | 5mo | $72,000 | $54 | 75 |
| 519 Applewood Dr #519 | 0.38mi | 4/2.0 (+1) | 1,456 (-0%) | 5mo | $42,500 | $29 | 72 |
| 472 Chestnut Dr | 0.54mi | 3/2.0 | 1,456 (-0%) | 8mo | $75,000 | $52 | 68 |
| 525 Applewood Dr | 0.36mi | 2/2.0 (-1) | 1,400 (-4%) | 6mo | $50,000 | $36 | 66 |
| 433 Chestnut Dr | 0.56mi | 3/2.0 | 1,344 (-8%) | 5mo | $55,000 | $41 | 56 |
| 149 Crestwood Dr | 0.62mi | 3/2.0 | 1,248 (-15%) | 7mo | $25,000 | $20 | 41 |
Match score weights: distance 35% · size 25% · config 20% · recency 20%. Top-matched comps best support the ARV.
Projected returns pro-forma
3.0% appreciation · 3.0% rent growth · sell at horizon
- IRR
- 44.8%
- Equity multiple
- 3.52×
- Total profit
- $42,309
- Equity at exit
- $26,979
- IRR
- 44.6%
- Equity multiple
- 7.04×
- Total profit
- $101,512
- Equity at exit
- $41,577
Cash invested: $16,800 (down + closing). Projections, not guarantees.
Landlord ↔ Tenant lean methodology
- Overall (STATE)
- 15 Strongly Tenant-Friendly
- State New York
- 15 Strongly Tenant-Friendly · D+10
- County
- — inherits STATE
- City
- — inherits STATE
ZIP-level market 14095
- Active inventory
- 1
- Price-to-rent
- 4.1×
Monthly cashflow live
- Estimated rent
- $1,222 medium interval (Pro) →
- Mortgage (P&I)
- −$315
- Tax est. 1.5%
- −$75 /mo · $900/yr
- Insurance
- −$25
- HOA
- −$0
- Vacancy / Maint / Mgmt
- −$257
- Net cashflow
- $551
Break-even live
Sensitivity live
| Price | -10% $592 | -5% $571 | +0% $551 | +5% $530 | +10% $509 |
|---|---|---|---|---|---|
| Rent | -10% $454 | -5% $502 | +0% $551 | +5% $599 | +10% $647 |
| Rate | -1.0pp $581 | -0.5pp $566 | base $551 | +0.5pp $535 | +1.0pp $519 |
UW: 25.0% down · 7.5% · 30yr · 1.5% tax · 5.0% vac · 8.0% maint · 8.0% mgmt
Financing live
Cash to close
- Down payment
- $15,000
- Closing costs
- $1,800
- Reserves months
- —
- Total cash needed
- —
Loan-product check · same deal, 3 products live
Conventional
25% down · 7.5% · 30yr
- Down + closing
- —
- Monthly P&I
- —
- Monthly cashflow
- —
- DSCR
- —
- Eligible?
- —
Personal DTI + credit; lowest rate.
DSCR
20% down · 8.5% · 30yr
- Down + closing
- —
- Monthly P&I
- —
- Monthly cashflow
- —
- DSCR
- —
- Eligible?
- —
No personal income docs; deal must DSCR.
Hard money
10% down · 12.0% · 12mo
- Down + closing
- —
- Monthly P&I
- —
- Monthly cashflow
- —
- DSCR
- —
- Eligible?
- —
Short-term bridge; refi at stabilization.
Listing history 1 events
-
2026-05-04$60,000 Active
ⓘ Source: listings_history table (triggers on properties + properties_extension) + one-shot
backfill from property_details.listing_events for pre-trigger history.
Climate risk First Street
- Flood 6/10 Major FEMA zone X (unshaded) · 72% chance over 30 yrs
- Wildfire 3/10 Moderate
- Heat 2/10 Low 7 d/yr ≥94°F today · 15 d/yr by 30 yrs out
- Wind 1/10 Low
- Air quality 2/10 Low 2 unhealthy d/yr today · 2 by 30 yrs out
Nearby sold comps map
Loading sold comps map…
Walkable amenities ~0.75 mi
Loading nearby amenities…
Taxation est. · year 1
- Rental income
- $14,661
- − Mortgage interest
- −$3,361
- − Property taxes
- −$900
- − Insurance
- −$300
- − Repairs & maintenance
- −$1,173
- − Management
- −$1,173
- − Depreciation
- −$1,745
- Taxable income
- $6,009
- Est. tax owed @ 24.0%
- −$1,442
- After-tax cash flow
- $5,164/yr
For passive investors: Depreciation is non-cash, so a rental often shows a tax loss while cash-flowing — sheltering income. Rental losses are passive: they offset passive income freely, and up to $25,000/yr can offset ordinary (W-2) income if you actively participate and your MAGI is under $100k (phasing out to $0 by $150k); unused losses carry forward. On sale, claimed depreciation is recaptured at up to 25%, and gains may owe capital-gains tax (a 1031 exchange can defer both). Figures are a year-1 estimate at your 24.0% rate — not tax advice; consult a CPA.
Condition & rehab AI · 2 photos
This manufactured home requires significant exterior repairs and maintenance, including a new roof and siding, to improve its condition and value.
Repairs flagged
- Major roof — Signs of significant wear
- Major siding — Weathered and peeling
- Major fencing — Old and in need of repair
Value-add opportunities
- Both Landscaping — Enhances curb appeal and property value
- Both Painting — Improves exterior appearance and value
- Both Roof replacement — Essential for structural integrity and value
Renovation cost estimate screening
| Repair item | Severity | Est. cost |
|---|---|---|
| roof · Signs of significant wear | Major | $15,000–50,000 |
| siding · Weathered and peeling | Major | $15,000–50,000 |
| fencing · Old and in need of repair | Major | $15,000–50,000 |
| Total estimated repair cost · 3 items | $45,000–150,000 |
Value-add ROI direction
- Both Landscaping — Enhances curb appeal and property value ↑
- Both Painting — Improves exterior appearance and value ↑
- Both Roof replacement — Essential for structural integrity and value ↑
ⓘ Cost ranges are severity-bucket heuristics (US national rule-of-thumb). Get contractor quotes + a written scope before underwriting a rehab budget.
Schools (NCES district)
- District
- Lockport City School District
- NCES district ID
- 3617670
- Math proficiency
- 44% ▼ -7.00%
- Reading proficiency
- 49% ▲ 3.00%
- Median HH income
- $43,793
- Composite
- 39.28/100
- National rank
- #3997
- State rank
- #452 of 590 in NY
Livability — South Lockport
- Score
- 66/100
- State rank
- #633
- US rank
- #11642
Category grades
Schools grade is shown separately in the Schools card above.
Census & demographics
- Census place
- South Lockport, NY
Population outlook (Niagara County) Hauer SSP2
- Today (2025)
- 204,149 people
- By 2030
- 197,900 · -3.1%
- By 2040
- 182,239 · -10.7%
- By 2050
- 165,198 · -19.1%
- By 2075
- 129,416 · -36.6%
- By 2100
- 96,222 · -52.9%
Not yet ingested
- Political lean
- —
- Race & ethnicity
- —
- Common origin
- —
- Civics
- —
Market trends
- HPI YoY
- —
- Current HPI
- —
- Rent YoY
- —
- Metro
- —
- State GDP YoY
- ▲ 2.60%
- F500 in state
- 92
Industry mix (Fortune 500 HQ in NY)
| Industry | F500 HQs | Revenue |
|---|---|---|
| Financial Services | 10 | $950B |
|
||
| Consumer Goods | 9 | $162B |
|
||
| Insurance | 4 | $225B |
|
||
| Telecommunications | 2 | $144B |
|
||
| Pharmaceuticals | 2 | $112B |
|
||
| Media / Entertainment | 2 | $69B |
|
||
Price history
1 event — show timeline
- 2026-05-04 Listed $60,000 WNYREIS
Cash-flow waterfall
monthlySold comps — $/sqft
last 12 mo · ≤1 miLoading sold comps…