 🏢 Co-op
365 granfield Ave · Bridgeport, CT
Flood risk No data
- FEMA flood zone
- —
- Chance of flooding over 30 yrs
- —
- Est. flood insurance / yr
- —
Fire risk No data
- Est. fire insurance / yr
- —
Heat risk No data
- Hot days now (above threshold)
- —
- Hot days in 30 yrs
- —
Wind risk No data
- Chance of severe wind over 30 yrs
- —
Air-quality risk No data
- Unhealthy air days now
- —
- Unhealthy air days in 30 yrs
- —
Risk factors via First Street. Map © Google.
Why this score? — see what drove the B- grade
The composite is a weighted blend of 9 inputs, each scored 0–100. Each bar is that input's sub-score; the figure is the points it added to the 100-point composite (weight × sub-score).
- Cash flow +30.0/30.0
- 1% rule +10.0/10.0
- DSCR +10.0/10.0
- ARV discount +7.5/15.0
- Livability +4.0/5.0
- Rent growth +3.7/5.0
- Condition / age +2.2/5.0
- Schools +1.2/10.0
- Appreciation +0.0/10.0
$47,500
🖨 Deal sheet 📄 Offer letter ✓ Due diligence
Listing remarks
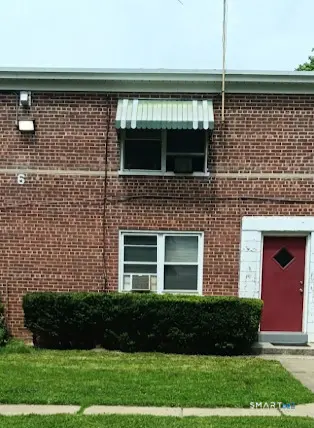
Lovely first floor unit in highly sought after Success Village complex /this paciuous unit offers an living room andcombined kitchen along with full bath. There is a utility closet for washer dryer in unit. close to shopping and Bridgeport hospital . Common charges include heat, hot water, ground maintenance and taxes. .. Sale subject to board approval. .. This is a great alternative to renting and has an off st parking space.
Key facts
- Off st parking space
- First floor unit
- Utility closet
Tags
Neighborhood map
What this means for you Summary
Snapshot
- This is a 1-bed/1.0-bath condo listed at $48k. Condition is rated fair.
Deal economics
- At list price, monthly cash flow is $366 ($4k/yr) — positive.
- The deal already cash-flows at list — no discount required.
- Meets the 1% rule at list price ($2k rent vs $48k).
- Recommended offer: $47k (1.5% below list) — sets the bar for market timing.
- Cap rate 15.5% vs local median 5.0% in Bridgeport — top-decile yield for the area; either an underpriced asset or a hidden risk that comps aren't pricing in. Stress-test before assuming the spread holds.
Location & tenants
- Location reads 81/100 on livability (#15 in CT, #1,374 nationally) — a professional / high-income tenant draw. Strengths: amenities A+, commute A+, health & safety A+; Watch: crime C-, employment D+.
- Bridgeport School District (urban): math 9% / reading 19% proficiency, ranked #151 of 153 in CT (top 99%) — low school quality limits family demand, transient renter base, plan for 1-2y turnover; 97% free/reduced lunch — lower-income household profile, screen leases tightly.
- Zoned schools: Roosevelt School (math 5% / reading 11%, grade F, #527 of 553 statewide, top 95%, 466 students, 91% FRL).
- Market conditions: Rents rising fast (+5.0%/yr); 127 active listings in the ZIP; 3 comparable units currently listed for rent nearby; rentals at typical pace (median 19d on market — plan ~3-4 weeks tenant-placement turnaround); high-income renter base; 852 units permitted in Greater Bridgeport Planning Region in 2024 (698 in 5+ unit buildings).
- This rent is only 13% of the median local income ($163k/yr) — well below the 30% rent-burden line; pricing power to push rent on renewal without tenant pushback.
Forward outlook
- Local home prices are declining (-3.0%/yr); year-one equity from $328 of loan paydown is wiped out by about $1k of value loss. Plan a longer hold.
- At projected returns (-3.0% appreciation + 5.0% rent growth), your $13k cash investment doubles in ~4 years — after that, you're playing with house money.
Negotiation context
- It's been on market 21 days — a 2% lower offer ($47k) is reasonable based on typical stale-listing flexibility.
- 4 sale attempts since 17y ago with the ask held roughly flat each time — persistent listings suggest the price (not the market) is what's stuck; bring a comps-based counter.
- Current owner paid $17k; list at $48k implies a 184% gain — meaningful room to come down on a strong offer.
Risks & watch-outs
- Watch-outs: HOA is 41% of rent; built in 1943 — expect roof / HVAC / electrical / plumbing capex.
Questions for the listing agent
- Have any recent inspections been done? Can we get a copy of the seller's disclosures and any deferred-maintenance estimates?
- Built in 1943 — when were the roof, HVAC, electrical panel, plumbing, and water heater last replaced?
- What does the HOA fee cover, when was the last increase, and are there any pending special assessments or reserve-fund shortfalls?
- Any open or pending special assessments — roof, HVAC, plumbing, elevator, façade? What's the per-unit balance and payoff schedule, and is the seller paying it off at close or rolling it to the buyer?
- Is there a deadline driving the sale (1031 exchange, divorce, estate, relocation)? That informs how much negotiation room exists.
- Schools are D-rated, which usually means shorter tenancies and higher turnover. Who's the typical renter profile here, and what's been the actual vacancy rate?
- What's the average days-on-market for RENTAL listings here right now (not sales)? A rising rental-DOM trend means longer vacancies and softer asking-rent achievability than the comps imply.
- What's the recent tenant-quality profile in this submarket — average credit score on applications, eviction rate, late-payment / NSF rate, and stable-employment percentage? A property-management company in the area should have these aggregated.
- How much new apartment / multifamily construction is in the pipeline within 1–3 miles? Heavy new supply (>2% of stock underway) typically softens rents 12–24 months out; light construction supports rent growth.
Investment metrics
- 1% rule
- 3.82% ✓
- Cap rate
- 15.53%
- Cash-on-cash
- 33.00%
- DSCR
- 2.47
- GRM
- 2.2
CMA / ARV
No comps found within radius.
Projected returns pro-forma
-3.0% appreciation · 4.97% rent growth · sell at horizon
- IRR
- 33.2%
- Equity multiple
- 2.48×
- Total profit
- $19,742
- Equity at exit
- $7,082
- IRR
- 42.4%
- Equity multiple
- 5.87×
- Total profit
- $64,801
- Equity at exit
- $4,107
Cash invested: $13,300 (down + closing). Projections, not guarantees.
Landlord ↔ Tenant lean methodology
- Overall (STATE)
- 27 Tenant-Leaning
- State Connecticut
- 27 Tenant-Leaning · D+7
- County
- — inherits STATE
- City
- — inherits STATE
ZIP-level market 06611
- Rents YoY
- 5.0%
- Active inventory
- 127
- Price-to-rent
- 2.2×
Monthly cashflow live
- Estimated rent
- $1,814 medium interval (Pro) →
- Mortgage (P&I)
- −$249
- Tax est. 1.5%
- −$59 /mo · $712/yr
- Insurance
- −$20
- HOA
- −$739
- Vacancy / Maint / Mgmt
- −$381
- Net cashflow
- $366
Break-even live
UW: 25.0% down · 7.5% · 30yr · 1.5% tax · 5.0% vac · 8.0% maint · 8.0% mgmt
Financing live
Cash to close
- Down payment
- $11,875
- Closing costs
- $1,425
- Reserves months
- —
- Total cash needed
- —
Loan-product check · same deal, 3 products live
Conventional
25% down · 7.5% · 30yr
- Down + closing
- —
- Monthly P&I
- —
- Monthly cashflow
- —
- DSCR
- —
- Eligible?
- —
Personal DTI + credit; lowest rate.
DSCR
20% down · 8.5% · 30yr
- Down + closing
- —
- Monthly P&I
- —
- Monthly cashflow
- —
- DSCR
- —
- Eligible?
- —
No personal income docs; deal must DSCR.
Hard money
10% down · 12.0% · 12mo
- Down + closing
- —
- Monthly P&I
- —
- Monthly cashflow
- —
- DSCR
- —
- Eligible?
- —
Short-term bridge; refi at stabilization.
Rent comps 3 comps
| Address | Beds | Baths | Sqft | Rent | $/sqft | DOM | Units | Dist |
|---|---|---|---|---|---|---|---|---|
| 1575 Boston Ave Unit C5 Bridgeport, CT | — | 1.0 | 316 | $1,300 | $4.11 | 43d | 1 | 0.32mi |
| 855 Main St Bridgeport, CT | 1.0 | 1.0 | 490 | $2,380 | $4.86 | 19d | 10 | 1.33mi |
| 855 Main St Bridgeport, CT | 1.0 | 1.0 | 490 | $2,380 | $4.86 | 3d | 10 | 1.33mi |
HOA detail condo
- Monthly dues
- $739 · $8,868/yr
- Likely covers
- water
- Assessments
- None detected in remarks — confirm with the listing agent.
Listing history 22 events
-
2026-06-18days on market $47,500 Active 21 DOM
-
2026-06-17days on market $47,500 Active 20 DOM
-
2026-06-16days on market $47,500 Active 19 DOM
-
2026-06-15days on market $47,500 Active 18 DOM
-
2026-06-13days on market $47,500 Active 16 DOM
-
2026-06-13days on market $47,500 Active 15 DOM
-
2026-06-10days on market $47,500 Active 13 DOM
-
2026-06-09days on market $47,500 Active 12 DOM
-
2026-06-08days on market $47,500 Active 11 DOM
-
2026-06-07days on market $47,500 Active 10 DOM
-
2026-06-05days on market $47,500 Active 7 DOM
-
2026-06-03days on market $47,500 Active 6 DOM
-
2026-06-03days on market $47,500 Active 5 DOM
-
2026-06-01days on market $47,500 Active 4 DOM
-
2026-05-31days on market $47,500 Active 3 DOM
-
2026-05-28$47,500 Active
-
2011-07-24historical
-
2011-01-24$19,900
-
2010-09-17soldstatus $16,750
-
2010-07-26$18,000
-
2010-02-10historical
-
2009-09-15$22,900
ⓘ Source: listings_history table (triggers on properties + properties_extension) + one-shot
backfill from property_details.listing_events for pre-trigger history.
Nearby sold comps map
Loading sold comps map…
Walkable amenities ~0.75 mi
Loading nearby amenities…
Taxation est. · year 1
- Rental income
- $21,767
- − Mortgage interest
- −$2,661
- − Property taxes
- −$712
- − Insurance
- −$238
- − Repairs & maintenance
- −$1,741
- − Management
- −$1,741
- − HOA
- −$8,868
- − Depreciation
- −$1,382
- Taxable income
- $4,423
- Est. tax owed @ 24.0%
- −$1,062
- After-tax cash flow
- $3,327/yr
For passive investors: Depreciation is non-cash, so a rental often shows a tax loss while cash-flowing — sheltering income. Rental losses are passive: they offset passive income freely, and up to $25,000/yr can offset ordinary (W-2) income if you actively participate and your MAGI is under $100k (phasing out to $0 by $150k); unused losses carry forward. On sale, claimed depreciation is recaptured at up to 25%, and gains may owe capital-gains tax (a 1031 exchange can defer both). Figures are a year-1 estimate at your 24.0% rate — not tax advice; consult a CPA.
Condition & rehab AI · 7 photos
This first-floor condo in the Success Village complex requires moderate renovations to improve its condition and increase its value. Key updates include painting interior walls, replacing blinds, and updating kitchen and bathroom fixtures.
Repairs flagged
- Minor kitchen cabinets — slight wear
- Minor bathroom fixtures — standard fixtures
- Minor HVAC units — standard units
Value-add opportunities
- Both paint interior walls — enhances curb appeal and interior aesthetics
- Both replace blinds — improves natural light and energy efficiency
- Both replace kitchen cabinets — modernizes the space and increases value
- Both replace bathroom fixtures — modernizes the space and increases value
- Both replace HVAC units — improves comfort and energy efficiency
Renovation cost estimate screening
| Repair item | Severity | Est. cost |
|---|---|---|
| kitchen cabinets · slight wear | Minor | $500–3,000 |
| bathroom fixtures · standard fixtures | Minor | $500–3,000 |
| HVAC units · standard units | Minor | $500–3,000 |
| Total estimated repair cost · 3 items | $1,500–9,000 |
Value-add ROI direction
- Both paint interior walls — enhances curb appeal and interior aesthetics ↑
- Both replace blinds — improves natural light and energy efficiency ↑
- Both replace kitchen cabinets — modernizes the space and increases value ↑
- Both replace bathroom fixtures — modernizes the space and increases value ↑
- Both replace HVAC units — improves comfort and energy efficiency ↑
ⓘ Cost ranges are severity-bucket heuristics (US national rule-of-thumb). Get contractor quotes + a written scope before underwriting a rehab budget.
Schools (NCES district)
- District
- Bridgeport School District
- NCES district ID
- 0900450
- Math proficiency
- 9% ▼ -7.00%
- Reading proficiency
- 19% ▼ -10.00%
- Median HH income
- $41,507
- Composite
- 12.09/100
- National rank
- #9656
- State rank
- #151 of 153 in CT
Livability — Bridgeport
- Score
- 81/100
- State rank
- #15
- US rank
- #1374
Category grades
Schools grade is shown separately in the Schools card above.
Census & demographics
- Census place
- Bridgeport, CT
- County
- Fairfield County · 765,532 people
- City population
- 149,153
- Metro
- Bridgeport-Stamford-Norwalk, CT
- Population (ZIP)
- 37,281
- Household income
- $163,073
- Rent vs Own
- Severe rent burden
- 529.0
Population outlook (Greater Bridgeport County) Hauer SSP2
- By 2040
- 365,581
Race, ethnicity, and origin ACS 2023
- Neighborhood character
- Predominantly White (75%)
- Race & ethnicity
- White 75% Asian 9% Hispanic / Latino 8% Two or more races 8% Black 2%
- Hispanic origin (detail)
- Puerto Rican 3%
- Common ancestry
- Romanian 7% Slovak 2% Russian 2%
- Foreign-born
- 18% · Canada, China, Jamaica
- Languages at home
- 77% English-only · Other Indo-European 11% Spanish 6% Chinese 1%
Political lean MEDSL · Greater Bridgeport
- 2024 margin
- Strong D (+23.3) · D 60.9% · R 37.6% · Other 1.5%
- All cycles
- 2024: D+23.3
Not yet ingested
- Civics
- —
Market trends
- HPI YoY
- ▼ -440.37%
- Current HPI
- 180.4641
- Rent YoY
- ▲ 4.97%
- Metro
- Bridgeport-Stamford-Norwalk, CT
- State GDP YoY
- ▲ 1.06%
- F500 in state
- 38
Industry mix (Fortune 500 HQ in CT)
| Industry | F500 HQs | Revenue |
|---|---|---|
| Industrial Machinery | 4 | $38B |
|
||
| Insurance | 3 | $71B |
|
||
| Financial Services | 2 | $25B |
|
||
| Transportation / Logistics | 2 | $18B |
|
||
| Healthcare | 1 | $247B |
|
||
| Telecommunications | 1 | $55B |
|
||
Price history
+107.4% since first listed7 events — show timeline
- 2026-05-28 Listed $47,500 Smart MLS
- 2011-07-24 Listing Removed — Smart MLS
- 2011-01-24 Listed $19,900 Smart MLS
- 2010-09-17 Sold (MLS) $16,750 Smart MLS
- 2010-07-26 Listed $18,000 Smart MLS
- 2010-02-10 Listing Removed — Smart MLS
- 2009-09-15 Listed $22,900 Smart MLS
Cash-flow waterfall
monthlySold comps — $/sqft
last 12 mo · ≤1 miLoading sold comps…