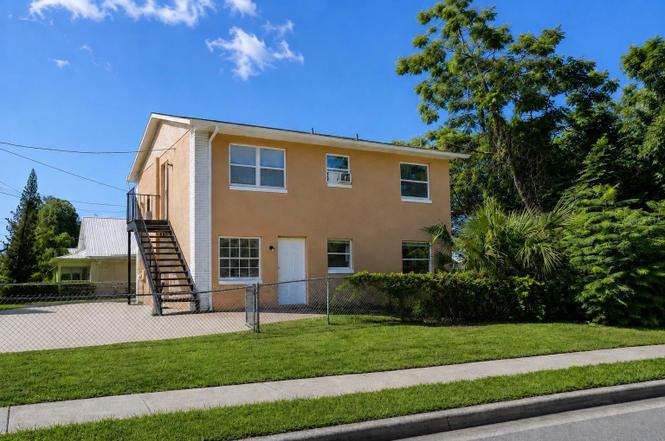
 Duplex
1352 W Kaley Ave · Holden Heights, FL
Flood risk 1/10 · Minimal
- FEMA flood zone
- X (unshaded)
- Chance of flooding over 30 yrs
- 0.0%
- Est. flood insurance / yr
- $507 – $1,088
Fire risk 1/10 · Minimal
- Est. fire insurance / yr
- $947 – $1,759
Heat risk 9/10 · Severe
- Hot days now (above 108°F)
- 7 days/yr
- Hot days in 30 yrs
- 23 days/yr
Wind risk 9/10 · Severe
- Chance of severe wind over 30 yrs
- 99.0%
Air-quality risk 1/10 · Minimal
- Unhealthy air days now
- 0 days/yr
- Unhealthy air days in 30 yrs
- 0 days/yr
Risk factors via First Street. Map © Google.
Why this score? — see what drove the D grade
The composite is a weighted blend of 9 inputs, each scored 0–100. Each bar is that input's sub-score; the figure is the points it added to the 100-point composite (weight × sub-score).
- Cash flow +14.6/30.0
- ARV discount +7.5/15.0
- DSCR +4.5/10.0
- Schools +4.1/10.0
- Livability +3.9/5.0
- 1% rule +3.7/10.0
- Rent growth +2.9/5.0
- Condition / age +2.5/5.0
- Appreciation +0.0/10.0
$319,000
🖨 Deal sheet 📄 Offer letter ✓ Due diligence
Multi-family units
County records classify this as Multi-Family (2-4 Unit). Listing-text estimate: 2 units. confirmed
Listing remarks
DUPLEX with no HOA, freshly partly renovated, one unit already renting for $1,400 on a yearly lease and seller is offering $10,000 in concessions!! UNIQUE VALUE DUPLEX IN ALL OF ORLANDO! The property features two 2-bedroom, 2-bathroom units. The upstairs unit is currently tenant-occupied and generating $1,400/month in rental income, with a one year lease. The downstairs unit is vacant, allowing an owner-occupant or investor to immediately place a new tenant and maximize income potential. Recent updates include NEW roof (2023), NEW cabinetry (2026), NEW countertops (2026), inside fresh paint (2026) and additional improvements. With individually metered utilities the property may also be suit
Key facts
- Downstairs unit
- Two units
- New cabinetry
Tags
Property features AI
Finance
- Other: Property classified as residential income duplex; Third-party listing indicated
- Financial info: Gross income reported: $33,600; Estimated annual market income: $33,600; Annual net income reported: $33,600; Two units currently (one reported occupied); Pro forma rent listed: $1,400 per unit (each unit)
- HOA & community: No association fees; No association approval required; Pets allowed (cats and dogs)
Exterior
- Utilities: Public water; Public sewer and septic tank listed; Cable available and connected; Electricity available and connected; Water and sewer available and connected
- Home design: Residential income property; Duplex; Single building containing both units; Zoned R-2; Lot about 0.16 acres
- Construction: Block construction; Shingle roof; Block foundation; Building area approximately 1606 square feet
- Exterior features: Fenced yard; Exterior lighting; Asphalt road frontage
Interior
- Kitchen: Eat-in kitchen (appliances not specified)
- Bedrooms: 4 bedrooms total; Two 2-bedroom units (each unit configured as 2 bedrooms)
- Bathrooms: Each unit has 2 bathrooms (total: units report 2 baths each)
- Heating & cooling: Central heating (electric); Central air conditioning
- Interior features: Eat-in kitchen; Living room/dining room combo; Open floorplan; Thermostat
- Laundry & utility: Laundry inside; Laundry closet; Electric dryer hookup
Neighborhood map
What this means for you Summary
Snapshot
- This is a 2 × 2-bed/2.0-bath units multifamily listed at $319k.
Deal economics
- At list price, monthly cash flow is $77 ($921/yr) — positive. Per door: $38/mo.
- The deal already cash-flows at list — no discount required.
- To meet the 1% rule (rent ≥ 1% of price), the offer needs to be $276k (13.4% below list).
- Recommended offer: $276k (13.4% below list) — sets the bar for 1% rule.
Location & tenants
- Location reads 78/100 on livability (#174 in FL, #2,638 nationally) — a middle-class / working-renter tenant base. Strengths: crime A+, commute A+, housing A+; Watch: amenities F.
- Orange (suburban): math 46% / reading 51% proficiency, ranked #43 of 73 in FL (top 59%) — families likely to look elsewhere, expect single-tenant / working-renter base with shorter leases.
- Zoned schools: Orange Center Elementary (math 27% / reading 22%, grade F, #2,037 of 2,144 statewide, top 96%, 288 students, 77% FRL); Jones High (math 9% / reading 25%, grade F, #597 of 667 statewide, top 90%, 1,672 students, 75% FRL) — zoned schools average 76% FRL vs 56% district-wide (20 pts higher); higher-poverty schools than district average — tighter screening recommended.
- Zoned-school proficiency averages 21% at this address vs 48% district-wide (-28 pts) — the specific schools serving this property underperform the Orange average; the district grade overstates school quality for this exact location.
- Market conditions: Rents rising (+1.4%/yr); 140 active listings in the ZIP; 28 comparable units currently listed for rent nearby; rentals at typical pace (median 24d on market — plan ~3-4 weeks tenant-placement turnaround); lower-income renter base — watch delinquency; 8,053 units permitted in Orange County in 2024 (3,133 in 5+ unit buildings).
- At $2,763/mo this rent would consume 82% of the median local household income ($41k/yr) (locally 1597% of renters already pay >50% of income on rent) — very limited rent-growth headroom before tenants either downsize or default.
Forward outlook
- Local home prices are declining (-3.0%/yr); year-one equity from $2k of loan paydown is wiped out by about $10k of value loss. Plan a longer hold.
- Orange County population projected at +52% by 2050 — long-run rental-demand tailwind backs the buy-and-hold thesis.
Negotiation context
- Only 1 days on market — expect competitive offers; lowballing is unlikely to land.
- 2 sale attempts since 21y ago with the ask held roughly flat each time — persistent listings suggest the price (not the market) is what's stuck; bring a comps-based counter.
- Current owner paid $99k; list at $319k implies a 222% gain — meaningful room to come down on a strong offer.
Risks & watch-outs
- Climate carrying-cost: severe wind risk, 99% chance of damaging wind over 30y; extreme-heat days projected 7→23/yr by 2055 (HVAC capex compounding) — expect insurance premiums to compound above CPI over the hold.
Questions for the listing agent
- Can we see the unit-by-unit rent roll, current vacancy, and any below-market leases? What's the average tenancy length?
- What capital expenditures (roof, boiler, parking lot, exteriors) have been made in the last 5 years, and what's planned in the next 2?
- Is there a deadline driving the sale (1031 exchange, divorce, estate, relocation)? That informs how much negotiation room exists.
- Schools are D-rated, which usually means shorter tenancies and higher turnover. Who's the typical renter profile here, and what's been the actual vacancy rate?
- The area grade is low — what's the realistic commute time and amenity access for the typical tenant pool here? Any planned neighborhood developments (good or bad) we should know about?
- What's the average days-on-market for RENTAL listings here right now (not sales)? A rising rental-DOM trend means longer vacancies and softer asking-rent achievability than the comps imply.
- What's the recent tenant-quality profile in this submarket — average credit score on applications, eviction rate, late-payment / NSF rate, and stable-employment percentage? A property-management company in the area should have these aggregated.
- How much new apartment / multifamily construction is in the pipeline within 1–3 miles? Heavy new supply (>2% of stock underway) typically softens rents 12–24 months out; light construction supports rent growth.
Investment metrics
- 1% rule
- 0.87% ✗
- Cap rate
- 6.58%
- Cash-on-cash
- 1.03%
- DSCR
- 1.05
- GRM
- 9.6
CMA / ARV
No comps found within radius.
Projected returns pro-forma
-3.0% appreciation · 1.42% rent growth · sell at horizon
- IRR
- -16.4%
- Equity multiple
- 0.43×
- Total profit
- $-51,146
- Equity at exit
- $47,564
- IRR
- -11.1%
- Equity multiple
- 0.38×
- Total profit
- $-55,509
- Equity at exit
- $27,581
Cash invested: $89,320 (down + closing). Projections, not guarantees.
Landlord ↔ Tenant lean methodology
- Overall (STATE)
- 87 Strongly Landlord-Friendly
- State Florida
- 87 Strongly Landlord-Friendly · R+3
- County
- — inherits STATE
- City
- — inherits STATE
ZIP-level market 32805
- Home prices YoY
- -7.6%
- Rents YoY
- 1.4%
- Active inventory
- 140
- Price-to-rent
- 19.2×
Monthly cashflow live
- Estimated rent
- $2,763 high interval (Pro) →
- Mortgage (P&I)
- −$1,673
- Tax from tax record
- −$300 /mo · $3,603/yr
- Insurance
- −$133
- HOA
- −$0
- Vacancy / Maint / Mgmt
- −$580
- Net cashflow
- $77
Break-even live
2-unit breakdown (identical units grouped — click to expand)
| Units | Beds | Baths | Est. rent |
|---|---|---|---|
| 2× units | 2 | 2 | $2,764 |
| #1 | 2 | 2 | $1,382 |
| #2 | 2 | 2 | $1,382 |
| Total (2 units) | $2,763 | ||
UW: 25.0% down · 7.5% · 30yr · 1.5% tax · 5.0% vac · 8.0% maint · 8.0% mgmt
Financing live
Cash to close
- Down payment
- $79,750
- Closing costs
- $9,570
- Reserves months
- —
- Total cash needed
- —
Loan-product check · same deal, 3 products live
Conventional
25% down · 7.5% · 30yr
- Down + closing
- —
- Monthly P&I
- —
- Monthly cashflow
- —
- DSCR
- —
- Eligible?
- —
Personal DTI + credit; lowest rate.
DSCR
20% down · 8.5% · 30yr
- Down + closing
- —
- Monthly P&I
- —
- Monthly cashflow
- —
- DSCR
- —
- Eligible?
- —
No personal income docs; deal must DSCR.
Hard money
10% down · 12.0% · 12mo
- Down + closing
- —
- Monthly P&I
- —
- Monthly cashflow
- —
- DSCR
- —
- Eligible?
- —
Short-term bridge; refi at stabilization.
Rent comps 28 comps
| Address | Beds | Baths | Sqft | Rent | $/sqft | DOM | Units | Dist |
|---|---|---|---|---|---|---|---|---|
| 1401 19th St Orlando, FL | 3.0 | 1.0 | 1100 | $1,800 | $1.64 | 23d | 1 | 0.14mi |
| 1907 S Rio Grande Ave Orlando, FL | 3.0 | 2.0 | 1130 | $1,600 | $1.42 | 23d | 1 | 0.16mi |
| 930 18th St Unit A Orlando, FL | 4.0 | 1.0 | 1500 | $1,500 | $1.00 | 23d | 1 | 0.42mi |
| 904 24th St Orlando, FL | 3.0 | 2.0 | 1088 | $1,800 | $1.65 | 20d | 1 | 0.51mi |
| 1816 Rendale Dr Orlando, FL | 3.0 | 2.0 | 1616 | $2,300 | $1.42 | 17d | 1 | 0.63mi |
| 3024 Rio Grande Ave Orlando, FL | 1.0–3.0 | 1.0–2.0 | 1058 | $1,480 | $1.40 | 23d | 1 | 0.65mi |
| 644 Indiana St Orlando, FL | 3.0 | 2.0 | 1308 | $2,200 | $1.68 | 23d | 1 | 0.73mi |
| 728 Columbia St Orlando, FL | 3.0 | 1.0 | 1500 | $1,500 | $1.00 | 14d | 1 | 0.74mi |
| 728 Columbia St Unit A Orlando, FL | 3.0 | 1.0 | 1500 | $1,500 | $1.00 | 23d | 1 | 0.74mi |
| 638 Columbia St Orlando, FL | 4.0 | 1.0 | 1500 | $1,500 | $1.00 | 23d | 1 | 0.81mi |
| 2805 Gulfstream Ct Orlando, FL | 3.0 | 2.0 | 1574 | $2,375 | $1.51 | 14d | 1 | 0.86mi |
| 1513 37th St Orlando, FL | 3.0 | 3.0 | 2070 | $1,800 | $0.87 | 23d | 1 | 1.00mi |
| 2751 L B McLeod Rd Unit 2751-A Orlando, FL | 3.0 | 2.0 | 1338 | $1,600 | $1.20 | 17d | 1 | 1.01mi |
| 732 S Lee Ave Orlando, FL | 3.0 | 2.5 | 1914 | $2,295 | $1.20 | 17d | 1 | 1.04mi |
| 1505 38th St Orlando, FL | 4.0 | 2.0 | 1472 | $2,600 | $1.77 | 23d | 1 | 1.06mi |
| 2419 Orange Center Blvd Orlando, FL | 3.0 | 2.0 | 1526 | $2,600 | $1.70 | 23d | 1 | 1.12mi |
| 135 W Grant St Unit 135 Orlando, FL | 3.0 | 3.5 | 1969 | $3,550 | $1.80 | 23d | 1 | 1.23mi |
| 2031 Ludlow Ln #3303 Orlando, FL | 3.0 | 2.5 | 1540 | $1,775 | $1.15 | 16d | 1 | 1.27mi |
| 100 W Grant St Orlando, FL | 3.0 | 1.0–2.0 | 1088 | $2,530 | $2.32 | 2d | 17 | 1.32mi |
| 46 W Jersey St #7 Orlando, FL | 3.0 | 3.5 | 2108 | $3,399 | $1.61 | 23d | 1 | 1.33mi |
| 54 W Jersey St #9 Orlando, FL | 3.0 | 3.5 | 2108 | $3,299 | $1.56 | 23d | 1 | 1.34mi |
| 4255 Barwood Dr Orlando, FL | 1.0–3.0 | 1.0–2.5 | 1071 | $1,725 | $1.61 | 4d | 1 | 1.34mi |
| 414 Sunset Dr Orlando, FL | 3.0 | 1.0 | 1268 | $1,850 | $1.46 | 23d | 1 | 1.36mi |
| 4012 Woodfern Dr Unit 1 Orlando, FL | 3.0 | 2.5 | 1509 | $1,900 | $1.26 | 23d | 1 | 1.39mi |
| 1829 Hollenbeck Dr #1 Orlando, FL | 3.0 | 1.0 | 1136 | $3,300 | $2.90 | 20d | 1 | 1.44mi |
| 1324 44th St Apt B Orlando, FL | 4.0 | 4.0 | 1070 | $1,150 | $1.07 | 4d | 1 | 1.46mi |
| 2314 W South St Orlando, FL | 3.0 | 2.0 | 1440 | $2,000 | $1.39 | 14d | 1 | 1.49mi |
| 2418 Skan Ct Unit C Orlando, FL | 3.0 | 2.0 | 1308 | $1,825 | $1.40 | 23d | 1 | 1.50mi |
Listing history 2 events
-
2026-06-19remarks 699-char remark
-
2026-06-19$319,000 Active 1 DOM
ⓘ Source: listings_history table (triggers on properties + properties_extension) + one-shot
backfill from property_details.listing_events for pre-trigger history.
Tax reassessment forecast FL · Resets to sale price
- Current annual tax
- $3,603 · $300/mo
- Projected year-2 tax
- $3,603 · $300/mo
- Expected delta
- $0/yr ($0/mo · -0.0%)
ⓘ Screening estimate from a state-policy table — verify with the county assessor before closing.
Climate risk First Street
- Flood 1/10 Low FEMA zone X (unshaded) · 0% chance over 30 yrs
- Wildfire 1/10 Low
- Heat 9/10 Extreme 7 d/yr ≥108°F today · 23 d/yr by 30 yrs out
- Wind 9/10 Extreme 99% chance of damaging wind over 30 yrs
- Air quality 1/10 Low 0 unhealthy d/yr today · 0 by 30 yrs out
Nearby sold comps map
Loading sold comps map…
Walkable amenities ~0.75 mi
Loading nearby amenities…
Taxation est. · year 1
- Rental income
- $33,156
- − Mortgage interest
- −$17,869
- − Property taxes
- −$3,603
- − Insurance
- −$1,595
- − Repairs & maintenance
- −$2,652
- − Management
- −$2,652
- − Depreciation
- −$9,280
- Taxable loss
- −$4,496
- Est. tax savings @ 24.0%
- +$1,079
- After-tax cash flow
- $2,000/yr
For passive investors: Depreciation is non-cash, so a rental often shows a tax loss while cash-flowing — sheltering income. Rental losses are passive: they offset passive income freely, and up to $25,000/yr can offset ordinary (W-2) income if you actively participate and your MAGI is under $100k (phasing out to $0 by $150k); unused losses carry forward. On sale, claimed depreciation is recaptured at up to 25%, and gains may owe capital-gains tax (a 1031 exchange can defer both). Figures are a year-1 estimate at your 24.0% rate — not tax advice; consult a CPA.
Schools (NCES district)
- District
- Orange
- NCES district ID
- 1201440
- Math proficiency
- 46% ▼ -9.00%
- Reading proficiency
- 51% ▼ -2.00%
- Median HH income
- $49,350
- Composite
- 41.47/100
- National rank
- #3461
- State rank
- #43 of 73 in FL
Livability — Holden Heights
- Score
- 78/100
- State rank
- #174
- US rank
- #2638
Category grades
Schools grade is shown separately in the Schools card above.
Census & demographics
- Census place
- Holden Heights, FL
- County
- Orange County · 1,471,359 people
- Metro
- Orlando-Kissimmee-Sanford, FL
- Population (ZIP)
- 19,294
- Household income
- $40,515
- Rent vs Own
- Severe rent burden
- 1597.0
Population outlook (Orange County) Hauer SSP2
- Today (2025)
- 1,618,226 people
- By 2030
- 1,787,404 · +10.5%
- By 2040
- 2,125,621 · +31.4%
- By 2050
- 2,454,016 · +51.6%
- By 2075
- 3,173,711 · +96.1%
- By 2100
- 3,607,781 · +122.9%
Race, ethnicity, and origin ACS 2023
- Neighborhood character
- Predominantly Black (70%)
- Race & ethnicity
- Black 70% Hispanic / Latino 15% White 13% Two or more races 8%
- Hispanic origin (detail)
- Mexican 3% Puerto Rican 4% Cuban 1% Dominican 3%
- Common ancestry
- Hispanic 9% Russian 1%
- Foreign-born
- 16% · Canada, Jamaica
- Languages at home
- 80% English-only · Spanish 11% French/Haitian/Cajun 8%
Political lean MEDSL · Orange
- 2024 margin
- D (+13.6) · D 56.1% · R 42.5% · Other 1.3%
- 2008→2024 swing
- -5.0pp toward R · 2008: 18.6pp · 2024: 13.6pp
- All cycles
- 2024: D+13.6 2020: D+23.1 2016: D+24.6 2012: D+18.2 2008: D+18.6
Not yet ingested
- Civics
- —
Market trends
- HPI YoY
- ▼ -35.19%
- Current HPI
- 429.3242
- Rent YoY
- ▲ 1.42%
- Metro
- Orlando-Kissimmee-Sanford, FL
- State GDP YoY
- ▲ 3.28%
- F500 in state
- 36
Industry mix (Fortune 500 HQ in FL)
| Industry | F500 HQs | Revenue |
|---|---|---|
| Industrial Technology | 2 | $29B |
|
||
| Insurance | 2 | $17B |
|
||
| Retail | 1 | $60B |
|
||
| Technology Distribution | 1 | $58B |
|
||
| Homebuilding | 1 | $35B |
|
||
| Technology Manufacturing | 1 | $35B |
|
||
Price history
+390.8% since first listed5 events — show timeline
- 2026-06-18 Listed $319,000 Stellar MLS as Distributed by MLS Grid
- 2005-06-15 Listing Removed — Stellar MLS as Distributed by MLS Grid
- 2005-02-11 Listed $160,000 Stellar MLS as Distributed by MLS Grid
- 2003-10-09 Sold (Public Records) $99,000 Public Records
- 1995-12-06 Sold (Public Records) $65,000 Public Records
Property tax history
+4.6%/yrLatest (2025): $3,603 · +20.6% YoY. Source: county tax records.
Cash-flow waterfall
monthlySold comps — $/sqft
last 12 mo · ≤1 miLoading sold comps…