 8-Plex
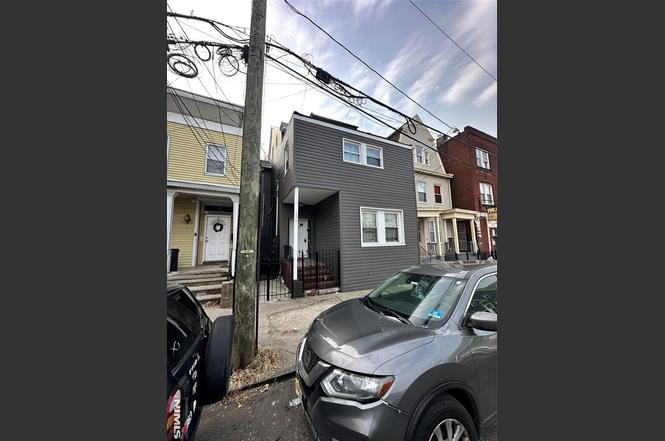
276 Ellison St · Paterson, NJ
Flood risk No data
- FEMA flood zone
- —
- Chance of flooding over 30 yrs
- —
- Est. flood insurance / yr
- —
Fire risk No data
- Est. fire insurance / yr
- —
Heat risk No data
- Hot days now (above threshold)
- —
- Hot days in 30 yrs
- —
Wind risk No data
- Chance of severe wind over 30 yrs
- —
Air-quality risk No data
- Unhealthy air days now
- —
- Unhealthy air days in 30 yrs
- —
Risk factors via First Street. Map © Google.
Why this score? — see what drove the B- grade
The composite is a weighted blend of 9 inputs, each scored 0–100. Each bar is that input's sub-score; the figure is the points it added to the 100-point composite (weight × sub-score).
- Cash flow +26.9/30.0
- DSCR +9.3/10.0
- ARV discount +7.5/15.0
- 1% rule +7.3/10.0
- Appreciation +5.5/10.0
- Rent growth +5.0/5.0
- Livability +3.5/5.0
- Condition / age +2.5/5.0
- Schools +1.3/10.0
$1,248,800
🖨 Deal sheet (PDF) 📄 Offer letter ✓ Due diligence
Multi-family units
County records classify this as Multi-Family (2-4 Unit). Listing-text estimate: 8 units. estimate disagrees with records
Listing remarks MLS
Three Story Two family home in need of TLC. Bank Owned Property. There is one rent paying tenant on third floor. Buyer is responsible for obtaining all certificates and licenses needed for closing including CCO.
Key facts
- Separate utilities
- Near hospital
- Highway access
Tags
Property features AI
Exterior
- Home design: Residential income property; Mixed-use property
- Exterior features: Asphalt roof
Neighborhood map
What this means for you Summary
Snapshot
- This is a 8 × 2-bed/?-bath units multifamily listed at $1.25M.
Deal economics
- At list price, monthly cash flow is $3k ($42k/yr) — positive. Per door: $433/mo.
- The deal already cash-flows at list — no discount required.
- Meets the 1% rule at list price ($15k rent vs $1.25M).
- Recommended offer: $1.10M (12.0% below list) — sets the bar for market timing.
- Cap rate 9.6% vs local median 3.5% in Paterson — top-decile yield for the area; either an underpriced asset or a hidden risk that comps aren't pricing in. Stress-test before assuming the spread holds.
Location & tenants
- Location reads 69/100 on livability (#293 in NJ) — a middle-class / working-renter tenant base. Strengths: amenities A+, commute A+, health & safety A; Watch: schools D, employment D, crime F.
- Paterson Public School District (suburban): math 6% / reading 26% proficiency, ranked #458 of 472 in NJ (top 97%) — low school quality limits family demand, transient renter base, plan for 1-2y turnover; 83% free/reduced lunch — lower-income household profile, screen leases tightly.
- Market conditions: Rents rising fast (+11.4%/yr); 52 active listings in the ZIP; 40 comparable units currently listed for rent nearby; rentals at typical pace (median 23d on market — plan ~3-4 weeks tenant-placement turnaround); lower-income renter base — watch delinquency; 860 units permitted in Passaic County in 2024 (614 in 5+ unit buildings).
- At $15,310/mo this rent would consume 415% of the median local household income ($44k/yr) (locally 3954% of renters already pay >50% of income on rent) — very limited rent-growth headroom before tenants either downsize or default.
Forward outlook
- In year one you build about $21k of equity ($9k loan paydown + $13k appreciation (1.0% local appreciation)).
- Passaic County population projected at +5% by 2050 — modest demand growth; plan on rents tracking national, not racing it.
- At projected returns (1.0% appreciation + 8.0% rent growth), your $350k cash investment doubles in ~5 years — after that, you're playing with house money.
- By year 4, paydown + projected appreciation supports a ~$77k cash-out refi (75% LTV) — recoverable capital for the next deal without selling this one.
Negotiation context
- It's been on market 170 days — a 12% lower offer ($1.10M) is reasonable based on typical stale-listing flexibility.
- 3 sale attempts since 10y ago with the ask held roughly flat each time — persistent listings suggest the price (not the market) is what's stuck; bring a comps-based counter.
- Current owner paid $95k; list at $1.25M implies a 1215% gain — meaningful room to come down on a strong offer.
Questions for the listing agent
- It's been on market 170 days. Have you received any prior offers? Is the seller open to a 12% concession, seller financing, or rate buy-down credit?
- Can we see the unit-by-unit rent roll, current vacancy, and any below-market leases? What's the average tenancy length?
- What capital expenditures (roof, boiler, parking lot, exteriors) have been made in the last 5 years, and what's planned in the next 2?
- Why hasn't it sold? Are there any deal-killer items the seller is aware of (foundation, flood, title, zoning, code violations)?
- Is there a deadline driving the sale (1031 exchange, divorce, estate, relocation)? That informs how much negotiation room exists.
- Schools are D-rated, which usually means shorter tenancies and higher turnover. Who's the typical renter profile here, and what's been the actual vacancy rate?
- Crime grade is F in this area — have there been break-ins, vandalism, or insurance claims at this property in the last 3 years? What carrier currently insures it and at what premium?
- What's the average days-on-market for RENTAL listings here right now (not sales)? A rising rental-DOM trend means longer vacancies and softer asking-rent achievability than the comps imply.
- What's the recent tenant-quality profile in this submarket — average credit score on applications, eviction rate, late-payment / NSF rate, and stable-employment percentage? A property-management company in the area should have these aggregated.
- How much new apartment / multifamily construction is in the pipeline within 1–3 miles? Heavy new supply (>2% of stock underway) typically softens rents 12–24 months out; light construction supports rent growth.
Investment metrics
- 1% rule
- 1.23% ✓
- Cap rate
- 9.62%
- Cash-on-cash
- 11.89%
- DSCR
- 1.53
- GRM
- 6.8
CMA / ARV
No comps found within radius.
Show comp detail 12 sales within ~0.75 mi
| Address | Dist | Beds/Ba | Sqft | Sold | Price | $/sf | Match |
|---|---|---|---|---|---|---|---|
| 51 Godwin Ave | 0.28mi | 4/3.0 | — | 2mo | $620,000 | — | 72 |
| 23 Oak St | 0.38mi | 8/3.0 | — | 2mo | $710,000 | — | 68 |
| 59-63 Broadway | 0.40mi | —/— | — | 1mo | $1,350,000 | — | 68 |
| 25 Oak St | 0.38mi | 9/4.0 | — | 2mo | $780,000 | — | 68 |
| 213 16th Ave | 0.40mi | —/— | — | 1mo | $510,000 | — | 68 |
| 50 Oak St | 0.40mi | —/— | — | 1mo | $440,000 | — | 68 |
| 379 Straight St | 0.41mi | 6/2.0 | — | 2mo | $490,000 | — | 67 |
| 474 Ellison St | 0.47mi | 5/3.0 | — | 1mo | $612,000 | — | 65 |
| 12 Ward St | 0.58mi | 5/3.0 | — | 1mo | $565,000 | — | 60 |
| 115-119 21st St | 0.64mi | 6/2.5 | — | 1mo | $640,000 | — | 57 |
| 194 Mill St | 0.68mi | 4/3.0 | — | 1mo | $475,000 | — | 55 |
| 776 22nd St | 0.66mi | 9/3.0 | — | 2mo | $800,000 | — | 55 |
Match score weights: distance 35% · size 25% · config 20% · recency 20%. Top-matched comps best support the ARV.
Projected returns pro-forma
1.01% appreciation · 8.0% rent growth · sell at horizon
- IRR
- 17.5%
- Equity multiple
- 1.93×
- Total profit
- $325,605
- Equity at exit
- $426,789
- IRR
- 23.9%
- Equity multiple
- 4.35×
- Total profit
- $1,171,922
- Equity at exit
- $567,528
Cash invested: $349,664 (down + closing). Projections, not guarantees.
Landlord ↔ Tenant lean methodology
- Overall (STATE)
- 21 Tenant-Leaning
- State New Jersey
- 21 Tenant-Leaning · D+6
- County
- — inherits STATE
- City
- — inherits STATE
ZIP-level market 07501
- Home prices YoY
- 0.3%
- Rents YoY
- 11.4%
- Active inventory
- 52
- Price-to-rent
- 54.4×
Monthly cashflow live
- Estimated rent
- $15,310 high interval (Pro) →
- Mortgage (P&I)
- −$6,549
- Tax est. 1.5%
- −$1,561 /mo · $18,732/yr
- Insurance
- −$520
- HOA
- −$0
- Vacancy / Maint / Mgmt
- −$3,215
- Net cashflow
- $3,465
Break-even live
Sensitivity live
| Price | -10% $4,328 | -5% $3,896 | +0% $3,465 | +5% $3,033 | +10% $2,602 |
|---|---|---|---|---|---|
| Rent | -10% $2,255 | -5% $2,860 | +0% $3,465 | +5% $4,069 | +10% $4,674 |
| Rate | -1.0pp $4,094 | -0.5pp $3,782 | base $3,465 | +0.5pp $3,141 | +1.0pp $2,812 |
8-unit breakdown (identical units grouped — click to expand)
| Units | Beds | Baths | Est. rent |
|---|---|---|---|
| 8× units | 2 | — | $15,312 |
| #1 | 2 | — | $1,914 |
| #2 | 2 | — | $1,914 |
| #3 | 2 | — | $1,914 |
| #4 | 2 | — | $1,914 |
| #5 | 2 | — | $1,914 |
| #6 | 2 | — | $1,914 |
| #7 | 2 | — | $1,914 |
| #8 | 2 | — | $1,914 |
| Total (8 units) | $15,310 | ||
UW: 25.0% down · 7.5% · 30yr · 1.5% tax · 5.0% vac · 8.0% maint · 8.0% mgmt
Financing live
Cash to close
- Down payment
- $312,200
- Closing costs
- $37,464
- Reserves months
- —
- Total cash needed
- —
Loan-product check · same deal, 3 products live
Conventional
25% down · 7.5% · 30yr
- Down + closing
- —
- Monthly P&I
- —
- Monthly cashflow
- —
- DSCR
- —
- Eligible?
- —
Personal DTI + credit; lowest rate.
DSCR
20% down · 8.5% · 30yr
- Down + closing
- —
- Monthly P&I
- —
- Monthly cashflow
- —
- DSCR
- —
- Eligible?
- —
No personal income docs; deal must DSCR.
Hard money
10% down · 12.0% · 12mo
- Down + closing
- —
- Monthly P&I
- —
- Monthly cashflow
- —
- DSCR
- —
- Eligible?
- —
Short-term bridge; refi at stabilization.
Rent comps 40 comps
| Address | Beds | Baths | Sqft | Rent | $/sqft | DOM | Units | Dist |
|---|---|---|---|---|---|---|---|---|
| 267 Ellison St Unit 1C Paterson, NJ | 1.0 | 1.0 | — | $1,400 | — | 24d | 1 | 0.06mi |
| 40 Park Ave Unit 5 Paterson, NJ | 1.0 | 1.0 | — | $1,550 | — | 6d | 1 | 0.12mi |
| 317 Market St Unit 1 Paterson, NJ | 2.0 | 1.0 | — | $1,950 | — | 15d | 1 | 0.14mi |
| 315 Market St Unit 4 Paterson, NJ | 2.0 | 1.0 | — | $1,725 | — | 15d | 1 | 0.14mi |
| 95 Park Ave Unit 2R Paterson, NJ | 2.0 | 1.0 | — | $1,850 | — | 15d | 1 | 0.16mi |
| 84-86 Auburn St Paterson, NJ | 1.0 | 1.0 | — | $1,750 | — | 16d | 1 | 0.16mi |
| 286 Broadway #2 Paterson, NJ | 3.0 | 1.0 | — | $1,900 | — | 26d | 1 | 0.16mi |
| 363-365 Summer St Unit 2 Paterson, NJ | 3.0 | 2.0 | — | $2,400 | — | 26d | 1 | 0.18mi |
| 367 Summer St Unit 6 Paterson, NJ | 1.0 | 1.0 | — | $1,400 | — | 15d | 1 | 0.18mi |
| 231 Market St Unit 401 Paterson, NJ | 1.0 | 1.0 | — | $1,650 | — | 26d | 1 | 0.20mi |
| 214 Hamilton Ave Unit 2 Paterson, NJ | 2.0 | 1.0 | — | $2,000 | — | 26d | 1 | 0.23mi |
| 120 Hamilton Ave Unit 2 Paterson, NJ | 3.0 | 1.0 | — | $2,300 | — | 26d | 1 | 0.24mi |
| 169 16th Ave Apt 303 Paterson, NJ | 1.0 | 1.0 | — | $1,863 | — | 1d | 1 | 0.27mi |
| 34 Auburn St Paterson, NJ | 3.0 | 1.0 | — | $2,300 | — | 26d | 1 | 0.28mi |
| 31-33 Essex St Paterson, NJ | 1.0–2.0 | 1.0–2.0 | 860 | $2,375 | $2.76 | 20d | 7 | 0.28mi |
| 48 Essex St Unit 1R Paterson, NJ | 3.0 | 1.0 | — | $1,895 | — | 20d | 1 | 0.30mi |
| 48 Essex St Unit 3R Paterson, NJ | 3.0 | 1.0 | — | $1,850 | — | 26d | 1 | 0.30mi |
| 40 12th Ave Unit 4 Paterson, NJ | 2.0 | 1.0 | 1250 | $2,100 | $1.68 | 26d | 1 | 0.31mi |
| 288 Rosa Parks Blvd Unit 52 Paterson, NJ | 2.0 | 1.0 | 800 | $1,745 | $2.18 | 22d | 1 | 0.32mi |
| 288 Rosa Parks Blvd Paterson, NJ | 2.0 | 1.0 | — | $1,695 | — | 9d | 1 | 0.32mi |
| 288 Rosa Parks Blvd Unit 30 Paterson, NJ | 2.0 | 1.0 | 850 | $1,725 | $2.03 | 26d | 1 | 0.32mi |
| 288 Rosa Parks Blvd Unit 52 Paterson, NJ | 2.0 | 1.0 | — | $1,745 | — | 26d | 1 | 0.32mi |
| 441 Summer St Unit 3 Paterson, NJ | 2.0 | 1.0 | — | $1,800 | — | 15d | 1 | 0.33mi |
| 441 Summer St Unit 1 Paterson, NJ | 3.0 | 1.0 | — | $2,200 | — | 15d | 1 | 0.33mi |
| 21 Rose St Unit second floor Paterson, NJ | 3.0 | 2.0 | — | $2,500 | — | 8d | 1 | 0.33mi |
| 37 12th Ave #3 Paterson, NJ | 2.0 | 1.0 | — | $1,750 | — | 5d | 1 | 0.33mi |
| 37 12th Ave #3 Paterson, NJ | 2.0 | 1.0 | — | $1,750 | — | 12d | 1 | 0.33mi |
| 12 Seeley St Paterson, NJ | 2.0 | 1.0 | — | $2,000 | — | 26d | 1 | 0.33mi |
| 67 12th Ave Unit 201 Paterson, NJ | 1.0 | 1.0 | 1000 | $1,718 | $1.72 | 1d | 1 | 0.34mi |
| 83 Carroll St Unit 2 Paterson, NJ | 2.0 | 1.0 | 1100 | $1,700 | $1.55 | 26d | 1 | 0.35mi |
| 22 Seeley St Unit 202 Paterson, NJ | 1.0 | 1.0 | 1000 | $2,050 | $2.05 | 1d | 1 | 0.35mi |
| 25 Oak St #3 Paterson, NJ | 3.0 | 1.0 | — | $2,500 | — | 26d | 1 | 0.37mi |
| 25 Oak St Unit BS Paterson, NJ | 2.0 | 1.5 | — | $1,800 | — | 26d | 1 | 0.37mi |
| 25 Oak St Unit 2 Paterson, NJ | 3.0 | 1.5 | — | $2,500 | — | 26d | 1 | 0.37mi |
| 242 Rosa Parks Blvd Paterson, NJ | 3.0 | 2.0 | — | $2,250 | — | 4d | 1 | 0.38mi |
| 451 Market St Unit 2nd Paterson, NJ | 3.0 | 2.0 | — | $2,600 | — | 26d | 1 | 0.39mi |
| 102 106 Beech St Paterson, NJ | 2.0 | 1.0 | 800 | $1,575 | $1.97 | 16d | 2 | 0.41mi |
| 224 Rosa Parks Blvd Unit 202 Paterson, NJ | 1.0 | 1.0 | 950 | $1,650 | $1.74 | 3d | 1 | 0.41mi |
| 189 Main St Unit 3B Paterson, NJ | 2.0 | 1.0 | 1000 | $2,200 | $2.20 | 26d | 1 | 0.41mi |
| 189 Main St Unit 3B Paterson, NJ | 2.0 | 1.0 | 1000 | $2,200 | $2.20 | 22d | 1 | 0.41mi |
Listing history 23 events
-
2026-06-21days on market $1,248,800 Active 170 DOM
-
2026-06-18days on market $1,248,800 Active 167 DOM
-
2026-06-17days on market $1,248,800 Active 166 DOM
-
2026-06-16days on market $1,248,800 Active 165 DOM
-
2026-06-15days on market $1,248,800 Active 164 DOM
-
2026-06-13days on market $1,248,800 Active 162 DOM
-
2026-06-13days on market $1,248,800 Active 161 DOM
-
2026-06-09days on market $1,248,800 Active 158 DOM
-
2026-06-08days on market $1,248,800 Active 157 DOM
-
2026-06-07days on market $1,248,800 Active 156 DOM
-
2026-06-04days on market $1,248,800 Active 153 DOM
-
2026-06-03days on market $1,248,800 Active 152 DOM
-
2026-06-02days on market $1,248,800 Active 151 DOM
-
2026-06-01days on market $1,248,800 Active 150 DOM
-
2026-05-31days on market $1,248,800 Active 149 DOM
-
2026-02-14price $1,248,800
-
2025-12-15$1,288,800 Active
-
2016-06-10soldstatus Sold 211-char remark
Show marketing remark (211 chars)
Three Story Two family home in need of TLC. Bank Owned Property. There is one rent paying tenant on third floor. Buyer is responsible for obtaining all certificates and licenses needed for closing including CCO.
-
2016-06-10soldstatus $95,000 Sold
Show marketing remark (211 chars)
Three Story Two family home in need of TLC. Bank Owned Property. There is one rent paying tenant on third floor. Buyer is responsible for obtaining all certificates and licenses needed for closing including CCO.
-
2016-05-03historical
Show marketing remark (211 chars)
Three Story Two family home in need of TLC. Bank Owned Property. There is one rent paying tenant on third floor. Buyer is responsible for obtaining all certificates and licenses needed for closing including CCO.
-
2016-05-03historical Under Contract 211-char remark
Show marketing remark (211 chars)
Three Story Two family home in need of TLC. Bank Owned Property. There is one rent paying tenant on third floor. Buyer is responsible for obtaining all certificates and licenses needed for closing including CCO.
-
2016-04-11$95,000 Active
Show marketing remark (211 chars)
Three Story Two family home in need of TLC. Bank Owned Property. There is one rent paying tenant on third floor. Buyer is responsible for obtaining all certificates and licenses needed for closing including CCO.
-
2016-04-11$95,000 Active 211-char remark
Show marketing remark (211 chars)
Three Story Two family home in need of TLC. Bank Owned Property. There is one rent paying tenant on third floor. Buyer is responsible for obtaining all certificates and licenses needed for closing including CCO.
ⓘ Source: listings_history table (triggers on properties + properties_extension) + one-shot
backfill from property_details.listing_events for pre-trigger history.
Nearby sold comps map
Loading sold comps map…
Walkable amenities ~0.75 mi
Loading nearby amenities…
Taxation est. · year 1
- Rental income
- $183,720
- − Mortgage interest
- −$69,952
- − Property taxes
- −$18,732
- − Insurance
- −$6,244
- − Repairs & maintenance
- −$14,698
- − Management
- −$14,698
- − Depreciation
- −$36,329
- Taxable income
- $23,068
- Est. tax owed @ 24.0%
- −$5,536
- After-tax cash flow
- $36,040/yr
For passive investors: Depreciation is non-cash, so a rental often shows a tax loss while cash-flowing — sheltering income. Rental losses are passive: they offset passive income freely, and up to $25,000/yr can offset ordinary (W-2) income if you actively participate and your MAGI is under $100k (phasing out to $0 by $150k); unused losses carry forward. On sale, claimed depreciation is recaptured at up to 25%, and gains may owe capital-gains tax (a 1031 exchange can defer both). Figures are a year-1 estimate at your 24.0% rate — not tax advice; consult a CPA.
Schools (NCES district)
- District
- Paterson Public School District
- NCES district ID
- 3412690
- Math proficiency
- 6% ▼ -12.00%
- Reading proficiency
- 26% ▼ -4.00%
- Median HH income
- $34,365
- Composite
- 13.02/100
- National rank
- #9568
- State rank
- #458 of 472 in NJ
Livability — Paterson
- Score
- 69/100
- State rank
- #293
- US rank
- #8763
Category grades
Schools grade is shown separately in the Schools card above.
Census & demographics
- Census place
- Paterson, NJ
- County
- Passaic County · 360,294 people
- City population
- 85,452
- Metro
- New York-Newark-Jersey City, NY-NJ-PA
- Population (ZIP)
- 35,481
- Household income
- $44,300
- Rent vs Own
- Severe rent burden
- 3954.0
Population outlook (Passaic County) Hauer SSP2
- Today (2025)
- 525,915 people
- By 2030
- 532,160 · +1.2%
- By 2040
- 543,670 · +3.4%
- By 2050
- 554,326 · +5.4%
- By 2075
- 584,728 · +11.2%
- By 2100
- 598,978 · +13.9%
Race, ethnicity, and origin ACS 2023
- Neighborhood character
- Predominantly Hispanic (68%)
- Race & ethnicity
- Hispanic / Latino 68% Black 24% Two or more races 8% White 5% Asian 3%
- Hispanic origin (detail)
- Mexican 7% Puerto Rican 10% Dominican 34%
- Foreign-born
- 42% · Canada, Jamaica
- Languages at home
- 34% English-only · Spanish 63% Other Indo-European 3%
Political lean MEDSL · Passaic
- 2024 margin
- Toss-up / Even · D 46.9% · R 49.8% · Other 3.3%
- 2008→2024 swing
- -24.6pp toward R · 2008: 21.7pp · 2024: -2.9pp
- All cycles
- 2024: R+2.9 2020: D+16.5 2016: D+21.8 2012: D+27.3 2008: D+21.7
Not yet ingested
- Civics
- —
Market trends
- HPI YoY
- ▲ 1.01%
- Current HPI
- 292.4223
- Rent YoY
- ▲ 11.37%
- Metro
- New York-Newark-Jersey City, NY-NJ-PA
- State GDP YoY
- ▲ 2.05%
- F500 in state
- 34
Industry mix (Fortune 500 HQ in NJ)
| Industry | F500 HQs | Revenue |
|---|---|---|
| Consumer Goods | 3 | $31B |
|
||
| Pharmaceuticals | 2 | $153B |
|
||
| Technology | 2 | $21B |
|
||
| Insurance | 2 | $20B |
|
||
| Healthcare | 2 | $19B |
|
||
| Financial Services | 1 | $70B |
|
||
Price history
+1214.5% since first listed8 events — show timeline
- 2026-02-14 Price Changed $1,248,800 NJMLS
- 2025-12-15 Listed $1,288,800 NJMLS
- 2016-06-10 Sold (MLS) — NJMLS
- 2016-06-10 Sold (MLS) $95,000 GSMLS
- 2016-05-03 Delisted — GSMLS
- 2016-05-03 Contingent — NJMLS
- 2016-04-11 Listed $95,000 GSMLS
- 2016-04-11 Listed $95,000 NJMLS
Cash-flow waterfall
monthlySold comps — $/sqft
last 12 mo · ≤1 miLoading sold comps…