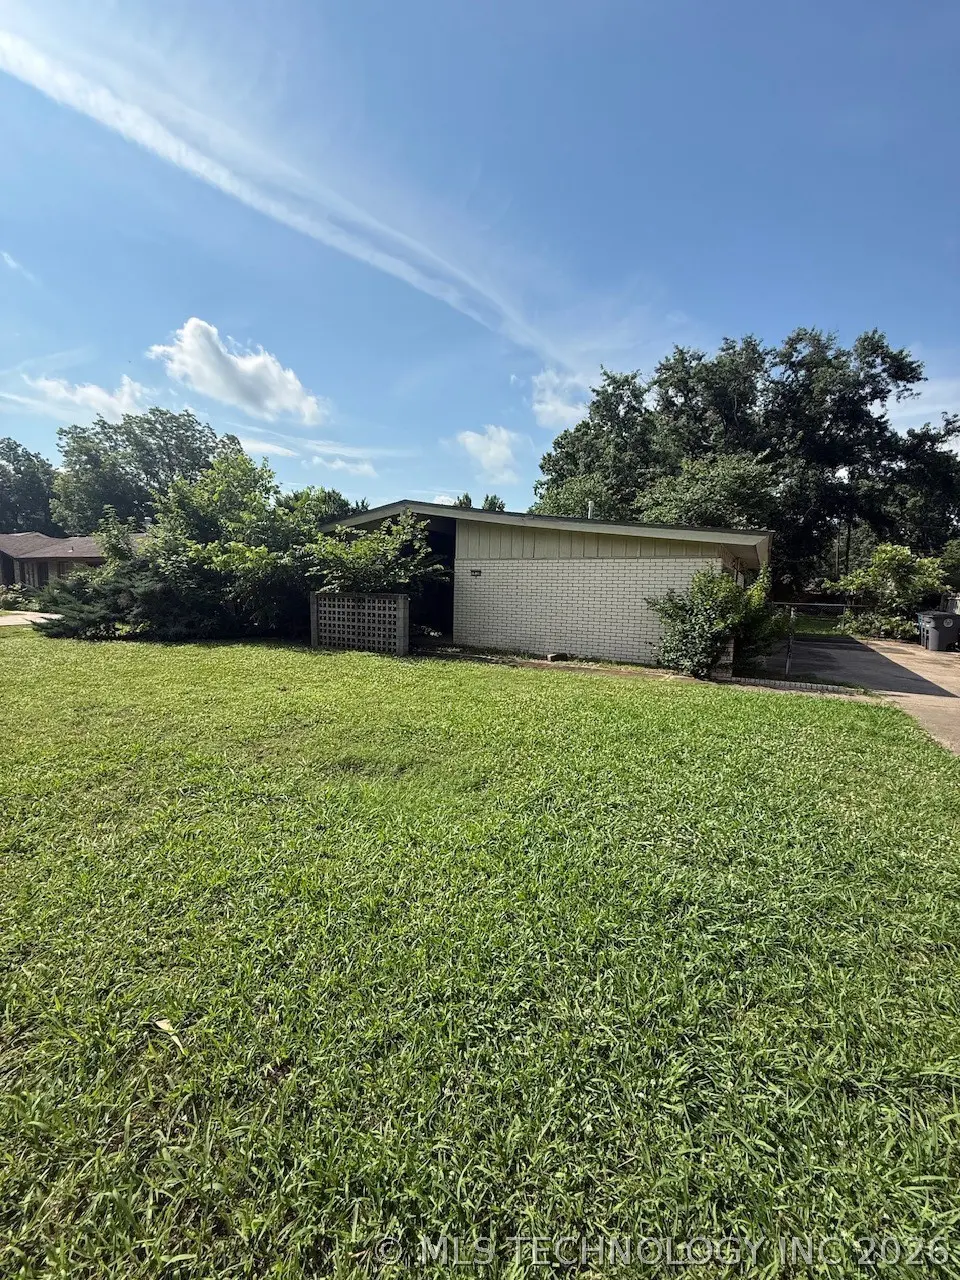
1928 E 55th Pl · Tulsa, OK
Flood risk 1/10 · Minimal
- FEMA flood zone
- X (shaded)
- Chance of flooding over 30 yrs
- 0.0%
- Est. flood insurance / yr
- $473 – $860
Fire risk 1/10 · Minimal
- Est. fire insurance / yr
- $2,463 – $4,575
Heat risk 7/10 · Major
- Hot days now (above 110°F)
- 7 days/yr
- Hot days in 30 yrs
- 18 days/yr
Wind risk 3/10 · Minor
- Chance of severe wind over 30 yrs
- 5.0%
Air-quality risk 3/10 · Minor
- Unhealthy air days now
- 2 days/yr
- Unhealthy air days in 30 yrs
- 3 days/yr
Risk factors via First Street. Map © Google.
Why this score? — see what drove the D+ grade
The composite is a weighted blend of 9 inputs, each scored 0–100. Each bar is that input's sub-score; the figure is the points it added to the 100-point composite (weight × sub-score).
- Cash flow +15.9/30.0
- ARV discount +15.0/15.0
- DSCR +4.9/10.0
- Livability +3.8/5.0
- 1% rule +3.5/10.0
- Rent growth +3.2/5.0
- Condition / age +2.5/5.0
- Schools +0.8/10.0
- Appreciation +0.0/10.0
$157,500
🖨 Deal sheet (PDF) 📄 Offer letter ✓ Due diligence
Listing remarks
Built in 1960, this very unique home is full of character and timeless charm! Featuring 3 bedrooms 2.5 bathrooms, and 1,484sq. ft. (per courthouse records), this home still carries a fun 1960s feel while offering some taste full updates throughout. From its distinctive style to its inviting layout, this property is truly one of a kind and ready for its next owner to make it their own. PLUS, Heller Park is just at the end of the street, giving you easy access to green space and outdoor fun!
Key facts
- Unique home
- Inviting layout
- Heller park access
Tags
Property features AI
Exterior
- Parking: Attached 2-car garage
- Security: Smoke detectors installed; No safety shelter
- Utilities: Public water; Public sewer; Electricity available; Natural gas available; Cable available; High-speed internet available; Ventilation for improved indoor air quality
- Home design: Single-story home; Faces north; Slab foundation
- Construction: Brick and wood frame construction; Asphalt fiberglass roof
- Exterior features: Concrete driveway; Patio; Mature trees; Full privacy fencing
Interior
- Kitchen: Built-in oven; Oven and range; Dishwasher; Refrigerator; Garbage disposal
- Bedrooms: Master bedroom with walk-in closet (First floor); Additional bedrooms with walk-in closets and pullman baths (First floor)
- Flooring: Carpet; Tile; Vinyl
- Bathrooms: Two full bathrooms; Master bath with tub; Hall half-bath configuration listed
- Heating & cooling: Central heating (electric); Central air conditioning
- Interior features: High ceilings; Laminate counters; Pullman bath; Cable TV ready; Ceiling fans; Electric oven connection; Vinyl windows
- Laundry & utility: Inside utility room (First floor); Electric dryer hookup; Electric and gas water heater listed
Neighborhood map
What this means for you Summary
Snapshot
- This is a 3-bed/1.5-bath single-family listed at $158k.
Deal economics
- At list price, monthly cash flow is $74 ($883/yr) — positive.
- The deal already cash-flows at list — no discount required.
- To meet the 1% rule (rent ≥ 1% of price), the offer needs to be $133k (15.2% below list).
- Recommended offer: $133k (15.2% below list) — sets the bar for 1% rule.
- Cap rate 6.9% vs local median 3.8% in Tulsa — top-decile yield for the area; either an underpriced asset or a hidden risk that comps aren't pricing in. Stress-test before assuming the spread holds.
Location & tenants
- Location reads 75/100 on livability (#13 in OK, #4,058 nationally) — a middle-class / working-renter tenant base. Strengths: amenities A+, commute A+, cost of living A+; Watch: crime F, employment D-.
- Tulsa (urban): math 7% / reading 12% proficiency, ranked #250 of 270 in OK (top 93%) — low school quality limits family demand, transient renter base, plan for 1-2y turnover; 76% free/reduced lunch — lower-income household profile, screen leases tightly.
- Zoned schools: Project Accept Traice Es (math 10% / reading 10%, grade F, #695 of 845 statewide, top 84%, 558 students, 0% FRL); Monroe Demonstration Ms (math 0% / reading 2%, grade F, #344 of 345 statewide, top 100%, 688 students, 0% FRL); Booker T. Washington Hs (math 41% / reading 61%, grade D+, #2 of 447 statewide, top 0%, 1,280 students, 0% FRL) — zoned schools average 0% FRL vs 76% district-wide (76 pts lower); this property's tenant base skews higher-income than the district average.
- Market conditions: Rents rising (+2.8%/yr); 226 active listings in the ZIP; 26 comparable units currently listed for rent nearby; rentals leasing fast (median 13d on market — plan ~1-2 weeks tenant-placement turnaround); 2,818 units permitted in Tulsa County in 2024 (518 in 5+ unit buildings).
Forward outlook
- Local home prices are declining (-3.0%/yr); year-one equity from $1k of loan paydown is wiped out by about $5k of value loss. Plan a longer hold.
- Tulsa County population projected at +30% by 2050 — long-run rental-demand tailwind backs the buy-and-hold thesis.
Negotiation context
- Only 3 days on market — expect competitive offers; lowballing is unlikely to land.
Risks & watch-outs
- Climate carrying-cost: extreme-heat days projected 7→18/yr by 2055 (HVAC capex compounding) — expect insurance premiums to compound above CPI over the hold.
Questions for the listing agent
- Built in 1960 — when were the roof, HVAC, electrical panel, plumbing, and water heater last replaced?
- Is there a deadline driving the sale (1031 exchange, divorce, estate, relocation)? That informs how much negotiation room exists.
- Schools are F-rated, which usually means shorter tenancies and higher turnover. Who's the typical renter profile here, and what's been the actual vacancy rate?
- Crime grade is F in this area — have there been break-ins, vandalism, or insurance claims at this property in the last 3 years? What carrier currently insures it and at what premium?
- The area grade is low — what's the realistic commute time and amenity access for the typical tenant pool here? Any planned neighborhood developments (good or bad) we should know about?
- What's the average days-on-market for RENTAL listings here right now (not sales)? A rising rental-DOM trend means longer vacancies and softer asking-rent achievability than the comps imply.
- What's the recent tenant-quality profile in this submarket — average credit score on applications, eviction rate, late-payment / NSF rate, and stable-employment percentage? A property-management company in the area should have these aggregated.
- How much new for-sale + rental construction is in the pipeline within 1–3 miles? Heavy new supply typically softens prices + rents 12–24 months out; constrained supply supports both.
Investment metrics
- 1% rule
- 0.85% ✗
- Cap rate
- 6.85%
- Cash-on-cash
- 2.00%
- DSCR
- 1.09
- GRM
- 9.8
CMA / ARV
- ARV (on-the-fly)
- $227,052
- Comps found
- 12
Show comp detail 12 sales within ~0.75 mi
| Address | Dist | Beds/Ba | Sqft | Sold | Price | $/sf | Match |
|---|---|---|---|---|---|---|---|
| 5633 S Yorktown Pl | 0.19mi | 3/2.0 | 1,464 (-1%) | 3mo | $235,000 | $161 | 84 |
| 1737 E 56th St | 0.10mi | 3/2.5 | 1,614 (+9%) | 2mo | $220,000 | $136 | 75 |
| 5312 S Yorktown Ave | 0.22mi | 3/2.0 | 1,574 (+6%) | 5mo | $157,500 | $100 | 74 |
| 5405 S Xanthus Ave | 0.16mi | 3/2.0 | 1,622 (+9%) | 3mo | $305,000 | $188 | 72 |
| 1868 E 57th Pl | 0.18mi | 2/2.0 (-1) | 1,371 (-8%) | 2mo | $217,000 | $158 | 70 |
| 1521 E 60th St | 0.54mi | 3/2.0 | 1,440 (-3%) | 0mo | $220,000 | $153 | 68 |
| 1758 E 61st St | 0.55mi | 3/2.0 | 1,546 (+4%) | 3mo | $215,000 | $139 | 63 |
| 2107 E 52nd Pl | 0.30mi | 3/2.0 | 1,682 (+13%) | 2mo | $279,900 | $166 | 60 |
| 1541 E 61st St | 0.60mi | 3/2.0 | 1,352 (-9%) | 2mo | $185,000 | $137 | 54 |
| 5534 S Columbia Ave | 0.65mi | 3/2.0 | 1,599 (+8%) | 2mo | $230,200 | $144 | 53 |
| 1416 E 50th St | 0.74mi | 4/2.0 (+1) | 1,538 (+4%) | 0mo | $265,000 | $172 | 52 |
| 1532 E 59th Pl | 0.51mi | 3/2.0 | 1,300 (-12%) | 4mo | $182,000 | $140 | 51 |
Match score weights: distance 35% · size 25% · config 20% · recency 20%. Top-matched comps best support the ARV.
Projected returns pro-forma
-3.0% appreciation · 2.83% rent growth · sell at horizon
- IRR
- -13.3%
- Equity multiple
- 0.52×
- Total profit
- $-21,110
- Equity at exit
- $23,484
- IRR
- -4.7%
- Equity multiple
- 0.69×
- Total profit
- $-13,467
- Equity at exit
- $13,618
Cash invested: $44,100 (down + closing). Projections, not guarantees.
Landlord ↔ Tenant lean methodology
- Overall (STATE)
- 83 Strongly Landlord-Friendly
- State Oklahoma
- 83 Strongly Landlord-Friendly · R+20
- County
- — inherits STATE
- City
- — inherits STATE
ZIP-level market 74105
- Rents YoY
- 2.8%
- Active inventory
- 226
- Price-to-rent
- 9.8×
Monthly cashflow live
- Estimated rent
- $1,335 high interval (Pro) →
- Mortgage (P&I)
- −$826
- Tax from tax record
- −$90 /mo · $1,074/yr
- Insurance
- −$66
- HOA
- −$0
- Vacancy / Maint / Mgmt
- −$280
- Net cashflow
- $74
Break-even live
Sensitivity live
| Price | -10% $163 | -5% $118 | +0% $74 | +5% $29 | +10% $-16 |
|---|---|---|---|---|---|
| Rent | -10% $-32 | -5% $21 | +0% $74 | +5% $126 | +10% $179 |
| Rate | -1.0pp $153 | -0.5pp $114 | base $74 | +0.5pp $33 | +1.0pp $-9 |
UW: 25.0% down · 7.5% · 30yr · 1.5% tax · 5.0% vac · 8.0% maint · 8.0% mgmt
Financing live
Cash to close
- Down payment
- $39,375
- Closing costs
- $4,725
- Reserves months
- —
- Total cash needed
- —
Loan-product check · same deal, 3 products live
Conventional
25% down · 7.5% · 30yr
- Down + closing
- —
- Monthly P&I
- —
- Monthly cashflow
- —
- DSCR
- —
- Eligible?
- —
Personal DTI + credit; lowest rate.
DSCR
20% down · 8.5% · 30yr
- Down + closing
- —
- Monthly P&I
- —
- Monthly cashflow
- —
- DSCR
- —
- Eligible?
- —
No personal income docs; deal must DSCR.
Hard money
10% down · 12.0% · 12mo
- Down + closing
- —
- Monthly P&I
- —
- Monthly cashflow
- —
- DSCR
- —
- Eligible?
- —
Short-term bridge; refi at stabilization.
Rent comps 26 comps
| Address | Beds | Baths | Sqft | Rent | $/sqft | DOM | Units | Dist |
|---|---|---|---|---|---|---|---|---|
| 5151 S Utica Ave Tulsa, OK | 1.0–2.0 | 1.0 | 799 | $838 | $1.05 | 3d | 1 | 0.38mi |
| 5270 S Lewis Ave Tulsa, OK | 2.0 | 2.0 | 1050 | $950 | $0.90 | 25d | 8 | 0.42mi |
| 2102 E 51st St Tulsa, OK | 1.0–2.0 | 1.0–2.0 | 700 | $725 | $1.04 | 3d | 15 | 0.46mi |
| 5607 S Quaker Ave Unit 5607D-Q Tulsa, OK | 2.0 | 2.0 | 950 | $1,100 | $1.16 | 5d | 1 | 0.56mi |
| 5009 S Troost Ave Tulsa, OK | 2.0 | 1.0 | 886 | $1,400 | $1.58 | 25d | 1 | 0.58mi |
| 6105 S Troost Ave Tulsa, OK | 2.0 | 2.0 | 1124 | $1,300 | $1.16 | 25d | 1 | 0.58mi |
| 4849 S Victor Ave Tulsa, OK | 1.0–2.0 | 1.0–2.0 | 775 | $1,100 | $1.42 | 18d | 6 | 0.62mi |
| 6135 S Troost Ave Unit 6135 Tulsa, OK | 2.0 | 2.0 | 1150 | $1,125 | $0.98 | 25d | 1 | 0.66mi |
| 5628 S Peoria Ave Unit 5628A-P Tulsa, OK | 2.0 | 2.0 | 950 | $1,100 | $1.16 | 5d | 1 | 0.67mi |
| 1337 E 61st St Tulsa, OK | 1.0–2.0 | 1.0 | 700 | $1,051 | $1.50 | 5d | 14 | 0.71mi |
| 1514 E 49th St Tulsa, OK | 3.0 | 1.0 | 980 | $1,295 | $1.32 | 18d | 1 | 0.76mi |
| 4676 S Saint Louis Ave Tulsa, OK | 3.0 | 1.0 | 1012 | $1,475 | $1.46 | 25d | 1 | 0.85mi |
| 1110 E 60th St Tulsa, OK | 1.0–2.0 | 1.0–2.0 | 794 | $1,069 | $1.35 | 5d | 4 | 0.86mi |
| 5101 S Madison Ave Tulsa, OK | 1.0–2.0 | 1.0 | 780 | $1,150 | $1.47 | 3d | 2 | 0.90mi |
| 5121 S Madison Ave Tulsa, OK | 3.0 | 1.5 | 1048 | $1,550 | $1.48 | 13d | 1 | 0.96mi |
| 6119 S Madison Pl Tulsa, OK | 3.0 | 2.0 | 1214 | $1,550 | $1.28 | 12d | 1 | 1.03mi |
| 6307 S Owasso Ave Unit 6309 Tulsa, OK | 4.0 | 2.0 | 1131 | $1,560 | $1.38 | 3d | 1 | 1.06mi |
| 1115 E 48th Pl Tulsa, OK | 3.0 | 1.5 | 1195 | $1,500 | $1.26 | 25d | 1 | 1.08mi |
| 1348 E 45th Pl Tulsa, OK | 3.0 | 1.5 | 1281 | $1,675 | $1.31 | 25d | 1 | 1.13mi |
| 6630 S Zunis Ave Tulsa, OK | 1.0–3.0 | 1.0–2.0 | 1000 | $1,299 | $1.30 | 3d | 12 | 1.13mi |
| 6345 S Madison Pl Unit 1 Tulsa, OK | 3.0 | 2.0 | 1080 | $1,100 | $1.02 | 5d | 1 | 1.21mi |
| 6732 S Lewis Ave #313 Tulsa, OK | 2.0 | 2.0 | 1350 | $1,400 | $1.04 | 5d | 1 | 1.30mi |
| 6805 S Lewis Ave Tulsa, OK | 2.0 | 1.5–2.0 | 1200 | $1,174 | $0.98 | 4d | 4 | 1.32mi |
| 6732 S Peoria Ave Tulsa, OK | 1.0–2.0 | 1.0–2.0 | 810 | $926 | $1.14 | 4d | 4 | 1.42mi |
| 4752 S Harvard Ave Tulsa, OK | 1.0–3.0 | 1.0–2.0 | 1125 | $1,375 | $1.22 | 25d | 14 | 1.47mi |
| 6760 S Trenton Pl Tulsa, OK | 2.0 | 2.0 | 900 | $900 | $1.00 | 12d | 1 | 1.48mi |
Listing history 3 events
-
2026-06-08statusdays on market $157,500 Pending 3 DOM
-
2026-06-07remarks 494-char remark
-
2026-06-07$157,500 Active 2 DOM
ⓘ Source: listings_history table (triggers on properties + properties_extension) + one-shot
backfill from property_details.listing_events for pre-trigger history.
Tax reassessment forecast OK · Resets to sale price
- Current annual tax
- $1,074 · $90/mo
- Projected year-2 tax
- $1,418 · $118/mo
- Expected delta
- +$344/yr (+$29/mo · 32.0%)
ⓘ Screening estimate from a state-policy table — verify with the county assessor before closing.
Climate risk First Street
- Flood 1/10 Low FEMA zone X (shaded) · 0% chance over 30 yrs
- Wildfire 1/10 Low
- Heat 7/10 Severe 7 d/yr ≥110°F today · 18 d/yr by 30 yrs out
- Wind 3/10 Moderate 5% chance of damaging wind over 30 yrs
- Air quality 3/10 Moderate 2 unhealthy d/yr today · 3 by 30 yrs out
Nearby sold comps map
Loading sold comps map…
Walkable amenities ~0.75 mi
Loading nearby amenities…
Taxation est. · year 1
- Rental income
- $16,020
- − Mortgage interest
- −$8,822
- − Property taxes
- −$1,074
- − Insurance
- −$788
- − Repairs & maintenance
- −$1,282
- − Management
- −$1,282
- − Depreciation
- −$4,582
- Taxable loss
- −$1,809
- Est. tax savings @ 24.0%
- +$434
- After-tax cash flow
- $1,317/yr
For passive investors: Depreciation is non-cash, so a rental often shows a tax loss while cash-flowing — sheltering income. Rental losses are passive: they offset passive income freely, and up to $25,000/yr can offset ordinary (W-2) income if you actively participate and your MAGI is under $100k (phasing out to $0 by $150k); unused losses carry forward. On sale, claimed depreciation is recaptured at up to 25%, and gains may owe capital-gains tax (a 1031 exchange can defer both). Figures are a year-1 estimate at your 24.0% rate — not tax advice; consult a CPA.
Schools (NCES district)
- District
- Tulsa
- NCES district ID
- 4030240
- Math proficiency
- 7% ▼ -9.00%
- Reading proficiency
- 12% ▼ -7.00%
- Median HH income
- $37,895
- Composite
- 8.04/100
- National rank
- #9919
- State rank
- #250 of 270 in OK
Livability — Tulsa
- Score
- 75/100
- State rank
- #13
- US rank
- #4058
Category grades
Schools grade is shown separately in the Schools card above.
Census & demographics
- Census place
- Tulsa, OK
- County
- Tulsa County · 640,811 people
- City population
- 389,418
- Metro
- Tulsa, OK
- Population (ZIP)
- 26,951
- Household income
- $69,547
- Rent vs Own
- Severe rent burden
- 1214.0
Population outlook (Tulsa County) Hauer SSP2
- Today (2025)
- 723,846 people
- By 2030
- 766,033 · +5.8%
- By 2040
- 851,386 · +17.6%
- By 2050
- 938,389 · +29.6%
- By 2075
- 1,166,011 · +61.1%
- By 2100
- 1,350,277 · +86.5%
Race, ethnicity, and origin ACS 2023
- Neighborhood character
- Predominantly White (70%)
- Race & ethnicity
- White 70% Two or more races 12% Black 9% Hispanic / Latino 7% Native American 4% Asian 1%
- Hispanic origin (detail)
- Mexican 4%
- Common ancestry
- Slovak 3% Italian 3% Lithuanian 2%
- Foreign-born
- 4% · Canada, China
- Languages at home
- 94% English-only · Spanish 4%
Political lean MEDSL · Tulsa
- 2024 margin
- R (+15.2) · D 41.3% · R 56.5% · Other 2.2%
- 2008→2024 swing
- +9.2pp toward D · 2008: -24.5pp · 2024: -15.2pp
- All cycles
- 2024: R+15.2 2020: R+15.6 2016: R+22.9 2012: R+27.4 2008: R+24.5
Not yet ingested
- Civics
- —
Market trends
- HPI YoY
- ▼ -305.73%
- Current HPI
- 236.6827
- Rent YoY
- ▲ 2.83%
- Metro
- Tulsa, OK
- State GDP YoY
- ▲ 1.55%
- F500 in state
- 6
Industry mix (Fortune 500 HQ in OK)
| Industry | F500 HQs | Revenue |
|---|---|---|
| Energy | 3 | $48B |
|
||
Price history
1 event — show timeline
- 2026-06-05 Listed $157,500 MLS Technology, Inc.
Property tax history
-1.2%/yrLatest (2025): $1,074 · +3.5% YoY. Source: county tax records.
Cash-flow waterfall
monthlySold comps — $/sqft
last 12 mo · ≤1 miLoading sold comps…