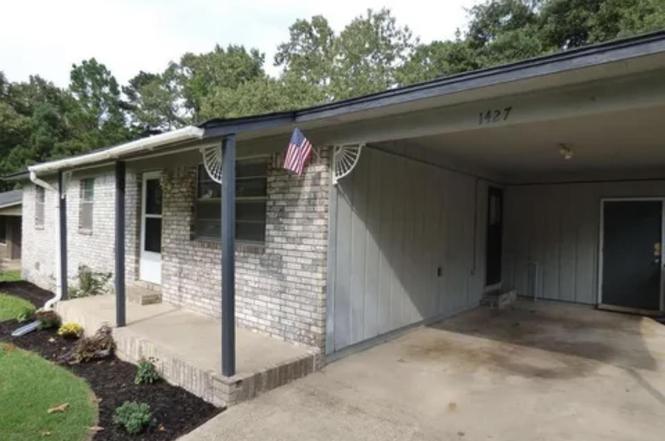
1427 Maple St · Malvern, AR
Flood risk 1/10 · Minimal
- FEMA flood zone
- X (unshaded)
- Chance of flooding over 30 yrs
- 0.0%
- Est. flood insurance / yr
- $507 – $1,088
Fire risk 5/10 · Moderate
- Est. fire insurance / yr
- $1,499 – $2,785
Heat risk 6/10 · Moderate
- Hot days now (above 110°F)
- 7 days/yr
- Hot days in 30 yrs
- 20 days/yr
Wind risk 4/10 · Minor
- Chance of severe wind over 30 yrs
- 15.0%
Air-quality risk 2/10 · Minimal
- Unhealthy air days now
- 0 days/yr
- Unhealthy air days in 30 yrs
- 1 days/yr
Risk factors via First Street. Map © Google.
Why this score? — see what drove the C grade
The composite is a weighted blend of 9 inputs, each scored 0–100. Each bar is that input's sub-score; the figure is the points it added to the 100-point composite (weight × sub-score).
- Cash flow +22.7/30.0
- ARV discount +10.1/15.0
- DSCR +7.3/10.0
- 1% rule +5.1/10.0
- Livability +3.1/5.0
- Rent growth +2.5/5.0
- Condition / age +2.5/5.0
- Schools +1.8/10.0
- Appreciation +0.0/10.0
$115,000
🖨 Deal sheet 📄 Offer letter ✓ Due diligence
Listing remarks MLS
Why pay rent when you can OWN? Perfect for the first time home buyer or someone looking to downsize or even an investor wanting some rental income. This all brick cutie has 3 bedrooms, 1 and a half baths. The recent updates include all new LVP flooring, fresh paint, new appliances. Move-in ready for new owner. Fenced back yard, covered carport extra concrete pad for additional parking. Level lot in area of nice homes.
Key facts
- 0.28 acre lot
- Built 1983
- Listed 137 days
Neighborhood map
What this means for you Summary
Snapshot
- This is a 3-bed/1.5-bath single-family listed at $115k.
Deal economics
- At list price, monthly cash flow is $198 ($2k/yr) — positive.
- The deal already cash-flows at list — no discount required.
- Meets the 1% rule at list price ($1k rent vs $115k).
- Recommended offer: $101k (12.0% below list) — sets the bar for market timing.
- Cap rate 8.4% vs local median 5.3% in Malvern — top-decile yield for the area; either an underpriced asset or a hidden risk that comps aren't pricing in. Stress-test before assuming the spread holds.
Location & tenants
- Location reads 62/100 on livability (#215 in AR) — a middle-class / working-renter tenant base. Strengths: cost of living A+, housing A+, health & safety A-; Watch: schools D-, crime F, amenities F.
- Malvern School District (town): math 21% / reading 22% proficiency, ranked #207 of 238 in AR (top 87%) — low school quality limits family demand, transient renter base, plan for 1-2y turnover; 64% free/reduced lunch — lower-income household profile, screen leases tightly.
- Market conditions: 171 active listings in the ZIP; 2 comparable units currently listed for rent nearby; 4 units permitted in Hot Spring County in 2024 (0 in 5+ unit buildings).
Forward outlook
- Local home prices are declining (-3.0%/yr); year-one equity from $795 of loan paydown is wiped out by about $3k of value loss. Plan a longer hold.
- Hot Spring County population projected to shrink 3% by 2050 — rents likely to lag national; underwrite the cash flow, not the appreciation.
Negotiation context
- It's been on market 137 days — a 12% lower offer ($101k) is reasonable based on typical stale-listing flexibility.
- 3 sale attempts since 5y ago with the ask held roughly flat each time — persistent listings suggest the price (not the market) is what's stuck; bring a comps-based counter.
Risks & watch-outs
- Climate carrying-cost: moderate wildfire risk; extreme-heat days projected 7→20/yr by 2055 (HVAC capex compounding) — expect insurance premiums to compound above CPI over the hold.
Questions for the listing agent
- It's been on market 137 days. Have you received any prior offers? Is the seller open to a 12% concession, seller financing, or rate buy-down credit?
- Why hasn't it sold? Are there any deal-killer items the seller is aware of (foundation, flood, title, zoning, code violations)?
- Is there a deadline driving the sale (1031 exchange, divorce, estate, relocation)? That informs how much negotiation room exists.
- Schools are D-rated, which usually means shorter tenancies and higher turnover. Who's the typical renter profile here, and what's been the actual vacancy rate?
- Crime grade is F in this area — have there been break-ins, vandalism, or insurance claims at this property in the last 3 years? What carrier currently insures it and at what premium?
- What's the average days-on-market for RENTAL listings here right now (not sales)? A rising rental-DOM trend means longer vacancies and softer asking-rent achievability than the comps imply.
- What's the recent tenant-quality profile in this submarket — average credit score on applications, eviction rate, late-payment / NSF rate, and stable-employment percentage? A property-management company in the area should have these aggregated.
- How much new for-sale + rental construction is in the pipeline within 1–3 miles? Heavy new supply typically softens prices + rents 12–24 months out; constrained supply supports both.
Investment metrics
- 1% rule
- 1.01% ✓
- Cap rate
- 8.36%
- Cash-on-cash
- 7.38%
- DSCR
- 1.33
- GRM
- 8.2
CMA / ARV
- ARV (on-the-fly)
- $122,100
- Comps found
- 12
Show comp detail 12 sales within ~0.75 mi
| Address | Dist | Beds/Ba | Sqft | Sold | Price | $/sf | Match |
|---|---|---|---|---|---|---|---|
| 1427 Maple St | 0.00mi | 3/1.5 | 1,110 (0%) | 1mo | $114,800 | $103 | 99 |
| 1426 Mimosa | 0.04mi | 3/1.5 | 1,161 (+5%) | 4mo | $55,000 | $47 | 88 |
| 1805 Pine Bluff St | 0.45mi | 3/2.0 | 1,112 (+0%) | 5mo | $141,000 | $127 | 72 |
| 1404 Mimosa St | 0.05mi | 2/1.0 (-1) | 999 (-10%) | 2mo | $108,000 | $108 | 72 |
| 1628 Pleasant St | 0.22mi | 3/1.0 | 1,008 (-9%) | 3mo | $20,000 | $20 | 70 |
| 1806 Wilson St | 0.28mi | 2/1.0 (-1) | 1,176 (+6%) | 0mo | $130,500 | $111 | 70 |
| 1105 Dawson St | 0.24mi | 3/1.0 | 960 (-14%) | 5mo | $85,000 | $89 | 60 |
| 1024 Toler | 0.61mi | 2/1.0 (-1) | 1,080 (-3%) | 4mo | $27,000 | $25 | 57 |
| 1414 Roosevelt | 0.25mi | 2/2.0 (-1) | 1,272 (+15%) | 3mo | $140,000 | $110 | 55 |
| 1213 Mchenry St | 0.48mi | 3/2.0 | 1,246 (+12%) | 3mo | $154,000 | $124 | 53 |
| 1017 Sulphur Springs Rd | 0.72mi | 2/2.0 (-1) | 1,064 (-4%) | 3mo | $125,000 | $117 | 50 |
| 2105 Sulton St | 0.54mi | 3/2.0 | 1,253 (+13%) | 3mo | $233,300 | $186 | 49 |
Match score weights: distance 35% · size 25% · config 20% · recency 20%. Top-matched comps best support the ARV.
Projected returns pro-forma
-3.0% appreciation · 3.0% rent growth · sell at horizon
- IRR
- -5.0%
- Equity multiple
- 0.81×
- Total profit
- $-6,051
- Equity at exit
- $17,147
- IRR
- 4.6%
- Equity multiple
- 1.34×
- Total profit
- $10,860
- Equity at exit
- $9,943
Cash invested: $32,200 (down + closing). Projections, not guarantees.
Landlord ↔ Tenant lean methodology
- Overall (STATE)
- 92 Strongly Landlord-Friendly
- State Arkansas
- 92 Strongly Landlord-Friendly · R+14
- County
- — inherits STATE
- City
- — inherits STATE
ZIP-level market 72104
- Home prices YoY
- -7.3%
- Active inventory
- 171
- Price-to-rent
- 8.2×
Monthly cashflow live
- Estimated rent
- $1,165 medium interval (Pro) →
- Mortgage (P&I)
- −$603
- Tax from tax record
- −$71 /mo · $856/yr
- Insurance
- −$48
- HOA
- −$0
- Vacancy / Maint / Mgmt
- −$245
- Net cashflow
- $198
Break-even live
UW: 25.0% down · 7.5% · 30yr · 1.5% tax · 5.0% vac · 8.0% maint · 8.0% mgmt
Financing live
Cash to close
- Down payment
- $28,750
- Closing costs
- $3,450
- Reserves months
- —
- Total cash needed
- —
Loan-product check · same deal, 3 products live
Conventional
25% down · 7.5% · 30yr
- Down + closing
- —
- Monthly P&I
- —
- Monthly cashflow
- —
- DSCR
- —
- Eligible?
- —
Personal DTI + credit; lowest rate.
DSCR
20% down · 8.5% · 30yr
- Down + closing
- —
- Monthly P&I
- —
- Monthly cashflow
- —
- DSCR
- —
- Eligible?
- —
No personal income docs; deal must DSCR.
Hard money
10% down · 12.0% · 12mo
- Down + closing
- —
- Monthly P&I
- —
- Monthly cashflow
- —
- DSCR
- —
- Eligible?
- —
Short-term bridge; refi at stabilization.
Rent comps 2 comps
| Address | Beds | Baths | Sqft | Rent | $/sqft | DOM | Units | Dist |
|---|---|---|---|---|---|---|---|---|
| 1627 Willow St Malvern, AR | 3.0 | 1.0 | 960 | $1,200 | $1.25 | 14d | 1 | 0.17mi |
| 1226 School St Malvern, AR | 2.0 | 1.0 | 768 | $900 | $1.17 | 14d | 1 | 1.01mi |
Listing history 8 events
-
2026-03-13status Under Contract
-
2025-10-26$115,000 New Listing
-
2021-12-28soldstatus $124,000 Sold 421-char remark
Show marketing remark (423 chars)
Why pay rent when you can OWN? Perfect for the first time home buyer or someone looking to downsize or even an investor wanting some rental income. This all brick cutie has 3 bedrooms, 1 and a half baths. The recent updates include all new LVP flooring, fresh paint, new appliances. Move-in ready for new owner. Fenced back yard, covered carport extra concrete pad for additional parking. Level lot in area of nice homes.
-
2021-12-28soldstatus $124,000 423-char remark
Show marketing remark (423 chars)
Why pay rent when you can OWN? Perfect for the first time home buyer or someone looking to downsize or even an investor wanting some rental income. This all brick cutie has 3 bedrooms, 1 and a half baths. The recent updates include all new LVP flooring, fresh paint, new appliances. Move-in ready for new owner. Fenced back yard, covered carport extra concrete pad for additional parking. Level lot in area of nice homes.
-
2021-12-23soldstatus $124,000
-
2021-11-03status Under Contract 421-char remark
Show marketing remark (421 chars)
Why pay rent when you can OWN? Perfect for the first time home buyer or someone looking to downsize or even an investor wanting some rental income. This all brick cutie has 3 bedrooms, 1 and a half baths. The recent updates include all new LVP flooring, fresh paint, new appliances. Move-in ready for new owner. Fenced back yard, covered carport extra concrete pad for additional parking. Level lot in area of nice homes.
-
2021-09-04$128,888 423-char remark
Show marketing remark (423 chars)
Why pay rent when you can OWN? Perfect for the first time home buyer or someone looking to downsize or even an investor wanting some rental income. This all brick cutie has 3 bedrooms, 1 and a half baths. The recent updates include all new LVP flooring, fresh paint, new appliances. Move-in ready for new owner. Fenced back yard, covered carport extra concrete pad for additional parking. Level lot in area of nice homes.
-
2021-09-03$128,888 New Listing 421-char remark
Show marketing remark (421 chars)
Why pay rent when you can OWN? Perfect for the first time home buyer or someone looking to downsize or even an investor wanting some rental income. This all brick cutie has 3 bedrooms, 1 and a half baths. The recent updates include all new LVP flooring, fresh paint, new appliances. Move-in ready for new owner. Fenced back yard, covered carport extra concrete pad for additional parking. Level lot in area of nice homes.
ⓘ Source: listings_history table (triggers on properties + properties_extension) + one-shot
backfill from property_details.listing_events for pre-trigger history.
Tax reassessment forecast AR · Resets to sale price
- Current annual tax
- $856 · $71/mo
- Projected year-2 tax
- $856 · $71/mo
- Expected delta
- $0/yr ($0/mo · 0.0%)
ⓘ Screening estimate from a state-policy table — verify with the county assessor before closing.
Climate risk First Street
- Flood 1/10 Low FEMA zone X (unshaded) · 0% chance over 30 yrs
- Wildfire 5/10 Major
- Heat 6/10 Major 7 d/yr ≥110°F today · 20 d/yr by 30 yrs out
- Wind 4/10 Moderate 15% chance of damaging wind over 30 yrs
- Air quality 2/10 Low 0 unhealthy d/yr today · 1 by 30 yrs out
Nearby sold comps map
Loading sold comps map…
Walkable amenities ~0.75 mi
Loading nearby amenities…
Taxation est. · year 1
- Rental income
- $13,980
- − Mortgage interest
- −$6,442
- − Property taxes
- −$856
- − Insurance
- −$575
- − Repairs & maintenance
- −$1,118
- − Management
- −$1,118
- − Depreciation
- −$3,345
- Taxable income
- $525
- Est. tax owed @ 24.0%
- −$126
- After-tax cash flow
- $2,250/yr
For passive investors: Depreciation is non-cash, so a rental often shows a tax loss while cash-flowing — sheltering income. Rental losses are passive: they offset passive income freely, and up to $25,000/yr can offset ordinary (W-2) income if you actively participate and your MAGI is under $100k (phasing out to $0 by $150k); unused losses carry forward. On sale, claimed depreciation is recaptured at up to 25%, and gains may owe capital-gains tax (a 1031 exchange can defer both). Figures are a year-1 estimate at your 24.0% rate — not tax advice; consult a CPA.
Schools (NCES district)
- District
- Malvern School District
- NCES district ID
- 0509240
- Math proficiency
- 21% ▼ -11.00%
- Reading proficiency
- 22% ▼ -9.00%
- Median HH income
- $35,370
- Composite
- 17.76/100
- National rank
- #9017
- State rank
- #207 of 238 in AR
Livability — Malvern
- Score
- 62/100
- State rank
- #215
- US rank
- #16632
Category grades
Schools grade is shown separately in the Schools card above.
Census & demographics
- Census place
- Malvern, AR
- Population (ZIP)
- 23,222
Population outlook (Hot Spring County) Hauer SSP2
- Today (2025)
- 34,464 people
- By 2030
- 34,659 · +0.6%
- By 2040
- 34,486 · +0.1%
- By 2050
- 33,419 · -3.0%
- By 2075
- 28,702 · -16.7%
- By 2100
- 21,415 · -37.9%
Race, ethnicity, and origin ACS 2023
- Neighborhood character
- Predominantly White (75%)
- Race & ethnicity
- White 75% Black 16% Two or more races 5% Hispanic / Latino 4%
- Common ancestry
- Serbian 2% Slovak 1% Iranian 1%
- Foreign-born
- 1% · Canada
- Languages at home
- 97% English-only · Spanish 3%
Political lean MEDSL · Hot Spring
- 2024 margin
- Solid R (+52.2) · D 22.9% · R 75.1% · Other 1.9%
- 2008→2024 swing
- -27.7pp toward R · 2008: -24.4pp · 2024: -52.2pp
- All cycles
- 2024: R+52.2 2020: R+48.7 2016: R+42.5 2012: R+29.0 2008: R+24.4
Not yet ingested
- Civics
- —
Market trends
- HPI YoY
- ▼ -16.79%
- Current HPI
- 211.6419
- Rent YoY
- —
- Metro
- —
- State GDP YoY
- ▲ 3.80%
- F500 in state
- 10
Industry mix (Fortune 500 HQ in AR)
| Industry | F500 HQs | Revenue |
|---|---|---|
| Retail | 1 | $681B |
|
||
| Food / Agriculture | 1 | $53B |
|
||
| Retail / Energy | 1 | $22B |
|
||
| Transportation / Logistics | 1 | $12B |
|
||
| Energy | 1 | $4B |
|
||
Price history
-10.8% since first listed8 events — show timeline
- 2026-03-13 Pending — CARMLS
- 2025-10-26 Listed $115,000 CARMLS
- 2021-12-28 Sold (MLS) $124,000 HSBOR
- 2021-12-28 Sold (MLS) $124,000 CARMLS
- 2021-12-23 Sold (Public Records) $124,000 Public Records
- 2021-11-03 Pending — CARMLS
- 2021-09-04 Listed $128,888 HSBOR
- 2021-09-03 Listed $128,888 CARMLS
Property tax history
+3.8%/yrLatest (2025): $856 · +0.0% YoY. Source: county tax records.
Cash-flow waterfall
monthlySold comps — $/sqft
last 12 mo · ≤1 miLoading sold comps…