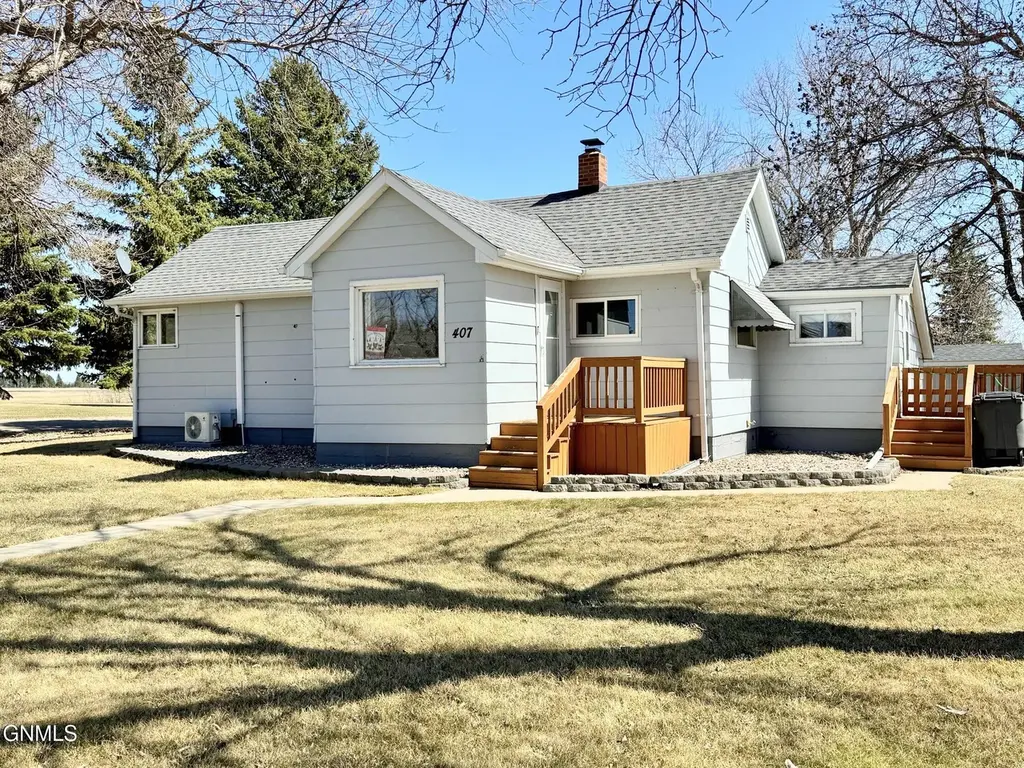
407 Roosevelt Ave NE · Bowbells, ND
Flood risk 1/10 · Minimal
- FEMA flood zone
- —
- Chance of flooding over 30 yrs
- 0.0%
- Est. flood insurance / yr
- —
Fire risk 4/10 · Minor
- Est. fire insurance / yr
- $1,289 – $2,393
Heat risk 1/10 · Minimal
- Hot days now (above 94°F)
- 7 days/yr
- Hot days in 30 yrs
- 12 days/yr
Wind risk 1/10 · Minimal
- Chance of severe wind over 30 yrs
- —
Air-quality risk 5/10 · Moderate
- Unhealthy air days now
- 8 days/yr
- Unhealthy air days in 30 yrs
- 8 days/yr
Risk factors via First Street. Map © Google.
Why this score? — see what drove the C grade
The composite is a weighted blend of 9 inputs, each scored 0–100. Each bar is that input's sub-score; the figure is the points it added to the 100-point composite (weight × sub-score).
- Cash flow +18.8/30.0
- ARV discount +7.5/15.0
- DSCR +5.9/10.0
- 1% rule +5.0/10.0
- Appreciation +5.0/10.0
- Condition / age +3.8/5.0
- Schools +3.4/10.0
- Livability +3.4/5.0
- Rent growth +2.5/5.0
$109,900
🖨 Deal sheet (PDF) 📄 Offer letter ✓ Due diligence
Key facts
- Fenced garden area
- 0.24 acre lot
- 2 garage spots
Tags
Property features AI
Finance
- Other: Property type: Residential single-family
- Financial info: Details not provided
- HOA & community: Details not provided
Exterior
- Parking: Detached 2-car garage with garage door opener; Garage faces side with alley access
- Security: Details not provided
- Utilities: Public water; Public sewer; Propane available; Electricity connected; Water connected; Sewer connected; Phone available; Cable available
- Home design: Single-family residence; One story
- Construction: Cement siding; Shingle roof; Has basement
- Exterior features: Rain gutters; Garden; Shed(s); Fenced backyard; Corner lot; Landscaped; Level, rectangular lot; Asphalt road frontage on a city street (public maintained)
Interior
- Kitchen: Dishwasher; Oven
- Bedrooms: Details not provided
- Flooring: Concrete; Laminate
- Bathrooms: 1 full bathroom; 1 three-quarter bathroom
- Heating & cooling: Propane heating; Fireplace heating; Ceiling fans for cooling; Wall/window air conditioning units
- Interior features: Ceiling fan(s); Window treatments; Living room fireplace
- Laundry & utility: Basement bath stubbed; Sump pump in basement
Neighborhood map
What this means for you Summary
Snapshot
- This is a 3-bed/2.0-bath single-family listed at $110k. Condition is rated good.
Deal economics
- At list price, monthly cash flow is $111 ($1k/yr) — positive.
- The deal already cash-flows at list — no discount required.
- Meets the 1% rule at list price ($1k rent vs $110k).
- Recommended offer: $108k (1.5% below list) — sets the bar for market timing.
Location & tenants
- Location reads 68/100 on livability (#115 in ND) — a middle-class / working-renter tenant base. Strengths: employment A+, cost of living A+; Watch: schools C-, health & safety D, amenities F.
- Bowbells 14 (rural): math 30% / reading 40% proficiency, ranked #124 of 169 in ND (top 73%) — families likely to look elsewhere, expect single-tenant / working-renter base with shorter leases; only 15% free/reduced lunch — higher-income household profile.
- Market conditions: 3 active listings in the ZIP; 3 units permitted in Burke County in 2024 (0 in 5+ unit buildings).
Forward outlook
- In year one you build about $4k of equity ($760 loan paydown + $3k appreciation (3.0% local appreciation)).
- Burke County population projected at +80% by 2050 — long-run rental-demand tailwind backs the buy-and-hold thesis.
- At projected returns (3.0% appreciation + 3.0% rent growth), your $31k cash investment doubles in ~5 years — after that, you're playing with house money.
- By year 8, paydown + projected appreciation supports a ~$30k cash-out refi (75% LTV) — recoverable capital for the next deal without selling this one.
Negotiation context
- It's been on market 21 days — a 2% lower offer ($108k) is reasonable based on typical stale-listing flexibility.
Risks & watch-outs
- Watch-outs: built in 1952 — expect roof / HVAC / electrical / plumbing capex.
Questions for the listing agent
- Built in 1952 — when were the roof, HVAC, electrical panel, plumbing, and water heater last replaced?
- Is there a deadline driving the sale (1031 exchange, divorce, estate, relocation)? That informs how much negotiation room exists.
- What's the average days-on-market for RENTAL listings here right now (not sales)? A rising rental-DOM trend means longer vacancies and softer asking-rent achievability than the comps imply.
- What's the recent tenant-quality profile in this submarket — average credit score on applications, eviction rate, late-payment / NSF rate, and stable-employment percentage? A property-management company in the area should have these aggregated.
- How much new for-sale + rental construction is in the pipeline within 1–3 miles? Heavy new supply typically softens prices + rents 12–24 months out; constrained supply supports both.
Investment metrics
- 1% rule
- 1.00% ✓
- Cap rate
- 7.51%
- Cash-on-cash
- 4.34%
- DSCR
- 1.19
- GRM
- 8.3
CMA / ARV
No comps found within radius.
Projected returns pro-forma
3.0% appreciation · 3.0% rent growth · sell at horizon
- IRR
- 11.6%
- Equity multiple
- 1.66×
- Total profit
- $20,343
- Equity at exit
- $49,416
- IRR
- 13.7%
- Equity multiple
- 3.03×
- Total profit
- $62,527
- Equity at exit
- $76,156
Cash invested: $30,772 (down + closing). Projections, not guarantees.
Landlord ↔ Tenant lean methodology
- Overall (STATE)
- 82 Strongly Landlord-Friendly
- State North Dakota
- 82 Strongly Landlord-Friendly · R+20
- County
- — inherits STATE
- City
- — inherits STATE
ZIP-level market 58721
- Active inventory
- 3
- Price-to-rent
- 8.3×
Monthly cashflow live
- Estimated rent
- $1,102 medium interval (Pro) →
- Mortgage (P&I)
- −$576
- Tax est. 1.5%
- −$137 /mo · $1,648/yr
- Insurance
- −$46
- HOA
- −$0
- Vacancy / Maint / Mgmt
- −$231
- Net cashflow
- $111
Break-even live
Sensitivity live
| Price | -10% $187 | -5% $149 | +0% $111 | +5% $73 | +10% $35 |
|---|---|---|---|---|---|
| Rent | -10% $24 | -5% $68 | +0% $111 | +5% $155 | +10% $198 |
| Rate | -1.0pp $167 | -0.5pp $139 | base $111 | +0.5pp $83 | +1.0pp $54 |
UW: 25.0% down · 7.5% · 30yr · 1.5% tax · 5.0% vac · 8.0% maint · 8.0% mgmt
Financing live
Cash to close
- Down payment
- $27,475
- Closing costs
- $3,297
- Reserves months
- —
- Total cash needed
- —
Loan-product check · same deal, 3 products live
Conventional
25% down · 7.5% · 30yr
- Down + closing
- —
- Monthly P&I
- —
- Monthly cashflow
- —
- DSCR
- —
- Eligible?
- —
Personal DTI + credit; lowest rate.
DSCR
20% down · 8.5% · 30yr
- Down + closing
- —
- Monthly P&I
- —
- Monthly cashflow
- —
- DSCR
- —
- Eligible?
- —
No personal income docs; deal must DSCR.
Hard money
10% down · 12.0% · 12mo
- Down + closing
- —
- Monthly P&I
- —
- Monthly cashflow
- —
- DSCR
- —
- Eligible?
- —
Short-term bridge; refi at stabilization.
Listing history 2 events
-
2026-05-12status Pending
-
2026-04-21$109,900 Active
ⓘ Source: listings_history table (triggers on properties + properties_extension) + one-shot
backfill from property_details.listing_events for pre-trigger history.
Climate risk First Street
- Flood 1/10 Low 0% chance over 30 yrs
- Wildfire 4/10 Moderate
- Heat 1/10 Low 7 d/yr ≥94°F today · 12 d/yr by 30 yrs out
- Wind 1/10 Low
- Air quality 5/10 Major 8 unhealthy d/yr today · 8 by 30 yrs out
Nearby sold comps map
Loading sold comps map…
Walkable amenities ~0.75 mi
Loading nearby amenities…
Taxation est. · year 1
- Rental income
- $13,227
- − Mortgage interest
- −$6,156
- − Property taxes
- −$1,648
- − Insurance
- −$550
- − Repairs & maintenance
- −$1,058
- − Management
- −$1,058
- − Depreciation
- −$3,197
- Taxable loss
- −$441
- Est. tax savings @ 24.0%
- +$106
- After-tax cash flow
- $1,441/yr
For passive investors: Depreciation is non-cash, so a rental often shows a tax loss while cash-flowing — sheltering income. Rental losses are passive: they offset passive income freely, and up to $25,000/yr can offset ordinary (W-2) income if you actively participate and your MAGI is under $100k (phasing out to $0 by $150k); unused losses carry forward. On sale, claimed depreciation is recaptured at up to 25%, and gains may owe capital-gains tax (a 1031 exchange can defer both). Figures are a year-1 estimate at your 24.0% rate — not tax advice; consult a CPA.
Condition & rehab AI · 13 photos
This single-family home is in good condition with minimal repairs needed. It has a good roof, exterior, and interior, and is move-in ready.
Value-add opportunities
- Both Paint exterior — Enhances curb appeal and resale value
- Both Clean gutters — Improves drainage and overall appearance
Renovation cost estimate screening
Value-add ROI direction
- Both Paint exterior — Enhances curb appeal and resale value ↑
- Both Clean gutters — Improves drainage and overall appearance ↑
ⓘ Cost ranges are severity-bucket heuristics (US national rule-of-thumb). Get contractor quotes + a written scope before underwriting a rehab budget.
Schools (NCES district)
- District
- Bowbells 14
- NCES district ID
- 3803090
- Math proficiency
- 30% ▲ 19.00%
- Reading proficiency
- 40% ▲ 10.00%
- Median HH income
- $57,671
- Composite
- 33.69/100
- National rank
- #10437
- State rank
- #124 of 169 in ND
Livability — Bowbells
- Score
- 68/100
- State rank
- #115
- US rank
- #10012
Category grades
Schools grade is shown separately in the Schools card above.
Census & demographics
- Census place
- Bowbells, ND
- Population (ZIP)
- 426
Population outlook (Burke County) Hauer SSP2
- Today (2025)
- 3,017 people
- By 2030
- 3,439 · +14.0%
- By 2040
- 4,388 · +45.4%
- By 2050
- 5,429 · +79.9%
- By 2075
- 8,215 · +172.3%
- By 2100
- 10,184 · +237.6%
Race, ethnicity, and origin ACS 2023
- Neighborhood character
- Predominantly White (92%)
- Race & ethnicity
- White 92% Asian 5% Two or more races 2%
- Common ancestry
- Portuguese 27% Iranian 1% Lithuanian 1%
- Foreign-born
- 5%
- Languages at home
- 95% English-only · Tagalog/Filipino 5%
Political lean MEDSL · Burke
- 2024 margin
- Solid R (+74.1) · D 12.4% · R 86.5% · Other 1.1%
- 2008→2024 swing
- -36.6pp toward R · 2008: -37.5pp · 2024: -74.1pp
- All cycles
- 2024: R+74.1 2020: R+74.2 2016: R+73.8 2012: R+52.8 2008: R+37.5
Not yet ingested
- Civics
- —
Market trends
- HPI YoY
- —
- Current HPI
- —
- Rent YoY
- —
- Metro
- —
- State GDP YoY
- ▲ 2.09%
- F500 in state
- 2
Industry mix (Fortune 500 HQ in ND)
| Industry | F500 HQs | Revenue |
|---|---|---|
| Utilities / Construction | 1 | $6B |
|
||
Price history
2 events — show timeline
- 2026-05-12 Pending — GNMLS
- 2026-04-21 Listed $109,900 GNMLS
Cash-flow waterfall
monthlySold comps — $/sqft
last 12 mo · ≤1 miLoading sold comps…