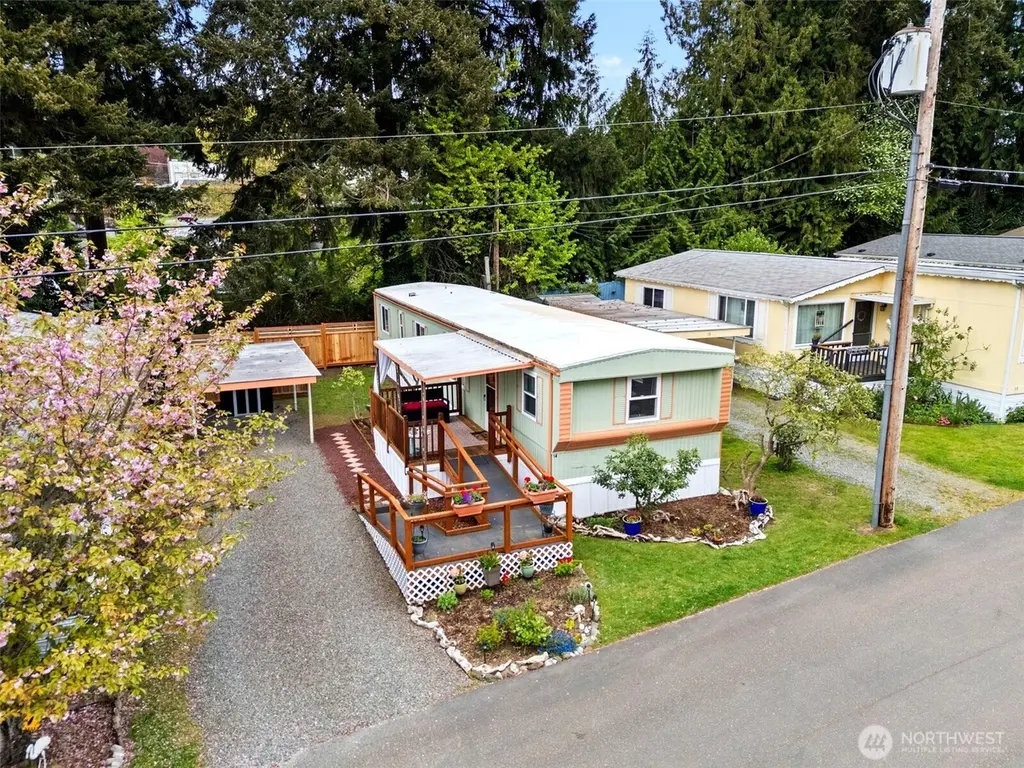
600 NE Lincoln Rd #14 · Poulsbo, WA
Flood risk 1/10 · Minimal
- FEMA flood zone
- X (unshaded)
- Chance of flooding over 30 yrs
- 0.0%
- Est. flood insurance / yr
- $507 – $1,088
Fire risk 1/10 · Minimal
- Est. fire insurance / yr
- $604 – $1,122
Heat risk 3/10 · Minor
- Hot days now (above 85°F)
- 7 days/yr
- Hot days in 30 yrs
- 15 days/yr
Wind risk 1/10 · Minimal
- Chance of severe wind over 30 yrs
- —
Air-quality risk 6/10 · Moderate
- Unhealthy air days now
- 9 days/yr
- Unhealthy air days in 30 yrs
- 9 days/yr
Risk factors via First Street. Map © Google.
Why this score? — see what drove the B- grade
The composite is a weighted blend of 9 inputs, each scored 0–100. Each bar is that input's sub-score; the figure is the points it added to the 100-point composite (weight × sub-score).
- Cash flow +30.0/30.0
- 1% rule +10.0/10.0
- DSCR +10.0/10.0
- Schools +5.4/10.0
- Livability +4.2/5.0
- Condition / age +4.0/5.0
- Rent growth +2.7/5.0
- ARV discount +2.6/15.0
- Appreciation +0.0/10.0
$99,000
🖨 Deal sheet (PDF) 📄 Offer letter ✓ Due diligence
Listing remarks
Welcome to charming, easy living in the heart of Poulsbo! This well-maintained two-bedroom, one-bath home is ideally positioned within reach of downtown shops, dining, the farmer’s market, library, medical services, parks, and everyday essentials—placing convenience at your doorstep. Inside, abundant natural light fills the living spaces, where an easy-flow layout connects the eat-in kitchen to the living room. The spacious primary bedroom provides a restful retreat, while the second bedroom offers flexibility for guests or a home office. Recent updates—including new windows, fresh paint, and updated flooring—bring a clean, refreshed feel throughout, making the home
Key facts
- Low-maintenance yard
- Covered front porch
- Easy-flow layout
Tags
Property features AI
Finance
- Financial info: Land lease: $708; Listing terms: Cash
- HOA & community: Seabird Mobile Home Park (44 homes); Park approved for sale; Common area; Senior community
Exterior
- Parking: Carport
- Utilities: Electric energy source; Public water; City sewer service; Power by PSE; Electric water heater
- Home design: Manufactured single-wide home; One level; Has view; Make: FTWD, Model: 56/14; Mobile home remains; Skirted with vinyl
- Construction: Metal roof; Metal/vinyl construction; Pillar/post/pier foundation; Manufactured after 6/15/1976
- Exterior features: Metal/vinyl exterior; Patio/porch/deck; Landscaped; Paved lot
Interior
- Kitchen: Refrigerator; Stove/Range
- Bedrooms: 2 bedrooms
- Flooring: Laminate
- Bathrooms: 1 full bathroom
- Heating & cooling: Forced air heating
- Interior features: Water heater in closet; Double pane windows
- Laundry & utility: Washer; Dryer; Utility room
Neighborhood map
What this means for you Summary
Snapshot
- This is a 2-bed/1.0-bath manufactured listed at $99k. Condition is rated good.
Deal economics
- At list price, monthly cash flow is $1k ($13k/yr) — positive.
- The deal already cash-flows at list — no discount required.
- Meets the 1% rule at list price ($2k rent vs $99k).
- Recommended offer: $98k (1.5% below list) — sets the bar for market timing.
- Cap rate 19.6% vs local median 2.7% in Poulsbo — top-decile yield for the area; either an underpriced asset or a hidden risk that comps aren't pricing in. Stress-test before assuming the spread holds.
Location & tenants
- Location reads 85/100 on livability (#30 in WA, #508 nationally) — a professional / high-income tenant draw. Strengths: amenities A+, commute A+, employment A+; Watch: cost of living F.
- North Kitsap School District (suburban): math 53% / reading 65% proficiency, ranked #54 of 291 in WA (top 19%) — acceptable for families but not a draw, mixed tenant base, ~2y average lease.
- Zoned schools: Poulsbo Elementary School (448 students, 26% FRL); Poulsbo Middle School (685 students, 30% FRL); North Kitsap High School (1,063 students, 29% FRL) — zoned schools at 28% FRL track the district average.
- Market conditions: Rents flat; 270 active listings in the ZIP; 7 comparable units currently listed for rent nearby; rentals at typical pace (median 15d on market — plan ~3-4 weeks tenant-placement turnaround); high-income renter base; 1,294 units permitted in Kitsap County in 2024 (302 in 5+ unit buildings).
Forward outlook
- Local home prices are declining (-3.0%/yr); year-one equity from $684 of loan paydown is wiped out by about $3k of value loss. Plan a longer hold.
- Kitsap County population projected at +8% by 2050 — modest demand growth; plan on rents tracking national, not racing it.
- At projected returns (-3.0% appreciation + 0.7% rent growth), your $28k cash investment doubles in ~3 years — after that, you're playing with house money.
Negotiation context
- It's been on market 16 days — a 2% lower offer ($98k) is reasonable based on typical stale-listing flexibility.
Questions for the listing agent
- Built in 1977 — when were the roof, HVAC, electrical panel, plumbing, and water heater last replaced?
- Is there a deadline driving the sale (1031 exchange, divorce, estate, relocation)? That informs how much negotiation room exists.
- Schools are B-rated — typically a magnet for longer-tenancy family renters. What's the average tenant stay here, and is there a school-zone premium baked into asking?
- What's the average days-on-market for RENTAL listings here right now (not sales)? A rising rental-DOM trend means longer vacancies and softer asking-rent achievability than the comps imply.
- What's the recent tenant-quality profile in this submarket — average credit score on applications, eviction rate, late-payment / NSF rate, and stable-employment percentage? A property-management company in the area should have these aggregated.
- How much new for-sale + rental construction is in the pipeline within 1–3 miles? Heavy new supply typically softens prices + rents 12–24 months out; constrained supply supports both.
Investment metrics
- 1% rule
- 2.28% ✓
- Cap rate
- 19.59%
- Cash-on-cash
- 47.50%
- DSCR
- 3.11
- GRM
- 3.7
CMA / ARV
- ARV (median comp)
- $89,240
- List price
- $99,000
- Delta
- 10.94%
- Verdict
- OVERPRICED
- Comps
- 2 within 1.0 mi
Show comp detail 3 sales within ~0.75 mi
| Address | Dist | Beds/Ba | Sqft | Sold | Price | $/sf | Match |
|---|---|---|---|---|---|---|---|
| 600 NE Lincoln Rd #14 | 0.00mi | 2/1.0 | 784 (0%) | 0mo | $99,000 | $126 | 100 |
| 600 NE Lincoln Rd #41 | 0.04mi | 2/1.0 | 768 (-2%) | 8mo | $79,500 | $104 | 88 |
| 600 NE Lincoln Rd #12 | 0.04mi | 2/2.0 | 900 (+15%) | 16mo | $151,000 | $168 | 57 |
Match score weights: distance 35% · size 25% · config 20% · recency 20%. Top-matched comps best support the ARV.
Projected returns pro-forma
-3.0% appreciation · 0.71% rent growth · sell at horizon
- IRR
- 42.3%
- Equity multiple
- 2.76×
- Total profit
- $48,796
- Equity at exit
- $14,761
- IRR
- 47.3%
- Equity multiple
- 5.07×
- Total profit
- $112,708
- Equity at exit
- $8,560
Cash invested: $27,720 (down + closing). Projections, not guarantees.
Landlord ↔ Tenant lean methodology
- Overall (STATE)
- 28 Tenant-Leaning
- State Washington
- 28 Tenant-Leaning · D+8
- County
- — inherits STATE
- City
- — inherits STATE
ZIP-level market 98370
- Rents YoY
- 0.7%
- Active inventory
- 270
- Price-to-rent
- 3.7×
Monthly cashflow live
- Estimated rent
- $2,255 high interval (Pro) →
- Mortgage (P&I)
- −$519
- Tax est. 1.5%
- −$124 /mo · $1,485/yr
- Insurance
- −$41
- HOA
- −$0
- Vacancy / Maint / Mgmt
- −$474
- Net cashflow
- $1,097
Break-even live
Sensitivity live
| Price | -10% $1,166 | -5% $1,131 | +0% $1,097 | +5% $1,063 | +10% $1,029 |
|---|---|---|---|---|---|
| Rent | -10% $919 | -5% $1,008 | +0% $1,097 | +5% $1,186 | +10% $1,275 |
| Rate | -1.0pp $1,147 | -0.5pp $1,122 | base $1,097 | +0.5pp $1,072 | +1.0pp $1,046 |
UW: 25.0% down · 7.5% · 30yr · 1.5% tax · 5.0% vac · 8.0% maint · 8.0% mgmt
Financing live
Cash to close
- Down payment
- $24,750
- Closing costs
- $2,970
- Reserves months
- —
- Total cash needed
- —
Loan-product check · same deal, 3 products live
Conventional
25% down · 7.5% · 30yr
- Down + closing
- —
- Monthly P&I
- —
- Monthly cashflow
- —
- DSCR
- —
- Eligible?
- —
Personal DTI + credit; lowest rate.
DSCR
20% down · 8.5% · 30yr
- Down + closing
- —
- Monthly P&I
- —
- Monthly cashflow
- —
- DSCR
- —
- Eligible?
- —
No personal income docs; deal must DSCR.
Hard money
10% down · 12.0% · 12mo
- Down + closing
- —
- Monthly P&I
- —
- Monthly cashflow
- —
- DSCR
- —
- Eligible?
- —
Short-term bridge; refi at stabilization.
Rent comps 7 comps
| Address | Beds | Baths | Sqft | Rent | $/sqft | DOM | Units | Dist |
|---|---|---|---|---|---|---|---|---|
| 19101 3rd Ave NE Unit 201 Poulsbo, WA | 2.0 | 1.0 | 850 | $2,000 | $2.35 | 22d | 1 | 0.23mi |
| 19059 Jensen Way NE Poulsbo, WA | 1.0 | 1.0 | 624 | $2,368 | $3.80 | 15d | 3 | 0.29mi |
| 2122 NE Hostmark St Poulsbo, WA | 1.0–3.0 | 1.0–1.5 | 920 | $2,500 | $2.72 | 15d | 6 | 0.98mi |
| 20455 1st Ave NE Poulsbo, WA | 1.0–3.0 | 1.0–2.0 | 1015 | $2,538 | $2.50 | 15d | 4 | 0.98mi |
| 20031 Winton Ln NW Poulsbo, WA | 2.0 | 1.0 | 905 | $1,999 | $2.21 | 15d | 2 | 1.03mi |
| 530 NW Carolyn Ln Unit B Poulsbo, WA | 1.0 | 1.0 | 625 | $1,495 | $2.39 | 15d | 1 | 1.20mi |
| 17429 Nordic Cove Ln NW Poulsbo, WA | 2.0 | 1.0 | 1100 | $2,800 | $2.55 | 45d | 1 | 1.32mi |
Listing history 3 events
-
2026-05-17status Pending
-
2026-05-15price $99,000
-
2026-05-01$115,000 Active
ⓘ Source: listings_history table (triggers on properties + properties_extension) + one-shot
backfill from property_details.listing_events for pre-trigger history.
Climate risk First Street
- Flood 1/10 Low FEMA zone X (unshaded) · 0% chance over 30 yrs
- Wildfire 1/10 Low
- Heat 3/10 Moderate 7 d/yr ≥85°F today · 15 d/yr by 30 yrs out
- Wind 1/10 Low
- Air quality 6/10 Major 9 unhealthy d/yr today · 9 by 30 yrs out
Nearby sold comps map
Loading sold comps map…
Walkable amenities ~0.75 mi
Loading nearby amenities…
Taxation est. · year 1
- Rental income
- $27,060
- − Mortgage interest
- −$5,546
- − Property taxes
- −$1,485
- − Insurance
- −$495
- − Repairs & maintenance
- −$2,165
- − Management
- −$2,165
- − Depreciation
- −$2,880
- Taxable income
- $12,324
- Est. tax owed @ 24.0%
- −$2,958
- After-tax cash flow
- $10,209/yr
For passive investors: Depreciation is non-cash, so a rental often shows a tax loss while cash-flowing — sheltering income. Rental losses are passive: they offset passive income freely, and up to $25,000/yr can offset ordinary (W-2) income if you actively participate and your MAGI is under $100k (phasing out to $0 by $150k); unused losses carry forward. On sale, claimed depreciation is recaptured at up to 25%, and gains may owe capital-gains tax (a 1031 exchange can defer both). Figures are a year-1 estimate at your 24.0% rate — not tax advice; consult a CPA.
Condition & rehab AI · 12 photos
This well-maintained two-bedroom home in Poulsbo offers a good condition with recent updates and a great location. It's ready for a new owner to make it their own with minor updates to enhance its curb appeal and interior aesthetics.
Value-add opportunities
- Both Paint touch-ups — Fresh paint enhances curb appeal and interior aesthetics.
- Both Landscaping improvements — Enhanced landscaping can increase both resale and rental value.
- Both New flooring in kitchen and bathrooms — Updated flooring can significantly boost both resale and rental value.
- Both New kitchen appliances — Modern appliances can attract more buyers and renters.
- Both New window treatments — Fresh window treatments can improve curb appeal and interior aesthetics.
- Both Landscaping improvements — Enhanced landscaping can increase both resale and rental value.
Renovation cost estimate screening
Value-add ROI direction
- Both Paint touch-ups — Fresh paint enhances curb appeal and interior aesthetics. ↑
- Both Landscaping improvements — Enhanced landscaping can increase both resale and rental value. ↑
- Both New flooring in kitchen and bathrooms — Updated flooring can significantly boost both resale and rental value. ↑
- Both New kitchen appliances — Modern appliances can attract more buyers and renters. ↑
- Both New window treatments — Fresh window treatments can improve curb appeal and interior aesthetics. ↑
- Both Landscaping improvements — Enhanced landscaping can increase both resale and rental value. ↑
ⓘ Cost ranges are severity-bucket heuristics (US national rule-of-thumb). Get contractor quotes + a written scope before underwriting a rehab budget.
Schools (NCES district)
- District
- North Kitsap School District
- NCES district ID
- 5305760
- Math proficiency
- 53% ▼ -1.00%
- Reading proficiency
- 65% ▲ 1.00%
- Median HH income
- $68,919
- Composite
- 53.68/100
- National rank
- #3092
- State rank
- #54 of 291 in WA
Livability — Poulsbo
- Score
- 85/100
- State rank
- #30
- US rank
- #508
Category grades
Schools grade is shown separately in the Schools card above.
Census & demographics
- Census place
- Poulsbo, WA
- County
- Kitsap County · 243,099 people
- City population
- 33,655
- Metro
- Bremerton-Silverdale-Port Orchard, WA
- Population (ZIP)
- 33,655
- Household income
- $116,756
- Rent vs Own
- Severe rent burden
- 904.0
Population outlook (Kitsap County) Hauer SSP2
- Today (2025)
- 277,525 people
- By 2030
- 285,040 · +2.7%
- By 2040
- 294,957 · +6.3%
- By 2050
- 300,622 · +8.3%
- By 2075
- 315,580 · +13.7%
- By 2100
- 304,340 · +9.7%
Race, ethnicity, and origin ACS 2023
- Neighborhood character
- Predominantly White (79%)
- Race & ethnicity
- White 79% Two or more races 11% Hispanic / Latino 9% Asian 3% Black 1%
- Hispanic origin (detail)
- Mexican 5%
- Common ancestry
- Portuguese 7% Italian 4% Slovak 3%
- Foreign-born
- 6% · Canada, South Korea
- Languages at home
- 93% English-only · Spanish 4% Other Indo-European 1% Other Asian/Pacific 1%
Political lean MEDSL · Kitsap
- 2024 margin
- Strong D (+20.9) · D 58.8% · R 37.9% · Other 3.3%
- 2008→2024 swing
- +8.6pp toward D · 2008: 12.3pp · 2024: 20.9pp
- All cycles
- 2024: D+20.9 2020: D+18.1 2016: D+11.6 2012: D+11.1 2008: D+12.3
Not yet ingested
- Civics
- —
Market trends
- HPI YoY
- ▼ -342.47%
- Current HPI
- 347.3427
- Rent YoY
- ▲ 0.71%
- Metro
- Bremerton-Silverdale-Port Orchard, WA
- State GDP YoY
- ▲ 4.65%
- F500 in state
- 22
Industry mix (Fortune 500 HQ in WA)
| Industry | F500 HQs | Revenue |
|---|---|---|
| Retail | 2 | $269B |
|
||
| Technology / Retail | 1 | $638B |
|
||
| Technology | 1 | $245B |
|
||
| Telecommunications | 1 | $38B |
|
||
| Food / Beverage | 1 | $36B |
|
||
| Automotive / Trucks | 1 | $34B |
|
||
Price history
-13.9% since first listed4 events — show timeline
- 2026-06-15 Sold (MLS) $99,000 NWMLS as Distributed by MLS Grid
- 2026-05-17 Pending — NWMLS as Distributed by MLS Grid
- 2026-05-15 Price Changed $99,000 NWMLS as Distributed by MLS Grid
- 2026-05-01 Listed $115,000 NWMLS as Distributed by MLS Grid
Cash-flow waterfall
monthlySold comps — $/sqft
last 12 mo · ≤1 miLoading sold comps…