 Multi-family
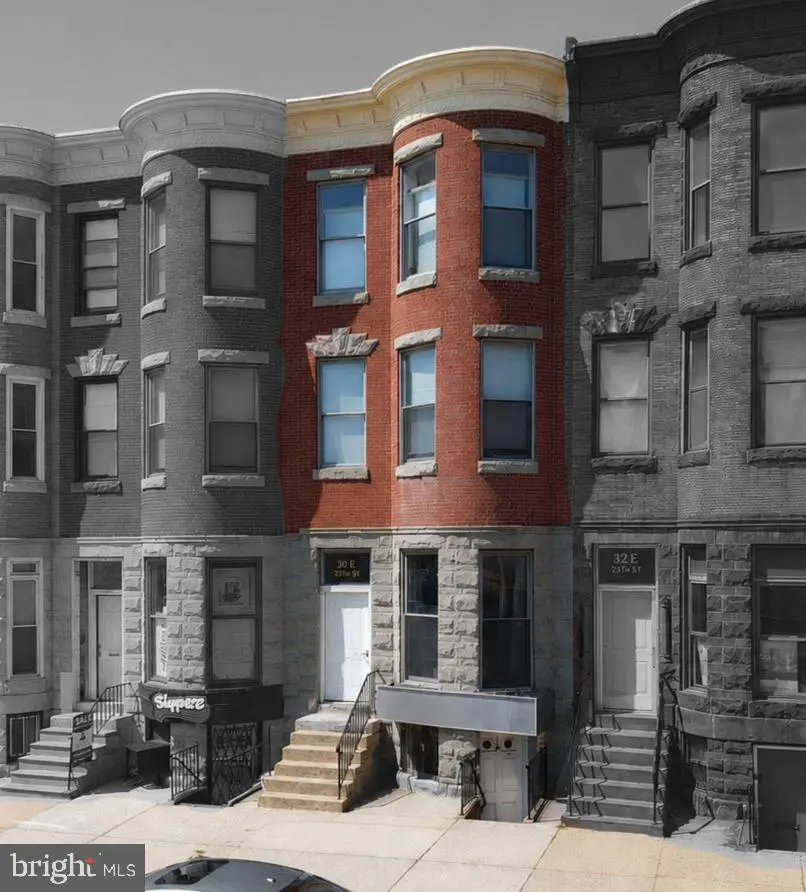
30 E 25th St · Baltimore, MD
Flood risk No data
- FEMA flood zone
- —
- Chance of flooding over 30 yrs
- —
- Est. flood insurance / yr
- —
Fire risk No data
- Est. fire insurance / yr
- —
Heat risk No data
- Hot days now (above threshold)
- —
- Hot days in 30 yrs
- —
Wind risk No data
- Chance of severe wind over 30 yrs
- —
Air-quality risk No data
- Unhealthy air days now
- —
- Unhealthy air days in 30 yrs
- —
Risk factors via First Street. Map © Google.
Why this score? — see what drove the B- grade
The composite is a weighted blend of 9 inputs, each scored 0–100. Each bar is that input's sub-score; the figure is the points it added to the 100-point composite (weight × sub-score).
- Cash flow +30.0/30.0
- 1% rule +10.0/10.0
- DSCR +10.0/10.0
- ARV discount +5.5/15.0
- Livability +3.8/5.0
- Rent growth +2.9/5.0
- Condition / age +2.5/5.0
- Schools +1.0/10.0
- Appreciation +0.0/10.0
$475,000
🖨 Deal sheet (PDF) 📄 Offer letter ✓ Due diligence
Multi-family units
County records classify this as Multi-Family (2-4 Unit). Listing-text estimate: 1 unit. estimate disagrees with records
Listing remarks
30 East 25th Street is a six-unit mixed-use investment property located along the East 25th Street commercial corridor in Baltimore’s Charles Village neighborhood. The property includes four residential apartments and two commercial suites, creating diversified income through a combination of apartment and street-level commercial tenancy. Priced at $79,167 per unit and $152 per square foot, the offering presents a lower-basis entry point into one of North Baltimore’s most recognizable mixed-use corridors. Current operations project a 9.20% cap rate and 10.4% cash-on-cash return at market rents, supported by residential demand and commercial visibility along 25th Street. The resi
Key facts
- Commercial suites
- Hardwood flooring
- Diversified income
Tags
Property features AI
Finance
- Other: Land assessed value provided; Improvement assessed value provided; Property located in city limits of Baltimore
- Financial info: Total actual rent reported: $65,952; Ground rent paid annually
Exterior
- Parking: Street parking
- Utilities: Public water; Public sewer; 100 amp electric service; Electric hot water
- Home design: Interior townhouse/rowhouse; Fee simple ownership; Estimated year built
- Construction: Brick construction; Brick/mortar foundation; Flat rubber roof
- Exterior features: Street parking available; Lot dimensions approximately 16'8" x 95'; No tidal water on property; Above-grade other structures
Interior
- Bedrooms: Two single-room units; Two one-bedroom units
- Heating & cooling: Heat pumps (electric); Central air conditioning (electric)
- Interior features: Interior townhouse/rowhouse layout; Above-grade finished living area (estimated 3,135)
Neighborhood map
What this means for you Summary
Snapshot
- This is a 2-bed/?-bath multifamily listed at $475k.
Deal economics
- At list price, monthly cash flow is $3k ($38k/yr) — positive.
- The deal already cash-flows at list — no discount required.
- Meets the 1% rule at list price ($8k rent vs $475k).
- Recommended offer: $468k (1.5% below list) — sets the bar for market timing.
- Cap rate 14.3% vs local median 6.0% in Baltimore — top-decile yield for the area; either an underpriced asset or a hidden risk that comps aren't pricing in. Stress-test before assuming the spread holds.
Location & tenants
- Location reads 76/100 on livability (#90 in MD, #3,396 nationally) — a middle-class / working-renter tenant base. Strengths: amenities A+, commute A+, housing A+; Watch: crime F.
- Baltimore City Public Schools (urban): math 7% / reading 16% proficiency, ranked #24 of 24 in MD (top 100%) — low school quality limits family demand, transient renter base, plan for 1-2y turnover; 79% free/reduced lunch — lower-income household profile, screen leases tightly.
- Zoned schools: Elmer A. Henderson: A Johns Hopkins Partnership (math 2% / reading 16%, grade F, #650 of 860 statewide, top 77%, 642 students, 80% FRL); Baltimore Polytechnic Institute (math 71% / reading 84%, grade A-, #22 of 222 statewide, top 10%, 1,555 students, 43% FRL) — zoned schools average 62% FRL vs 79% district-wide (17 pts lower); this property's tenant base skews higher-income than the district average.
- Zoned-school proficiency averages 43% at this address vs 12% district-wide (+32 pts) — the actual schools serving this property are materially stronger than the Baltimore City Public Schools average implies; a family-tenant draw the district grade alone would hide.
- Market conditions: Rents rising (+1.6%/yr); 333 active listings in the ZIP; 22 comparable units currently listed for rent nearby; rentals lingering (median 46d on market — plan ~5-8 weeks vacancy on turnover, expect pricing pressure); 64% of comp listings sitting > 30 days — soft ceiling on asking rent; 1,273 units permitted in Baltimore city in 2024 (1,104 in 5+ unit buildings).
Forward outlook
- Local home prices are declining (-3.0%/yr); year-one equity from $3k of loan paydown is wiped out by about $14k of value loss. Plan a longer hold.
- Baltimore County population projected to shrink 4% by 2050 — rents likely to lag national; underwrite the cash flow, not the appreciation.
- At projected returns (-3.0% appreciation + 1.6% rent growth), your $133k cash investment doubles in ~5 years — after that, you're playing with house money.
Negotiation context
- It's been on market 23 days — a 2% lower offer ($468k) is reasonable based on typical stale-listing flexibility.
- 7 sale attempts since 14y ago with the ask held roughly flat each time — persistent listings suggest the price (not the market) is what's stuck; bring a comps-based counter.
- Current owner paid $35k; list at $475k implies a 1257% gain — meaningful room to come down on a strong offer.
Risks & watch-outs
- Watch-outs: built in 1900 — expect roof / HVAC / electrical / plumbing capex.
Questions for the listing agent
- Built in 1900 — when were the roof, HVAC, electrical panel, plumbing, and water heater last replaced?
- Is there a deadline driving the sale (1031 exchange, divorce, estate, relocation)? That informs how much negotiation room exists.
- Schools are D-rated, which usually means shorter tenancies and higher turnover. Who's the typical renter profile here, and what's been the actual vacancy rate?
- Crime grade is F in this area — have there been break-ins, vandalism, or insurance claims at this property in the last 3 years? What carrier currently insures it and at what premium?
- What's the average days-on-market for RENTAL listings here right now (not sales)? A rising rental-DOM trend means longer vacancies and softer asking-rent achievability than the comps imply.
- What's the recent tenant-quality profile in this submarket — average credit score on applications, eviction rate, late-payment / NSF rate, and stable-employment percentage? A property-management company in the area should have these aggregated.
- How much new apartment / multifamily construction is in the pipeline within 1–3 miles? Heavy new supply (>2% of stock underway) typically softens rents 12–24 months out; light construction supports rent growth.
Investment metrics
- 1% rule
- 1.65% ✓
- Cap rate
- 14.29%
- Cash-on-cash
- 28.55%
- DSCR
- 2.27
- GRM
- 5.1
CMA / ARV
- ARV (on-the-fly)
- $454,575
- Comps found
- 11
Show comp detail 11 sales within ~0.75 mi
| Address | Dist | Beds/Ba | Sqft | Sold | Price | $/sf | Match |
|---|---|---|---|---|---|---|---|
| 2541 Saint Paul St | 0.07mi | 2/— | 3,027 (-3%) | 2mo | $220,000 | $73 | 89 |
| 2210 Maryland Ave | 0.28mi | 3/— (+1) | 2,997 (-4%) | 6mo | $400,000 | $133 | 70 |
| 2212 Maryland Ave | 0.28mi | 3/— (+1) | 2,997 (-4%) | 6mo | $400,000 | $133 | 70 |
| 3001 N Calvert St | 0.46mi | 3/— (+1) | 3,307 (+6%) | 1mo | $550,000 | $166 | 63 |
| 2311 N Calvert St | 0.20mi | 3/3.0 (+1) | 2,800 (-11%) | 9mo | $405,000 | $145 | 60 |
| 2800 Huntingdon Ave | 0.42mi | 3/2.5 (+1) | 3,300 (+5%) | 16mo | $325,000 | $98 | 54 |
| 2619 Saint Paul St | 0.14mi | 3/— (+1) | 2,784 (-11%) | 20mo | $435,000 | $156 | 53 |
| 2024 Saint Paul St | 0.36mi | 3/— (+1) | 2,805 (-10%) | 14mo | $450,000 | $160 | 49 |
| 1906 Mount Royal Ter | 0.74mi | 3/3.0 (+1) | 3,262 (+4%) | 6mo | $420,000 | $129 | 48 |
| 1609 Saint Paul St | 0.68mi | 3/— (+1) | 2,810 (-10%) | 2mo | $540,000 | $192 | 44 |
| 1624 N Calvert St | 0.68mi | 1/— (-1) | 2,800 (-11%) | 9mo | $425,000 | $152 | 38 |
Match score weights: distance 35% · size 25% · config 20% · recency 20%. Top-matched comps best support the ARV.
Projected returns pro-forma
-3.0% appreciation · 1.63% rent growth · sell at horizon
- IRR
- 21.3%
- Equity multiple
- 1.86×
- Total profit
- $113,895
- Equity at exit
- $70,824
- IRR
- 28.5%
- Equity multiple
- 3.38×
- Total profit
- $316,034
- Equity at exit
- $41,069
Cash invested: $133,000 (down + closing). Projections, not guarantees.
Landlord ↔ Tenant lean methodology
- Overall (CITY)
- 12 Strongly Tenant-Friendly
- State Maryland
- 27 Tenant-Leaning · D+14
- County
- — inherits STATE
- City Baltimore
- 12 Strongly Tenant-Friendly · D+58
ZIP-level market 21218
- Rents YoY
- 1.6%
- Active inventory
- 333
- Price-to-rent
- 30.3×
Monthly cashflow live
- Estimated rent
- $7,830 high interval (Pro) →
- Mortgage (P&I)
- −$2,491
- Tax from tax record
- −$332 /mo · $3,986/yr
- Insurance
- −$198
- HOA
- −$0
- Lot rent
- −$0
- Vacancy / Maint / Mgmt
- −$1,644
- Net cashflow
- $3,165
Break-even live
Sensitivity live
| Price | -10% $3,434 | -5% $3,299 | +0% $3,165 | +5% $3,030 | +10% $2,896 |
|---|---|---|---|---|---|
| Rent | -10% $2,546 | -5% $2,855 | +0% $3,165 | +5% $3,474 | +10% $3,783 |
| Rate | -1.0pp $3,404 | -0.5pp $3,285 | base $3,165 | +0.5pp $3,042 | +1.0pp $2,916 |
6-unit breakdown (identical units grouped — click to expand)
| Units | Beds | Baths | Est. rent |
|---|---|---|---|
| 6× units | 2 | 1 | $7,830 |
| #1 | 2 | 1 | $1,305 |
| #2 | 2 | 1 | $1,305 |
| #3 | 2 | 1 | $1,305 |
| #4 | 2 | 1 | $1,305 |
| #5 | 2 | 1 | $1,305 |
| #6 | 2 | 1 | $1,305 |
| Total (6 units) | $7,830 | ||
UW: 25.0% down · 7.5% · 30yr · 1.5% tax · 5.0% vac · 8.0% maint · 8.0% mgmt
Financing live
Cash to close
- Down payment
- $118,750
- Closing costs
- $14,250
- Reserves months
- —
- Total cash needed
- —
Loan-product check · same deal, 3 products live
Conventional
25% down · 7.5% · 30yr
- Down + closing
- —
- Monthly P&I
- —
- Monthly cashflow
- —
- DSCR
- —
- Eligible?
- —
Personal DTI + credit; lowest rate.
DSCR
20% down · 8.5% · 30yr
- Down + closing
- —
- Monthly P&I
- —
- Monthly cashflow
- —
- DSCR
- —
- Eligible?
- —
No personal income docs; deal must DSCR.
Hard money
10% down · 12.0% · 12mo
- Down + closing
- —
- Monthly P&I
- —
- Monthly cashflow
- —
- DSCR
- —
- Eligible?
- —
Short-term bridge; refi at stabilization.
Rent comps 22 comps
| Address | Beds | Baths | Sqft | Rent | $/sqft | DOM | Units | Dist |
|---|---|---|---|---|---|---|---|---|
| 2227 Saint Paul St Unit 2 Baltimore, MD | 2.0 | 2.0 | 3428 | $1,200 | $0.35 | 46d | 1 | 0.21mi |
| 139 E North Ave Unit 3 Baltimore, MD | 1.0 | 1.0 | 3060 | $1,300 | $0.42 | 46d | 1 | 0.50mi |
| 1824 Saint Paul St Unit 3 Baltimore, MD | 2.0 | 1.0 | 2397 | $1,275 | $0.53 | 46d | 1 | 0.52mi |
| 411 E Lafayette Ave Baltimore, MD | 3.0 | 2.5 | 2450 | $2,900 | $1.18 | 26d | 1 | 0.64mi |
| 1643 Guilford Ave Baltimore, MD | 3.0 | 3.5 | 2273 | $3,200 | $1.41 | 46d | 1 | 0.67mi |
| 3214 Abell Ave Baltimore, MD | 3.0 | 1.5 | 2300 | $2,800 | $1.22 | 26d | 1 | 0.68mi |
| 101 E 33rd St Unit 2 Baltimore, MD | 1.0 | 1.0 | 2550 | $1,500 | $0.59 | 15d | 1 | 0.68mi |
| 1602 Park Ave Unit 3F Baltimore, MD | 1.0 | 1.0 | 4290 | $1,300 | $0.30 | 17d | 1 | 0.87mi |
| 32 E Preston St Unit B Baltimore, MD | 3.0 | 3.0 | 2500 | $2,890 | $1.16 | 46d | 1 | 0.92mi |
| 2535 Brookfield Ave Baltimore, MD | 3.0 | 1.0 | 2736 | $1,500 | $0.55 | 46d | 1 | 0.95mi |
| 805 Brooks Ln #2 Baltimore, MD | 2.0 | 1.0 | 2120 | $1,500 | $0.71 | 5d | 1 | 0.99mi |
| 1020 Park Ave Baltimore, MD | 2.0 | 2.0–2.5 | 2004 | $3,712 | $1.85 | 5d | 11 | 1.08mi |
| 2312 Eutaw Pl Unit A Baltimore, MD | 2.0 | 2.5 | 4464 | $2,300 | $0.52 | 46d | 1 | 1.14mi |
| 1929 McCulloh St Baltimore, MD | 3.0 | 2.5 | 3293 | $2,595 | $0.79 | 46d | 1 | 1.20mi |
| 1614 McCulloh St #1 Baltimore, MD | 3.0 | 3.0 | 2885 | $2,400 | $0.83 | 46d | 1 | 1.21mi |
| 919 Saint Paul St Apt 1 Baltimore, MD | 1.0 | 1.0 | 4221 | $1,850 | $0.44 | 17d | 1 | 1.22mi |
| 2014 McCulloh St Unit 1 Baltimore, MD | 1.0 | 1.0 | 2440 | $1,200 | $0.49 | 46d | 1 | 1.23mi |
| 2020 McCulloh St Unit 1 Baltimore, MD | 2.0 | 2.0 | 2440 | $1,650 | $0.68 | 46d | 1 | 1.23mi |
| 2020 McCulloh St Unit 2 Baltimore, MD | 2.0 | 2.0 | 2440 | $1,950 | $0.80 | 46d | 1 | 1.23mi |
| 1927 Druid Hill Ave #2 Baltimore, MD | 3.0 | 2.0 | 3312 | $2,350 | $0.71 | 46d | 1 | 1.25mi |
| 1532 N Broadway Baltimore, MD | 3.0 | 4.0 | 2696 | $2,700 | $1.00 | 5d | 1 | 1.30mi |
| 549 Mosher St Baltimore, MD | 3.0 | 1.0 | 2200 | $1,350 | $0.61 | 46d | 1 | 1.38mi |
Listing history 31 events
-
2026-06-21statusdays on market $475,000 Pending 23 DOM
-
2026-06-18days on market $475,000 Active 22 DOM
-
2026-06-17days on market $475,000 Active 21 DOM
-
2026-06-16days on market $475,000 Active 20 DOM
-
2026-06-15days on market $475,000 Active 19 DOM
-
2026-06-13days on market $475,000 Active 17 DOM
-
2026-06-09days on market $475,000 Active 13 DOM
-
2026-06-08days on market $475,000 Active 12 DOM
-
2026-06-07days on market $475,000 Active 11 DOM
-
2026-06-04days on market $475,000 Active 8 DOM
-
2026-06-03days on market $475,000 Active 7 DOM
-
2026-06-02days on market $475,000 Active 6 DOM
-
2026-06-01days on market $475,000 Active 5 DOM
-
2026-05-31days on market $475,000 Active 4 DOM
-
2026-05-27$475,000 Active
-
2024-04-23historical $1,015
-
2024-04-11$1,015
-
2024-04-10historical $1,015
-
2024-03-13$1,015
-
2021-02-02historical
-
2021-02-02historical
-
2020-11-18$1,250,000 Active
-
2020-11-18$1,250,000 Active
-
2012-11-08price $40,000 Sold
-
2012-11-08soldstatus $35,000 Sold
-
2012-11-08soldstatus $35,000
-
2012-10-05status Contract
-
2012-10-05historical
-
2012-09-27price $59,000
-
2012-08-09$99,000 Active
-
2012-08-09$40,000
ⓘ Source: listings_history table (triggers on properties + properties_extension) + one-shot
backfill from property_details.listing_events for pre-trigger history.
Tax reassessment forecast MD · Partial reset (capped growth)
- Current annual tax
- $3,986 · $332/mo
- Projected year-2 tax
- $4,582 · $382/mo
- Expected delta
- +$596/yr (+$50/mo · 14.9%)
ⓘ Screening estimate from a state-policy table — verify with the county assessor before closing.
Nearby sold comps map
Loading sold comps map…
Walkable amenities ~0.75 mi
Loading nearby amenities…
Taxation est. · year 1
- Rental income
- $93,960
- − Mortgage interest
- −$26,607
- − Property taxes
- −$3,986
- − Insurance
- −$2,375
- − Repairs & maintenance
- −$7,517
- − Management
- −$7,517
- − Depreciation
- −$13,818
- Taxable income
- $32,139
- Est. tax owed @ 24.0%
- −$7,713
- After-tax cash flow
- $30,262/yr
For passive investors: Depreciation is non-cash, so a rental often shows a tax loss while cash-flowing — sheltering income. Rental losses are passive: they offset passive income freely, and up to $25,000/yr can offset ordinary (W-2) income if you actively participate and your MAGI is under $100k (phasing out to $0 by $150k); unused losses carry forward. On sale, claimed depreciation is recaptured at up to 25%, and gains may owe capital-gains tax (a 1031 exchange can defer both). Figures are a year-1 estimate at your 24.0% rate — not tax advice; consult a CPA.
Schools (NCES district)
- District
- Baltimore City Public Schools
- NCES district ID
- 2400090
- Math proficiency
- 7% ▼ -9.00%
- Reading proficiency
- 16% ▼ -5.00%
- Median HH income
- $42,108
- Composite
- 10.08/100
- National rank
- #9805
- State rank
- #24 of 24 in MD
Livability — Baltimore
- Score
- 76/100
- State rank
- #90
- US rank
- #3396
Category grades
Schools grade is shown separately in the Schools card above.
Census & demographics
- Census place
- Baltimore, MD
- County
- Baltimore City · 558,601 people
- City population
- 588,727
- Metro
- Baltimore-Columbia-Towson, MD
- Population (ZIP)
- 44,014
- Household income
- $62,488
- Rent vs Own
- Severe rent burden
- 2564.0
Population outlook (Baltimore County) Hauer SSP2
- Today (2025)
- 624,249 people
- By 2030
- 621,541 · -0.4%
- By 2040
- 609,756 · -2.3%
- By 2050
- 597,249 · -4.3%
- By 2075
- 552,236 · -11.5%
- By 2100
- 513,934 · -17.7%
Race, ethnicity, and origin ACS 2023
- Neighborhood character
- Diverse neighborhood (Simpson 0.58)
- Race & ethnicity
- Black 60% White 26% Two or more races 6% Hispanic / Latino 5% Asian 5%
- Hispanic origin (detail)
- Common ancestry
- Romanian 2% Italian 1% Scotch-Irish 1%
- Foreign-born
- 10% · Canada, China, South Korea
- Languages at home
- 87% English-only · Spanish 4% French/Haitian/Cajun 2% Chinese 2%
Political lean MEDSL · Baltimore
- 2024 margin
- Solid D (+73.0) · D 85.2% · R 12.2% · Other 2.6%
- 2008→2024 swing
- -2.5pp toward R · 2008: 75.5pp · 2024: 73.0pp
- All cycles
- 2024: D+73.0 2020: D+76.6 2016: D+74.6 2012: D+76.4 2008: D+75.5
Not yet ingested
- Civics
- —
Market trends
- HPI YoY
- ▼ -463.14%
- Current HPI
- 292.3986
- Rent YoY
- ▲ 1.63%
- Metro
- Baltimore-Columbia-Towson, MD
- State GDP YoY
- ▲ 2.97%
- F500 in state
- 12
Industry mix (Fortune 500 HQ in MD)
| Industry | F500 HQs | Revenue |
|---|---|---|
| Aerospace / Defense | 1 | $71B |
|
||
| Utilities | 1 | $25B |
|
||
| Hotels | 1 | $24B |
|
||
| Consumer Goods | 1 | $7B |
|
||
| Real Estate | 1 | $6B |
|
||
| Chemicals | 1 | $2B |
|
||
Price history
+1087.5% since first listed17 events — show timeline
- 2026-05-27 Listed $475,000 BRIGHT MLS
- 2024-04-23 Rental Removed $1,015 APPFOLIO
- 2024-04-11 Listed for Rent $1,015 APPFOLIO
- 2024-04-10 Rental Removed $1,015 APPFOLIO
- 2024-03-13 Listed for Rent $1,015 APPFOLIO
- 2021-02-02 Listing Removed — BRIGHT MLS
- 2021-02-02 Listing Removed — BRIGHT MLS
- 2020-11-18 Listed $1,250,000 BRIGHT MLS
- 2020-11-18 Listed $1,250,000 BRIGHT MLS
- 2012-11-08 Sold (MLS) $35,000 BRIGHT MLS
- 2012-11-08 Sold (MLS) $35,000 MRIS
- 2012-11-08 Price Changed $40,000 MRIS
- 2012-10-05 Pending — MRIS
- 2012-10-05 Listing Removed — BRIGHT MLS
- 2012-09-27 Price Changed $59,000 MRIS
- 2012-08-09 Listed $99,000 MRIS
- 2012-08-09 Listed $40,000 BRIGHT MLS
Property tax history
+8.0%/yrLatest (2012): $3,986 · +0.1% YoY. Source: county tax records.
Cash-flow waterfall
monthlySold comps — $/sqft
last 12 mo · ≤1 miLoading sold comps…