 Triplex
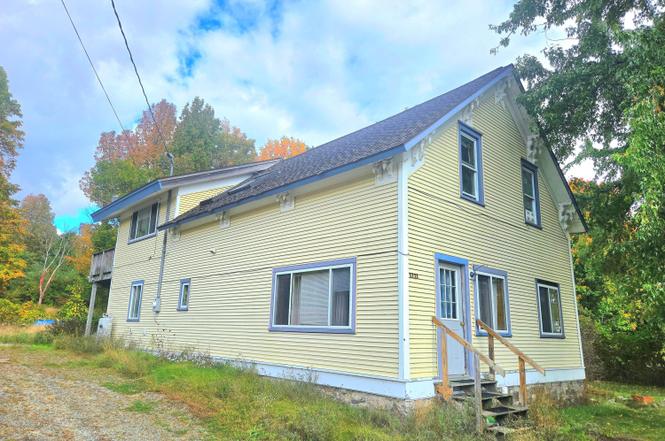
5727 Ny-86 · Wilmington, NY
Flood risk 6/10 · Moderate
- FEMA flood zone
- X
- Chance of flooding over 30 yrs
- 0.72%
- Est. flood insurance / yr
- $473 – $860
Fire risk 3/10 · Minor
- Est. fire insurance / yr
- $691 – $1,283
Heat risk 2/10 · Minimal
- Hot days now (above 90°F)
- 8 days/yr
- Hot days in 30 yrs
- 19 days/yr
Wind risk 1/10 · Minimal
- Chance of severe wind over 30 yrs
- 0.0%
Air-quality risk 2/10 · Minimal
- Unhealthy air days now
- 1 days/yr
- Unhealthy air days in 30 yrs
- 1 days/yr
Risk factors via First Street. Map © Google.
Why this score? — see what drove the B+ grade
The composite is a weighted blend of 9 inputs, each scored 0–100. Each bar is that input's sub-score; the figure is the points it added to the 100-point composite (weight × sub-score).
- Cash flow +30.0/30.0
- 1% rule +10.0/10.0
- DSCR +10.0/10.0
- Appreciation +7.8/10.0
- ARV discount +7.5/15.0
- Schools +4.5/10.0
- Livability +3.1/5.0
- Rent growth +2.5/5.0
- Condition / age +2.5/5.0
$149,900
🖨 Deal sheet 📄 Offer letter ✓ Due diligence
Multi-family units
County records classify this as Multi-Family (2-4 Unit). Listing-text estimate: 3 units. confirmed
Listing remarks
Welcome To 5727 NYS Route 86! Located Seconds Away From The West Branch Of The Ausable River, Heritage Park, And Bridge Park. This Parcel Features: - Unit 1: 2 Br 1 Bth. - Unit 2: 2 Br 1 Bth. - Unit 3: 3 Br 1 Bth. - Public Water. - Lake Placid School District. Property Needs Work. As Is. Owner Is Real Estate Agent.
Key facts
- Public water
- 0.84 acre lot
- 4 parking spots
Tags
Neighborhood map
What this means for you Summary
Snapshot
- This is a 3 × 2-bed/?-bath units multifamily listed at $150k.
Deal economics
- At list price, monthly cash flow is $4k ($43k/yr) — positive. Per door: $1k/mo.
- The deal already cash-flows at list — no discount required.
- Meets the 1% rule at list price ($6k rent vs $150k).
- Cap rate 35.2% vs local median 1.1% in Wilmington — top-decile yield for the area; either an underpriced asset or a hidden risk that comps aren't pricing in. Stress-test before assuming the spread holds.
Location & tenants
- Location reads 61/100 on livability (#935 in NY) — a middle-class / working-renter tenant base. Strengths: housing A, employment A-; Watch: crime D+, amenities F, commute F.
- Lake Placid Central School District (town): math 46% / reading 58% proficiency, ranked #344 of 590 in NY (top 58%) — acceptable for families but not a draw, mixed tenant base, ~2y average lease.
- Zoned schools: Lake Placid Elementary School (math 52% / reading 62%, grade C+, #842 of 2,108 statewide, top 43%, 244 students, 33% FRL); Lake Placid Junior-Senior High School (math 42% / reading 52%, grade D-, #1,007 of 1,100 statewide, top 93%, 294 students, 36% FRL).
- Market conditions: 39 active listings in the ZIP; 218 units permitted in Essex County in 2024 (63 in 5+ unit buildings).
Forward outlook
- In year one you build about $9k of equity ($1k loan paydown + $8k appreciation (5.6% local appreciation)).
- Essex County population projected at -20% by 2050 — secular population decline; favor cash flow + early exit over multi-decade hold.
- At projected returns (5.6% appreciation + 3.0% rent growth), your $42k cash investment doubles in ~1 year — after that, you're playing with house money.
- By year 4, paydown + projected appreciation supports a ~$32k cash-out refi (75% LTV) — recoverable capital for the next deal without selling this one.
Negotiation context
- Only 2 days on market — expect competitive offers; lowballing is unlikely to land.
Risks & watch-outs
- Watch-outs: built in 1910 — expect roof / HVAC / electrical / plumbing capex.
- Climate carrying-cost: major flood risk — expect insurance premiums to compound above CPI over the hold.
Questions for the listing agent
- Can we see the unit-by-unit rent roll, current vacancy, and any below-market leases? What's the average tenancy length?
- What capital expenditures (roof, boiler, parking lot, exteriors) have been made in the last 5 years, and what's planned in the next 2?
- Built in 1910 — when were the roof, HVAC, electrical panel, plumbing, and water heater last replaced?
- Is there a deadline driving the sale (1031 exchange, divorce, estate, relocation)? That informs how much negotiation room exists.
- Schools are F-rated, which usually means shorter tenancies and higher turnover. Who's the typical renter profile here, and what's been the actual vacancy rate?
- Crime grade is D in this area — have there been break-ins, vandalism, or insurance claims at this property in the last 3 years? What carrier currently insures it and at what premium?
- What's the average days-on-market for RENTAL listings here right now (not sales)? A rising rental-DOM trend means longer vacancies and softer asking-rent achievability than the comps imply.
- What's the recent tenant-quality profile in this submarket — average credit score on applications, eviction rate, late-payment / NSF rate, and stable-employment percentage? A property-management company in the area should have these aggregated.
- How much new apartment / multifamily construction is in the pipeline within 1–3 miles? Heavy new supply (>2% of stock underway) typically softens rents 12–24 months out; light construction supports rent growth.
Investment metrics
- 1% rule
- 3.92% ✓
- Cap rate
- 35.19%
- Cash-on-cash
- 103.21%
- DSCR
- 5.59
- GRM
- 2.1
CMA / ARV
No comps found within radius.
Projected returns pro-forma
5.62% appreciation · 3.0% rent growth · sell at horizon
- IRR
- —
- Equity multiple
- 7.43×
- Total profit
- $269,973
- Equity at exit
- $90,699
- IRR
- —
- Equity multiple
- 15.66×
- Total profit
- $615,208
- Equity at exit
- $161,512
Cash invested: $41,972 (down + closing). Projections, not guarantees.
Landlord ↔ Tenant lean methodology
- Overall (STATE)
- 15 Strongly Tenant-Friendly
- State New York
- 15 Strongly Tenant-Friendly · D+10
- County
- — inherits STATE
- City
- — inherits STATE
ZIP-level market 12997
- Home prices YoY
- 1.2%
- Active inventory
- 39
- Price-to-rent
- 6.4×
Monthly cashflow live
- Estimated rent
- $5,881 medium interval (Pro) →
- Mortgage (P&I)
- −$786
- Tax est. 1.5%
- −$187 /mo · $2,248/yr
- Insurance
- −$62
- HOA
- −$0
- Vacancy / Maint / Mgmt
- −$1,235
- Net cashflow
- $3,610
Break-even live
3-unit breakdown (identical units grouped — click to expand)
| Units | Beds | Baths | Est. rent |
|---|---|---|---|
| 3× units | 2 | — | $5,880 |
| #1 | 2 | — | $1,960 |
| #2 | 2 | — | $1,960 |
| #3 | 2 | — | $1,960 |
| Total (3 units) | $5,881 | ||
UW: 25.0% down · 7.5% · 30yr · 1.5% tax · 5.0% vac · 8.0% maint · 8.0% mgmt
Financing live
Cash to close
- Down payment
- $37,475
- Closing costs
- $4,497
- Reserves months
- —
- Total cash needed
- —
Loan-product check · same deal, 3 products live
Conventional
25% down · 7.5% · 30yr
- Down + closing
- —
- Monthly P&I
- —
- Monthly cashflow
- —
- DSCR
- —
- Eligible?
- —
Personal DTI + credit; lowest rate.
DSCR
20% down · 8.5% · 30yr
- Down + closing
- —
- Monthly P&I
- —
- Monthly cashflow
- —
- DSCR
- —
- Eligible?
- —
No personal income docs; deal must DSCR.
Hard money
10% down · 12.0% · 12mo
- Down + closing
- —
- Monthly P&I
- —
- Monthly cashflow
- —
- DSCR
- —
- Eligible?
- —
Short-term bridge; refi at stabilization.
Listing history 2 events
-
2025-09-29status Pending
-
2025-09-27$149,900 Active
ⓘ Source: listings_history table (triggers on properties + properties_extension) + one-shot
backfill from property_details.listing_events for pre-trigger history.
Climate risk First Street
- Flood 6/10 Major FEMA zone X · 72% chance over 30 yrs
- Wildfire 3/10 Moderate
- Heat 2/10 Low 8 d/yr ≥90°F today · 19 d/yr by 30 yrs out
- Wind 1/10 Low 0% chance of damaging wind over 30 yrs
- Air quality 2/10 Low 1 unhealthy d/yr today · 1 by 30 yrs out
Nearby sold comps map
Loading sold comps map…
Walkable amenities ~0.75 mi
Loading nearby amenities…
Taxation est. · year 1
- Rental income
- $70,572
- − Mortgage interest
- −$8,397
- − Property taxes
- −$2,248
- − Insurance
- −$750
- − Repairs & maintenance
- −$5,646
- − Management
- −$5,646
- − Depreciation
- −$4,361
- Taxable income
- $43,525
- Est. tax owed @ 24.0%
- −$10,446
- After-tax cash flow
- $32,875/yr
For passive investors: Depreciation is non-cash, so a rental often shows a tax loss while cash-flowing — sheltering income. Rental losses are passive: they offset passive income freely, and up to $25,000/yr can offset ordinary (W-2) income if you actively participate and your MAGI is under $100k (phasing out to $0 by $150k); unused losses carry forward. On sale, claimed depreciation is recaptured at up to 25%, and gains may owe capital-gains tax (a 1031 exchange can defer both). Figures are a year-1 estimate at your 24.0% rate — not tax advice; consult a CPA.
Schools (NCES district)
- District
- Lake Placid Central School District
- NCES district ID
- 3616500
- Math proficiency
- 46% ▼ -1.00%
- Reading proficiency
- 58% ▲ 13.00%
- Median HH income
- $52,508
- Composite
- 44.64/100
- National rank
- #2770
- State rank
- #344 of 590 in NY
Livability — Wilmington
- Score
- 61/100
- State rank
- #935
- US rank
- #18181
Category grades
Schools grade is shown separately in the Schools card above.
Census & demographics
- Census place
- Wilmington, NY
- Population (ZIP)
- 1,280
Population outlook (Essex County) Hauer SSP2
- Today (2025)
- 36,758 people
- By 2030
- 35,697 · -2.9%
- By 2040
- 32,697 · -11.0%
- By 2050
- 29,248 · -20.4%
- By 2075
- 22,641 · -38.4%
- By 2100
- 16,602 · -54.8%
Race, ethnicity, and origin ACS 2023
- Neighborhood character
- Predominantly White (97%)
- Race & ethnicity
- White 97% Two or more races 1%
- Common ancestry
- Lithuanian 10% Portuguese 7% Slovak 7%
- Foreign-born
- 3%
- Languages at home
- 98% English-only · Spanish 1%
Political lean MEDSL · Essex
- 2024 margin
- Toss-up / Even · D 50.2% · R 49.8%
- 2008→2024 swing
- -12.8pp toward R · 2008: 13.3pp · 2024: 0.5pp
- All cycles
- 2024: D+0.5 2020: D+5.0 2016: R+3.4 2012: D+15.0 2008: D+13.3
Not yet ingested
- Civics
- —
Market trends
- HPI YoY
- ▲ 5.62%
- Current HPI
- 489.2206
- Rent YoY
- —
- Metro
- —
- State GDP YoY
- ▲ 2.60%
- F500 in state
- 92
Industry mix (Fortune 500 HQ in NY)
| Industry | F500 HQs | Revenue |
|---|---|---|
| Financial Services | 10 | $950B |
|
||
| Consumer Goods | 9 | $162B |
|
||
| Insurance | 4 | $225B |
|
||
| Telecommunications | 2 | $144B |
|
||
| Pharmaceuticals | 2 | $112B |
|
||
| Media / Entertainment | 2 | $69B |
|
||
Price history
2 events — show timeline
- 2025-09-29 Pending — Global MLS
- 2025-09-27 Listed $149,900 Global MLS
Cash-flow waterfall
monthlySold comps — $/sqft
last 12 mo · ≤1 miLoading sold comps…