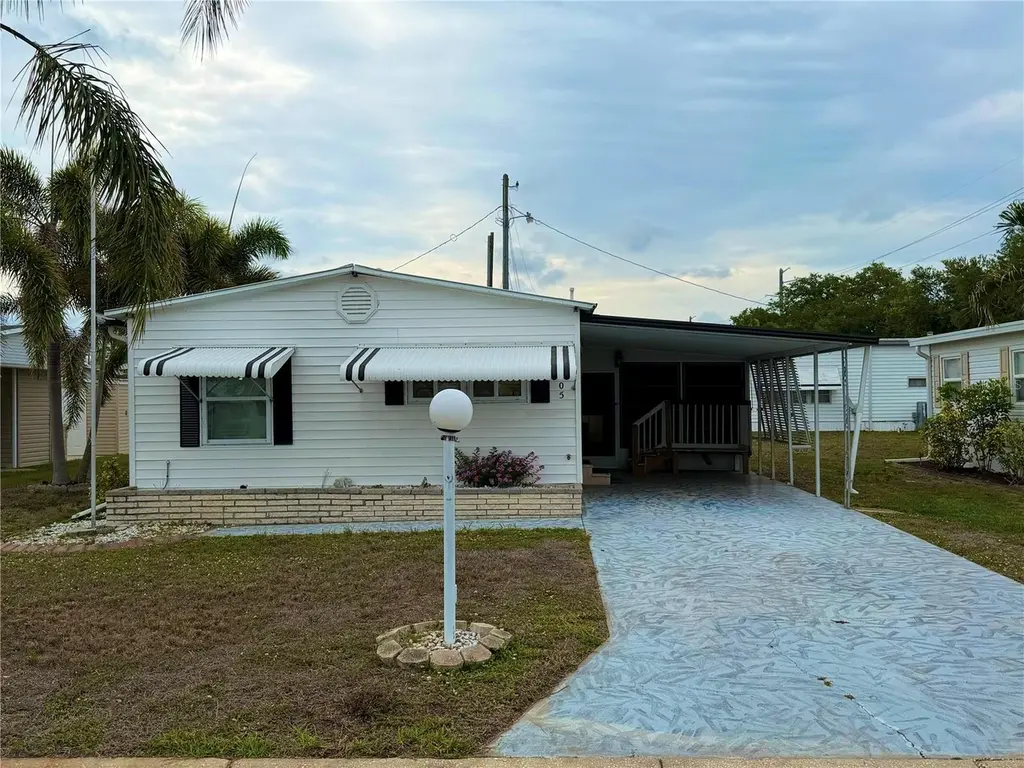
5205 5th St E · Bayshore Gardens, FL
Flood risk 1/10 · Minimal
- FEMA flood zone
- X (unshaded)
- Chance of flooding over 30 yrs
- 0.0%
- Est. flood insurance / yr
- $507 – $1,088
Fire risk 1/10 · Minimal
- Est. fire insurance / yr
- $947 – $1,759
Heat risk 10/10 · Severe
- Hot days now (above 107°F)
- 7 days/yr
- Hot days in 30 yrs
- 27 days/yr
Wind risk 10/10 · Severe
- Chance of severe wind over 30 yrs
- 99.0%
Air-quality risk 2/10 · Minimal
- Unhealthy air days now
- 1 days/yr
- Unhealthy air days in 30 yrs
- 2 days/yr
Risk factors via First Street. Map © Google.
Why this score? — see what drove the B- grade
The composite is a weighted blend of 9 inputs, each scored 0–100. Each bar is that input's sub-score; the figure is the points it added to the 100-point composite (weight × sub-score).
- Cash flow +28.2/30.0
- DSCR +10.0/10.0
- 1% rule +9.0/10.0
- ARV discount +4.6/15.0
- Schools +4.4/10.0
- Livability +4.1/5.0
- Condition / age +2.5/5.0
- Rent growth +2.3/5.0
- Appreciation +0.0/10.0
$110,000
🖨 Deal sheet (PDF) 📄 Offer letter ✓ Due diligence
Listing remarks
Welcome to this beautifully maintained, move-in-ready 2-bedroom, 2-bath mobile home 55+ offering comfort, convenience, and exceptional value in the heart of Bradenton. This charming residence features an open-concept floor plan, updated flooring, abundant natural light, and a spacious living area ideal for relaxing or entertaining. Situated on a generous lot that is owned, the property offers excellent outdoor living potential and is conveniently located near shopping, dining, medical facilities, golf courses, and Florida’s world-famous Gulf Coast beaches. Whether you’re searching for a full-time residence, seasonal retreat, or affordable Florida getaway, this home is a must-see
Key facts
- Generous lot
- Spacious living area
- Updated flooring
Tags
Property features AI
Finance
- Other: Lease restrictions apply
- Financial info: Total monthly fees $225 ($2,700 annual)
- HOA & community: Association required (Tracy) — $225/month; Association fee includes cable TV, internet, management, pool, recreational facilities, sewer, trash, water, and common area taxes; Amenities: clubhouse, fitness center, pool, shuffleboard, gated community, golf, association recreation (owned); Buyer approval required; Senior community; No pets allowed
Exterior
- Parking: Carport with 2 spaces
- Security: Gated community
- Utilities: Public water; Public sewer; Cable connected
- Home design: Residential mobile home (double wide); One story; Faces west; Homestead property
- Construction: Metal siding; Roof over; Crawlspace and slab foundation; Building area approx. 1,442 sq ft
- Exterior features: Screened side porch; Awnings; Exterior storage
Interior
- Kitchen: Range; Refrigerator
- Bedrooms: 2 bedrooms
- Flooring: Carpet; Laminate
- Bathrooms: 2 full bathrooms
- Heating & cooling: Central heating; Central air conditioning
- Interior features: Ceiling fans; Open floorplan; Kitchen/family room combo; Living room/dining room combo
- Laundry & utility: Laundry room; Laundry in garage
Neighborhood map
What this means for you Summary
Snapshot
- This is a 1-bed/1.0-bath manufactured listed at $110k.
Deal economics
- At list price, monthly cash flow is $348 ($4k/yr) — positive.
- The deal already cash-flows at list — no discount required.
- Meets the 1% rule at list price ($2k rent vs $110k).
- Cap rate 10.1% vs local median 4.7% in Bayshore Gardens — top-decile yield for the area; either an underpriced asset or a hidden risk that comps aren't pricing in. Stress-test before assuming the spread holds.
Location & tenants
- Location reads 82/100 on livability (#72 in FL, #1,180 nationally) — a professional / high-income tenant draw. Strengths: cost of living A+, housing A+, health & safety A+; Watch: crime C-, commute C-, employment F.
- Manatee (suburban): math 54% / reading 50% proficiency, ranked #26 of 73 in FL (top 36%) — acceptable for families but not a draw, mixed tenant base, ~2y average lease.
- Zoned schools: Oneco Elementary School (math 49% / reading 27%, grade F, #1,587 of 2,144 statewide, top 74%, 596 students, 79% FRL); W. D. Sugg Middle School (math 34% / reading 28%, grade F, #462 of 571 statewide, top 81%, 1,010 students, 72% FRL); Southeast High School (math 25% / reading 34%, grade F, #447 of 667 statewide, top 68%, 1,716 students, 66% FRL) — zoned schools average 72% FRL vs 51% district-wide (22 pts higher); higher-poverty schools than district average — tighter screening recommended.
- Zoned-school proficiency averages 33% at this address vs 52% district-wide (-19 pts) — the specific schools serving this property underperform the Manatee average; the district grade overstates school quality for this exact location.
- Market conditions: Rents soft (-1.0%/yr); 387 active listings in the ZIP; 26 comparable units currently listed for rent nearby; rentals at typical pace (median 26d on market — plan ~3-4 weeks tenant-placement turnaround); 7,472 units permitted in Manatee County in 2024 (1,782 in 5+ unit buildings).
Forward outlook
- Local home prices are declining (-3.0%/yr); year-one equity from $761 of loan paydown is wiped out by about $3k of value loss. Plan a longer hold.
- Manatee County population projected at +43% by 2050 — long-run rental-demand tailwind backs the buy-and-hold thesis.
Negotiation context
- Only 10 days on market — expect competitive offers; lowballing is unlikely to land.
- 4 sale attempts with the ask held roughly flat each time — persistent listings suggest the price (not the market) is what's stuck; bring a comps-based counter.
- Current owner paid $48k; list at $110k implies a 129% gain — meaningful room to come down on a strong offer.
Risks & watch-outs
- Climate carrying-cost: severe wind risk, 99% chance of damaging wind over 30y; extreme-heat days projected 7→27/yr by 2055 (HVAC capex compounding) — expect insurance premiums to compound above CPI over the hold.
Questions for the listing agent
- Built in 1963 — when were the roof, HVAC, electrical panel, plumbing, and water heater last replaced?
- What does the HOA fee cover, when was the last increase, and are there any pending special assessments or reserve-fund shortfalls?
- Is there a deadline driving the sale (1031 exchange, divorce, estate, relocation)? That informs how much negotiation room exists.
- Schools are F-rated, which usually means shorter tenancies and higher turnover. Who's the typical renter profile here, and what's been the actual vacancy rate?
- What's the average days-on-market for RENTAL listings here right now (not sales)? A rising rental-DOM trend means longer vacancies and softer asking-rent achievability than the comps imply.
- What's the recent tenant-quality profile in this submarket — average credit score on applications, eviction rate, late-payment / NSF rate, and stable-employment percentage? A property-management company in the area should have these aggregated.
- How much new for-sale + rental construction is in the pipeline within 1–3 miles? Heavy new supply typically softens prices + rents 12–24 months out; constrained supply supports both.
Investment metrics
- 1% rule
- 1.40% ✓
- Cap rate
- 10.09%
- Cash-on-cash
- 13.57%
- DSCR
- 1.60
- GRM
- 5.9
CMA / ARV
- ARV (on-the-fly)
- $103,320
- Comps found
- 12
Show comp detail 12 sales within ~0.75 mi
| Address | Dist | Beds/Ba | Sqft | Sold | Price | $/sf | Match |
|---|---|---|---|---|---|---|---|
| 403 52nd Avenue Plz W | 0.47mi | 2/1.0 (+1) | 846 (+1%) | 1mo | $75,000 | $89 | 72 |
| 808 53rd Ave E #67 | 0.27mi | 2/2.0 (+1) | 864 (+3%) | 5mo | $160,000 | $185 | 70 |
| 4904 4th A St E | 0.46mi | 2/2.0 (+1) | 840 (0%) | 1mo | $60,000 | $71 | 68 |
| 302 52nd Avenue Ter E | 0.13mi | 2/2.0 (+1) | 728 (-13%) | 1mo | $170,000 | $234 | 62 |
| 301 Brazil Ct #95 | 0.49mi | 2/1.5 (+1) | 792 (-6%) | 2mo | $66,000 | $83 | 59 |
| 511 50th Avenue Dr W | 0.66mi | 2/1.5 (+1) | 880 (+5%) | 2mo | $66,500 | $76 | 53 |
| 5530 Denmark Dr | 0.64mi | 2/2.0 (+1) | 864 (+3%) | 4mo | $70,000 | $81 | 52 |
| 808 53rd Ave E #22 | 0.33mi | 2/2.0 (+1) | 960 (+14%) | 2mo | $135,000 | $141 | 50 |
| 406 50th Ave W | 0.58mi | 2/1.5 (+1) | 928 (+10%) | 3mo | $128,900 | $139 | 46 |
| 719 50th Avenue Ter W | 0.75mi | 2/1.5 (+1) | 770 (-8%) | 3mo | $95,000 | $123 | 41 |
| 502 Bolivia Blvd | 0.53mi | 2/2.0 (+1) | 960 (+14%) | 2mo | $124,900 | $130 | 41 |
| 606 Cyprus Ct | 0.64mi | 2/1.5 (+1) | 960 (+14%) | 5mo | $85,000 | $89 | 35 |
Match score weights: distance 35% · size 25% · config 20% · recency 20%. Top-matched comps best support the ARV.
Projected returns pro-forma
-3.0% appreciation · 0.0% rent growth · sell at horizon
- IRR
- -0.1%
- Equity multiple
- 1.00×
- Total profit
- $-69
- Equity at exit
- $16,401
- IRR
- 5.9%
- Equity multiple
- 1.37×
- Total profit
- $11,394
- Equity at exit
- $9,511
Cash invested: $30,800 (down + closing). Projections, not guarantees.
Landlord ↔ Tenant lean methodology
- Overall (STATE)
- 87 Strongly Landlord-Friendly
- State Florida
- 87 Strongly Landlord-Friendly · R+3
- County
- — inherits STATE
- City
- — inherits STATE
ZIP-level market 34203
- Home prices YoY
- -24.5%
- Rents YoY
- -1.0%
- Active inventory
- 387
- Price-to-rent
- 5.9×
Monthly cashflow live
- Estimated rent
- $1,545 high interval (Pro) →
- Mortgage (P&I)
- −$577
- Tax from tax record
- −$24 /mo · $290/yr
- Insurance
- −$46
- HOA
- −$225
- Vacancy / Maint / Mgmt
- −$324
- Net cashflow
- $348
Break-even live
Sensitivity live
| Price | -10% $411 | -5% $380 | +0% $348 | +5% $317 | +10% $286 |
|---|---|---|---|---|---|
| Rent | -10% $226 | -5% $287 | +0% $348 | +5% $409 | +10% $470 |
| Rate | -1.0pp $404 | -0.5pp $376 | base $348 | +0.5pp $320 | +1.0pp $291 |
UW: 25.0% down · 7.5% · 30yr · 1.5% tax · 5.0% vac · 8.0% maint · 8.0% mgmt
Financing live
Cash to close
- Down payment
- $27,500
- Closing costs
- $3,300
- Reserves months
- —
- Total cash needed
- —
Loan-product check · same deal, 3 products live
Conventional
25% down · 7.5% · 30yr
- Down + closing
- —
- Monthly P&I
- —
- Monthly cashflow
- —
- DSCR
- —
- Eligible?
- —
Personal DTI + credit; lowest rate.
DSCR
20% down · 8.5% · 30yr
- Down + closing
- —
- Monthly P&I
- —
- Monthly cashflow
- —
- DSCR
- —
- Eligible?
- —
No personal income docs; deal must DSCR.
Hard money
10% down · 12.0% · 12mo
- Down + closing
- —
- Monthly P&I
- —
- Monthly cashflow
- —
- DSCR
- —
- Eligible?
- —
Short-term bridge; refi at stabilization.
Rent comps 26 comps
| Address | Beds | Baths | Sqft | Rent | $/sqft | DOM | Units | Dist |
|---|---|---|---|---|---|---|---|---|
| 110 52nd Avenue Ter E Bradenton, FL | 2.0 | 1.5 | 684 | $1,450 | $2.12 | 25d | 1 | 0.18mi |
| 205 52nd Avenue Dr W Bradenton, FL | 1.0 | 1.0 | 528 | $1,200 | $2.27 | 25d | 1 | 0.35mi |
| 4903 2nd B St E Bradenton, FL | 2.0 | 2.0 | 624 | $2,400 | $3.85 | 25d | 1 | 0.49mi |
| 608 51st Ave W Bradenton, FL | 2.0 | 1.5 | 760 | $2,200 | $2.89 | 25d | 1 | 0.64mi |
| 5580 Fountain Lake Cir Bradenton, FL | 1.0–3.0 | 1.0–2.0 | 1052 | $1,449 | $1.38 | 3d | 38 | 0.72mi |
| 5502 8th Street Ct W Bradenton, FL | 2.0 | 2.0 | 896 | $1,595 | $1.78 | 25d | 1 | 0.74mi |
| 4810 Ho Wil Ln Unit 4810 Bradenton, FL | 2.0 | 1.0 | 784 | $1,600 | $2.04 | 25d | 1 | 0.75mi |
| 707 50th Ave W Bradenton, FL | 2.0 | 1.0 | 730 | $1,150 | $1.58 | 25d | 1 | 0.75mi |
| 202 46th Avenue Ter W #409 Bradenton, FL | 2.0 | 2.0 | 1086 | $1,995 | $1.84 | 25d | 1 | 0.77mi |
| 203 46th Avenue Ter W Bradenton, FL | 1.0 | 1.0 | 880 | $1,099 | $1.25 | 5d | 1 | 0.79mi |
| 304 47th Avenue Dr W #112 Bradenton, FL | 1.0 | 1.0 | 725 | $1,200 | $1.66 | 25d | 1 | 0.79mi |
| 4630 5th St W Ste 6 Bradenton, FL | 2.0 | 1.0 | 1000 | $1,600 | $1.60 | 13d | 1 | 0.86mi |
| 915 50th Avenue Plz W Bradenton, FL | 2.0 | 1.0 | 700 | $1,200 | $1.71 | 25d | 1 | 0.86mi |
| 655 Park Cir Bradenton, FL | 1.0 | 1.5 | 816 | $1,100 | $1.35 | 25d | 1 | 0.88mi |
| 4507 3rd Street Cir W #280 Bradenton, FL | 1.0 | 1.0 | 660 | $1,300 | $1.97 | 17d | 1 | 0.90mi |
| 1345 301 Blvd E Bradenton, FL | 1.0–3.0 | 1.0–2.0 | 872 | $1,111 | $1.27 | 25d | 9 | 0.90mi |
| 5719 14th St E Bradenton, FL | 1.0 | 1.0 | 978 | $1,425 | $1.46 | 4d | 1 | 0.90mi |
| 1007 57th Ave W Bradenton, FL | 2.0 | 1.5 | 967 | $1,495 | $1.55 | 12d | 1 | 0.97mi |
| 3 Date Ave Bradenton, FL | 2.0 | 2.0 | 1000 | $1,495 | $1.50 | 25d | 1 | 1.18mi |
| 5531 16th St W Unit 5537 Bradenton, FL | 2.0 | 1.0 | 750 | $1,650 | $2.20 | 5d | 1 | 1.23mi |
| 3808 11th St E Bradenton, FL | 2.0 | 1.0 | 850 | $1,600 | $1.88 | 25d | 1 | 1.30mi |
| 5513 18th St W Bradenton, FL | 2.0 | 1.0 | 1000 | $1,499 | $1.50 | 25d | 1 | 1.33mi |
| 350 34th Avenue Dr E Bradenton, FL | 1.0–3.0 | 1.0–2.0 | 893 | $1,111 | $1.24 | 3d | 6 | 1.43mi |
| 5908 17th St W Unit C36 Bradenton, FL | 1.0 | 1.0 | 576 | $950 | $1.65 | 17d | 1 | 1.46mi |
| 1566 Pleasant Rd Unit J24 Bradenton, FL | 2.0 | 1.0 | 733 | $1,150 | $1.57 | 25d | 1 | 1.46mi |
| 1807 Restful Dr Unit N4 Bradenton, FL | 2.0 | 1.0 | 733 | $1,150 | $1.57 | 5d | 1 | 1.50mi |
HOA detail
- Monthly dues
- $225 · $2,700/yr
Listing history 8 events
-
2026-06-22days on market $110,000 Active 10 DOM
-
2026-06-18days on market $110,000 Active 7 DOM
-
2026-06-17days on market $110,000 Active 6 DOM
-
2026-06-16days on market $110,000 Active 5 DOM
-
2026-06-15days on market $110,000 Active 4 DOM
-
2026-06-13days on market $110,000 Active 2 DOM
-
2026-06-13remarks 687-char remark
-
2026-06-13$110,000 Active 1 DOM
ⓘ Source: listings_history table (triggers on properties + properties_extension) + one-shot
backfill from property_details.listing_events for pre-trigger history.
Tax reassessment forecast FL · Resets to sale price
- Current annual tax
- $290 · $24/mo
- Projected year-2 tax
- $913 · $76/mo
- Expected delta
- +$623/yr (+$52/mo · 214.8%)
ⓘ Screening estimate from a state-policy table — verify with the county assessor before closing.
Climate risk First Street
- Flood 1/10 Low FEMA zone X (unshaded) · 0% chance over 30 yrs
- Wildfire 1/10 Low
- Heat 10/10 Extreme 7 d/yr ≥107°F today · 27 d/yr by 30 yrs out
- Wind 10/10 Extreme 99% chance of damaging wind over 30 yrs
- Air quality 2/10 Low 1 unhealthy d/yr today · 2 by 30 yrs out
Nearby sold comps map
Loading sold comps map…
Walkable amenities ~0.75 mi
Loading nearby amenities…
Taxation est. · year 1
- Rental income
- $18,536
- − Mortgage interest
- −$6,162
- − Property taxes
- −$290
- − Insurance
- −$550
- − Repairs & maintenance
- −$1,483
- − Management
- −$1,483
- − HOA
- −$2,700
- − Depreciation
- −$3,200
- Taxable income
- $2,668
- Est. tax owed @ 24.0%
- −$640
- After-tax cash flow
- $3,541/yr
For passive investors: Depreciation is non-cash, so a rental often shows a tax loss while cash-flowing — sheltering income. Rental losses are passive: they offset passive income freely, and up to $25,000/yr can offset ordinary (W-2) income if you actively participate and your MAGI is under $100k (phasing out to $0 by $150k); unused losses carry forward. On sale, claimed depreciation is recaptured at up to 25%, and gains may owe capital-gains tax (a 1031 exchange can defer both). Figures are a year-1 estimate at your 24.0% rate — not tax advice; consult a CPA.
Schools (NCES district)
- District
- Manatee
- NCES district ID
- 1201230
- Math proficiency
- 54% ▼ -6.00%
- Reading proficiency
- 50% ▼ -2.00%
- Median HH income
- $49,607
- Composite
- 44.43/100
- National rank
- #2806
- State rank
- #26 of 73 in FL
Livability — Bayshore Gardens
- Score
- 82/100
- State rank
- #72
- US rank
- #1180
Category grades
Schools grade is shown separately in the Schools card above.
Census & demographics
- County
- Manatee County · 416,364 people
- City population
- 33,840
- Metro
- North Port-Sarasota-Bradenton, FL
- Population (ZIP)
- 40,618
- Household income
- $70,761
- Rent vs Own
- Severe rent burden
- 1469.0
Population outlook (Manatee County) Hauer SSP2
- Today (2025)
- 447,342 people
- By 2030
- 488,911 · +9.3%
- By 2040
- 567,934 · +27.0%
- By 2050
- 637,995 · +42.6%
- By 2075
- 781,970 · +74.8%
- By 2100
- 848,272 · +89.6%
Race, ethnicity, and origin ACS 2023
- Neighborhood character
- Predominantly White (65%)
- Race & ethnicity
- White 65% Hispanic / Latino 19% Two or more races 12% Black 9% Asian 5%
- Hispanic origin (detail)
- Mexican 9% Puerto Rican 3% Cuban 2% Dominican 1%
- Common ancestry
- Lithuanian 3% Romanian 3% Slovak 2%
- Foreign-born
- 17% · Canada, Vietnam, Dominican Republic
- Languages at home
- 76% English-only · Spanish 16% Vietnamese 2% Other Indo-European 1%
Political lean MEDSL · Manatee
- 2024 margin
- Strong R (+23.5) · D 37.9% · R 61.4%
- 2008→2024 swing
- -16.5pp toward R · 2008: -7.0pp · 2024: -23.5pp
- All cycles
- 2024: R+23.5 2020: R+16.1 2016: R+17.1 2012: R+12.5 2008: R+7.0
Not yet ingested
- Civics
- —
Market trends
- HPI YoY
- ▼ -95.87%
- Current HPI
- 295.8871
- Rent YoY
- ▼ -0.97%
- Metro
- North Port-Sarasota-Bradenton, FL
- State GDP YoY
- ▲ 3.28%
- F500 in state
- 36
Industry mix (Fortune 500 HQ in FL)
| Industry | F500 HQs | Revenue |
|---|---|---|
| Industrial Technology | 2 | $29B |
|
||
| Insurance | 2 | $17B |
|
||
| Retail | 1 | $60B |
|
||
| Technology Distribution | 1 | $58B |
|
||
| Homebuilding | 1 | $35B |
|
||
| Technology Manufacturing | 1 | $35B |
|
||
Price history
-99.2% since first listed15 events — show timeline
- 2026-06-06 Listed $110,000 Stellar MLS as Distributed by MLS Grid
- 2026-04-30 Listing Removed — Stellar MLS as Distributed by MLS Grid
- 2026-04-07 Price Changed $120,000 Stellar MLS as Distributed by MLS Grid
- 2026-02-05 Price Changed $125,000 Stellar MLS as Distributed by MLS Grid
- 2026-01-11 Listed $115,000 Stellar MLS as Distributed by MLS Grid
- 2025-10-30 Listing Removed — Stellar MLS as Distributed by MLS Grid
- 2025-05-20 Price Changed $115,000 Stellar MLS as Distributed by MLS Grid
- 2025-05-07 Relisted — Stellar MLS as Distributed by MLS Grid
- 2025-04-30 Listing Removed — Stellar MLS as Distributed by MLS Grid
- 2025-04-09 Price Changed $125,000 Stellar MLS as Distributed by MLS Grid
- 2025-01-31 Listed $129,900 Stellar MLS as Distributed by MLS Grid
- 2019-08-29 Sold (Public Records) $48,000 Public Records
- 2003-12-24 Sold (Public Records) $67,500 Public Records
- 1991-01-09 Sold (Public Records) $24,500 Public Records
- 1987-03-30 Sold (Public Records) $14,000,000 Public Records
Property tax history
+1.1%/yrLatest (2025): $290 · +10.9% YoY. Source: county tax records.
Cash-flow waterfall
monthlySold comps — $/sqft
last 12 mo · ≤1 miLoading sold comps…