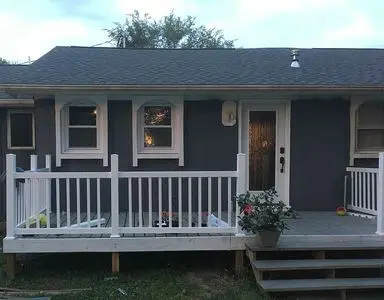
221 S Fayette St · Rich Hill, MO
Flood risk 1/10 · Minimal
- FEMA flood zone
- X (unshaded)
- Chance of flooding over 30 yrs
- 0.0%
- Est. flood insurance / yr
- $473 – $860
Fire risk 1/10 · Minimal
- Est. fire insurance / yr
- $1,054 – $1,958
Heat risk 4/10 · Minor
- Hot days now (above 109°F)
- 7 days/yr
- Hot days in 30 yrs
- 18 days/yr
Wind risk 2/10 · Minimal
- Chance of severe wind over 30 yrs
- 2.0%
Air-quality risk 2/10 · Minimal
- Unhealthy air days now
- 0 days/yr
- Unhealthy air days in 30 yrs
- 1 days/yr
Risk factors via First Street. Map © Google.
Why this score? — see what drove the D+ grade
The composite is a weighted blend of 9 inputs, each scored 0–100. Each bar is that input's sub-score; the figure is the points it added to the 100-point composite (weight × sub-score).
- Cash flow +15.4/30.0
- ARV discount +7.5/15.0
- DSCR +4.7/10.0
- Schools +4.2/10.0
- 1% rule +3.6/10.0
- Appreciation +3.6/10.0
- Livability +3.4/5.0
- Rent growth +2.5/5.0
- Condition / age +2.5/5.0
$120,000
🖨 Deal sheet 📄 Offer letter ✓ Due diligence
Listing remarks MLS
Lots of room here, to give everyone their space, and a chance to make your dreams come true! This spacious ranch is loaded with potential, just waiting for your ideas. Enjoy the shaded corner lot, and utilize the outbuilding to its full potential. Walk to City Parks and downtown. Sold as is. The home is built prior to 1978 and lead based paint potentially exists.
Key facts
- Built 1991
- Listed 36 days
Neighborhood map
What this means for you Summary
Snapshot
- This is a 2-bed/3.0-bath other listed at $120k.
Deal economics
- At list price, monthly cash flow is $46 ($551/yr) — positive.
- The deal already cash-flows at list — no discount required.
- To meet the 1% rule (rent ≥ 1% of price), the offer needs to be $103k (14.4% below list).
- Recommended offer: $103k (14.4% below list) — sets the bar for 1% rule.
Location & tenants
- Location reads 68/100 on livability (#173 in MO) — a middle-class / working-renter tenant base. Strengths: cost of living A+, housing A+, crime B+; Watch: schools D+, employment D, amenities F.
- Rich Hill R-IV (rural): math 45% / reading 50% proficiency, ranked #167 of 535 in MO (top 31%) — families likely to look elsewhere, expect single-tenant / working-renter base with shorter leases.
- Market conditions: 13 active listings in the ZIP; 2 units permitted in Bates County in 2024 (0 in 5+ unit buildings).
Forward outlook
- Local home prices are declining (-2.8%/yr); year-one equity from $830 of loan paydown is wiped out by about $3k of value loss. Plan a longer hold.
- Bates County population projected at -22% by 2050 — secular population decline; favor cash flow + early exit over multi-decade hold.
Negotiation context
- It's been on market 37 days — a 3% lower offer ($116k) is reasonable based on typical stale-listing flexibility.
- 2 sale attempts since 10y ago with the ask held roughly flat each time — persistent listings suggest the price (not the market) is what's stuck; bring a comps-based counter.
Questions for the listing agent
- It's been on market 37 days. Have you received any prior offers? Is the seller open to a 14% concession, seller financing, or rate buy-down credit?
- Is there a deadline driving the sale (1031 exchange, divorce, estate, relocation)? That informs how much negotiation room exists.
- Schools are D-rated, which usually means shorter tenancies and higher turnover. Who's the typical renter profile here, and what's been the actual vacancy rate?
- The area grade is low — what's the realistic commute time and amenity access for the typical tenant pool here? Any planned neighborhood developments (good or bad) we should know about?
- What's the average days-on-market for RENTAL listings here right now (not sales)? A rising rental-DOM trend means longer vacancies and softer asking-rent achievability than the comps imply.
- What's the recent tenant-quality profile in this submarket — average credit score on applications, eviction rate, late-payment / NSF rate, and stable-employment percentage? A property-management company in the area should have these aggregated.
- How much new for-sale + rental construction is in the pipeline within 1–3 miles? Heavy new supply typically softens prices + rents 12–24 months out; constrained supply supports both.
Investment metrics
- 1% rule
- 0.86% ✗
- Cap rate
- 6.75%
- Cash-on-cash
- 1.64%
- DSCR
- 1.07
- GRM
- 9.7
CMA / ARV
No comps found within radius.
Projected returns pro-forma
-2.78% appreciation · 3.0% rent growth · sell at horizon
- IRR
- -12.5%
- Equity multiple
- 0.54×
- Total profit
- $-15,425
- Equity at exit
- $19,081
- IRR
- -3.8%
- Equity multiple
- 0.74×
- Total profit
- $-8,802
- Equity at exit
- $12,429
Cash invested: $33,600 (down + closing). Projections, not guarantees.
Landlord ↔ Tenant lean methodology
- Overall (STATE)
- 81 Strongly Landlord-Friendly
- State Missouri
- 81 Strongly Landlord-Friendly · R+10
- County
- — inherits STATE
- City
- — inherits STATE
ZIP-level market 64779
- Home prices YoY
- -1.0%
- Active inventory
- 13
- Price-to-rent
- 9.7×
Monthly cashflow live
- Estimated rent
- $1,027 medium interval (Pro) →
- Mortgage (P&I)
- −$629
- Tax from tax record
- −$86 /mo · $1,034/yr
- Insurance
- −$50
- HOA
- −$0
- Vacancy / Maint / Mgmt
- −$216
- Net cashflow
- $46
Break-even live
UW: 25.0% down · 7.5% · 30yr · 1.5% tax · 5.0% vac · 8.0% maint · 8.0% mgmt
Financing live
Cash to close
- Down payment
- $30,000
- Closing costs
- $3,600
- Reserves months
- —
- Total cash needed
- —
Loan-product check · same deal, 3 products live
Conventional
25% down · 7.5% · 30yr
- Down + closing
- —
- Monthly P&I
- —
- Monthly cashflow
- —
- DSCR
- —
- Eligible?
- —
Personal DTI + credit; lowest rate.
DSCR
20% down · 8.5% · 30yr
- Down + closing
- —
- Monthly P&I
- —
- Monthly cashflow
- —
- DSCR
- —
- Eligible?
- —
No personal income docs; deal must DSCR.
Hard money
10% down · 12.0% · 12mo
- Down + closing
- —
- Monthly P&I
- —
- Monthly cashflow
- —
- DSCR
- —
- Eligible?
- —
Short-term bridge; refi at stabilization.
Listing history 18 events
-
2026-06-18days on market $120,000 Active 37 DOM
-
2026-06-17days on market $120,000 Active 36 DOM
-
2026-06-16days on market $120,000 Active 35 DOM
-
2026-06-15days on market $120,000 Active 34 DOM
-
2026-06-13days on market $120,000 Active 32 DOM
-
2026-06-12days on market $120,000 Active 31 DOM
-
2026-06-09days on market $120,000 Active 28 DOM
-
2026-06-08days on market $120,000 Active 27 DOM
-
2026-06-07days on market $120,000 Active 26 DOM
-
2026-06-07days on market $120,000 Active 25 DOM
-
2026-06-04days on market $120,000 Active 22 DOM
-
2026-06-02days on market $120,000 Active 21 DOM
-
2026-06-01days on market $120,000 Active 20 DOM
-
2026-05-31days on market $120,000 Active 19 DOM
-
2026-05-12$120,000 Active 184-char remark
-
2021-05-27soldstatus
-
2016-09-16soldstatus 365-char remark
Show marketing remark (365 chars)
Lots of room here, to give everyone their space, and a chance to make your dreams come true! This spacious ranch is loaded with potential, just waiting for your ideas. Enjoy the shaded corner lot, and utilize the outbuilding to its full potential. Walk to City Parks and downtown. Sold as is. The home is built prior to 1978 and lead based paint potentially exists.
-
2016-07-20$17,500 365-char remark
Show marketing remark (365 chars)
Lots of room here, to give everyone their space, and a chance to make your dreams come true! This spacious ranch is loaded with potential, just waiting for your ideas. Enjoy the shaded corner lot, and utilize the outbuilding to its full potential. Walk to City Parks and downtown. Sold as is. The home is built prior to 1978 and lead based paint potentially exists.
ⓘ Source: listings_history table (triggers on properties + properties_extension) + one-shot
backfill from property_details.listing_events for pre-trigger history.
Tax reassessment forecast MO · Resets to sale price
- Current annual tax
- $1,034 · $86/mo
- Projected year-2 tax
- $1,164 · $97/mo
- Expected delta
- +$130/yr (+$11/mo · 12.6%)
ⓘ Screening estimate from a state-policy table — verify with the county assessor before closing.
Climate risk First Street
- Flood 1/10 Low FEMA zone X (unshaded) · 0% chance over 30 yrs
- Wildfire 1/10 Low
- Heat 4/10 Moderate 7 d/yr ≥109°F today · 18 d/yr by 30 yrs out
- Wind 2/10 Low 2% chance of damaging wind over 30 yrs
- Air quality 2/10 Low 0 unhealthy d/yr today · 1 by 30 yrs out
Nearby sold comps map
Loading sold comps map…
Walkable amenities ~0.75 mi
Loading nearby amenities…
Taxation est. · year 1
- Rental income
- $12,325
- − Mortgage interest
- −$6,722
- − Property taxes
- −$1,034
- − Insurance
- −$600
- − Repairs & maintenance
- −$986
- − Management
- −$986
- − Depreciation
- −$3,491
- Taxable loss
- −$1,494
- Est. tax savings @ 24.0%
- +$358
- After-tax cash flow
- $910/yr
For passive investors: Depreciation is non-cash, so a rental often shows a tax loss while cash-flowing — sheltering income. Rental losses are passive: they offset passive income freely, and up to $25,000/yr can offset ordinary (W-2) income if you actively participate and your MAGI is under $100k (phasing out to $0 by $150k); unused losses carry forward. On sale, claimed depreciation is recaptured at up to 25%, and gains may owe capital-gains tax (a 1031 exchange can defer both). Figures are a year-1 estimate at your 24.0% rate — not tax advice; consult a CPA.
Schools (NCES district)
- District
- Rich Hill R-IV
- NCES district ID
- 2926310
- Math proficiency
- 45% ▬ 0.00%
- Reading proficiency
- 50% ▲ 5.00%
- Median HH income
- $38,686
- Composite
- 41.74/100
- National rank
- #7176
- State rank
- #167 of 535 in MO
Livability — Rich Hill
- Score
- 68/100
- State rank
- #173
- US rank
- #9210
Category grades
Schools grade is shown separately in the Schools card above.
Census & demographics
- Census place
- Rich Hill, MO
- Population (ZIP)
- 2,926
Population outlook (Bates County) Hauer SSP2
- Today (2025)
- 15,295 people
- By 2030
- 14,644 · -4.3%
- By 2040
- 13,282 · -13.2%
- By 2050
- 11,944 · -21.9%
- By 2075
- 9,442 · -38.3%
- By 2100
- 7,372 · -51.8%
Race, ethnicity, and origin ACS 2023
- Neighborhood character
- Predominantly White (96%)
- Race & ethnicity
- White 96% Two or more races 2% Hispanic / Latino 2%
- Common ancestry
- Italian 2% Lithuanian 1% Iranian 1%
- Foreign-born
- 0%
- Languages at home
- 81% English-only · German/W. Germanic 18% Spanish 1%
Political lean MEDSL · Bates
- 2024 margin
- Solid R (+61.6) · D 18.7% · R 80.4%
- 2008→2024 swing
- -42.8pp toward R · 2008: -18.9pp · 2024: -61.6pp
- All cycles
- 2024: R+61.6 2020: R+58.5 2016: R+54.6 2012: R+31.7 2008: R+18.9
Not yet ingested
- Civics
- —
Market trends
- HPI YoY
- ▼ -2.78%
- Current HPI
- 282.2175
- Rent YoY
- —
- Metro
- —
- State GDP YoY
- ▲ 1.84%
- F500 in state
- 20
Industry mix (Fortune 500 HQ in MO)
| Industry | F500 HQs | Revenue |
|---|---|---|
| Healthcare | 1 | $163B |
|
||
| Insurance | 1 | $21B |
|
||
| Industrial Technology | 1 | $17B |
|
||
| Retail | 1 | $16B |
|
||
| Industrial Distribution | 1 | $10B |
|
||
| Utilities | 1 | $9B |
|
||
Price history
+585.7% since first listed4 events — show timeline
- 2026-05-12 Listed $120,000 FSBO.com
- 2021-05-27 Sold (Public Records) — Public Records
- 2016-09-16 Sold (MLS) — Heartland MLS as Distributed by MLS Grid
- 2016-07-20 Listed $17,500 Heartland MLS as Distributed by MLS Grid
Property tax history
+1.5%/yrLatest (2025): $1,034 · +15.0% YoY. Source: county tax records.
Cash-flow waterfall
monthlySold comps — $/sqft
last 12 mo · ≤1 miLoading sold comps…