460 Braznell Concrete Rd · Redstone, PA
Flood risk 10/10 · Severe
- FEMA flood zone
- AE
- Chance of flooding over 30 yrs
- 0.99%
- Est. flood insurance / yr
- $2,026 – $9,024
Fire risk 1/10 · Minimal
- Est. fire insurance / yr
- $511 – $949
Heat risk 4/10 · Minor
- Hot days now (above 97°F)
- 7 days/yr
- Hot days in 30 yrs
- 19 days/yr
Wind risk 2/10 · Minimal
- Chance of severe wind over 30 yrs
- —
Air-quality risk 2/10 · Minimal
- Unhealthy air days now
- 1 days/yr
- Unhealthy air days in 30 yrs
- 2 days/yr
Risk factors via First Street. Map © Google.
Why this score? — see what drove the D+ grade
The composite is a weighted blend of 9 inputs, each scored 0–100. Each bar is that input's sub-score; the figure is the points it added to the 100-point composite (weight × sub-score).
- Cash flow +15.0/30.0
- ARV discount +7.5/15.0
- Appreciation +6.3/10.0
- 1% rule +5.0/10.0
- DSCR +5.0/10.0
- Rent growth +2.5/5.0
- Livability +2.5/5.0
- Condition / age +2.5/5.0
- Schools +2.1/10.0
$25,000
🖨 Deal sheet (PDF) 📄 Offer letter ✓ Due diligence
Listing remarks MLS
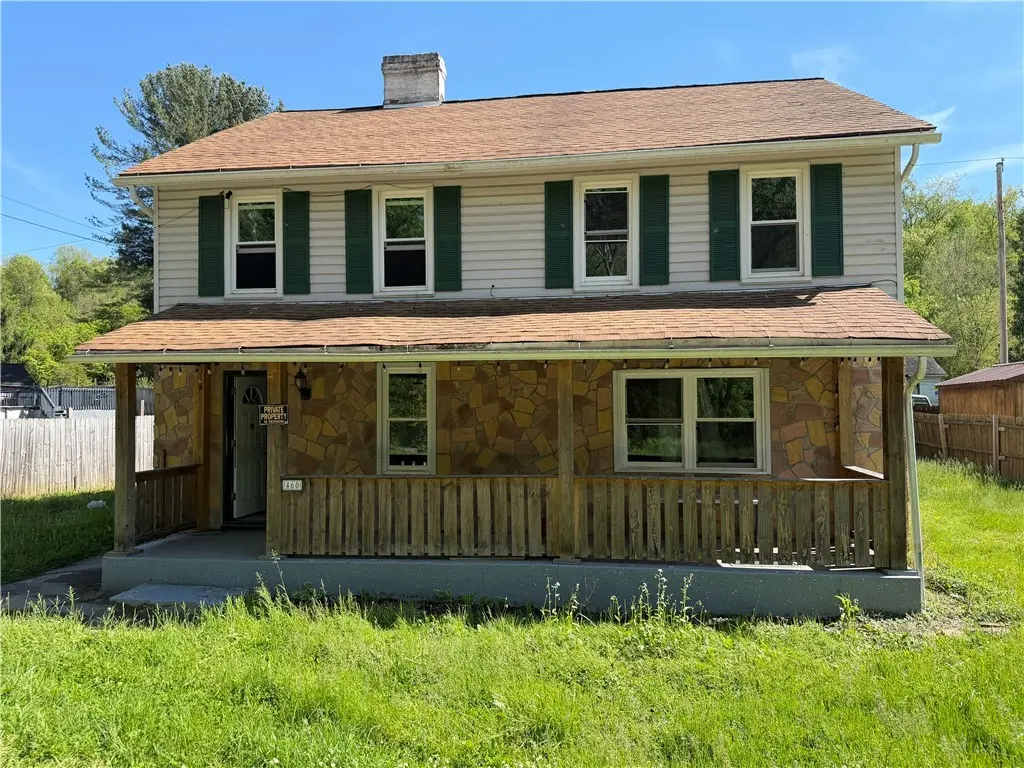
Larger two-story home. Front porch and a detached garage in the rear.
Key facts
- Covered front porch
- Spacious yard
- Large rear patio
Tags
Property features AI
Finance
- HOA & community: Public transportation nearby
Exterior
- Parking: Detached garage
- Utilities: Public water; Public sewer
- Home design: 2-story house
- Construction: Aluminum siding; Asphalt roof
- Exterior features: Public water; Public sewer
Interior
- Bathrooms: 2 full bathrooms
- Heating & cooling: Forced air heating (oil); Wall/window cooling units
- Interior features: Basement with walk-out access; Resale condition
Neighborhood map
What this means for you Summary
Snapshot
- This is a 4-bed/2.0-bath single-family listed at $25k.
Deal economics
- At list price, monthly cash flow is $631 ($8k/yr) — positive.
- The deal already cash-flows at list — no discount required.
- Meets the 1% rule at list price ($2k rent vs $25k).
- Recommended offer: $24k (3.0% below list) — sets the bar for market timing.
Location & tenants
- Location reads: area grade D — affects rentability + tenant quality, not the cash-flow math above.
- Brownsville Area SD (rural): math 17% / reading 34% proficiency, ranked #472 of 539 in PA (top 88%) — low school quality limits family demand, transient renter base, plan for 1-2y turnover.
- Zoned schools: Brownsville Area El Sch (math 16% / reading 37%, grade F, #1,169 of 1,518 statewide, top 77%, 700 students, 100% FRL); Brownsville Area Ms (math 7% / reading 32%, grade F, #444 of 512 statewide, top 87%, 352 students, 100% FRL); Brownsville Area Hs (math 64% / reading 24%, grade F, #196 of 437 statewide, top 47%, 434 students, 77% FRL) — zoned schools average 92% FRL vs 59% district-wide (33 pts higher); higher-poverty schools than district average — tighter screening recommended.
- Market conditions: 7 active listings in the ZIP; 1 comparable units currently listed for rent nearby; 201 units permitted in Fayette County in 2024 (10 in 5+ unit buildings).
Forward outlook
- In year one you build about $819 of equity ($173 loan paydown + $646 appreciation (2.6% local appreciation)).
- Fayette County population projected at -19% by 2050 — secular population decline; favor cash flow + early exit over multi-decade hold.
- At projected returns (2.6% appreciation + 3.0% rent growth), your $7k cash investment doubles in ~1 year — after that, you're playing with house money.
Negotiation context
- It's been on market 39 days — a 3% lower offer ($24k) is reasonable based on typical stale-listing flexibility.
- 6 sale attempts since 14y ago; this cycle's ask has dropped $10k (29%) from the opening price — seller is motivated, your offer sets the floor, not the list.
- Current owner paid $6k; list at $25k implies a 335% gain — meaningful room to come down on a strong offer.
Risks & watch-outs
- Watch-outs: flood insurance adds $460/mo; built in 1900 — expect roof / HVAC / electrical / plumbing capex.
- Climate carrying-cost: in FEMA flood zone AE (mandatory federal flood insurance) — expect insurance premiums to compound above CPI over the hold.
Questions for the listing agent
- It's been on market 39 days. Have you received any prior offers? Is the seller open to a 3% concession, seller financing, or rate buy-down credit?
- Built in 1900 — when were the roof, HVAC, electrical panel, plumbing, and water heater last replaced?
- What's the actual annual flood-insurance premium (NFIP or private), and is the property in a SFHA with mandatory coverage?
- Is there a deadline driving the sale (1031 exchange, divorce, estate, relocation)? That informs how much negotiation room exists.
- The area grade is low — what's the realistic commute time and amenity access for the typical tenant pool here? Any planned neighborhood developments (good or bad) we should know about?
- What's the average days-on-market for RENTAL listings here right now (not sales)? A rising rental-DOM trend means longer vacancies and softer asking-rent achievability than the comps imply.
- What's the recent tenant-quality profile in this submarket — average credit score on applications, eviction rate, late-payment / NSF rate, and stable-employment percentage? A property-management company in the area should have these aggregated.
- How much new for-sale + rental construction is in the pipeline within 1–3 miles? Heavy new supply typically softens prices + rents 12–24 months out; constrained supply supports both.
Investment metrics
- 1% rule
- 6.40% ✓
- Cap rate
- 58.67%
- Cash-on-cash
- 187.07%
- DSCR
- 9.32
- GRM
- 1.3
CMA / ARV
- ARV (median comp)
- $164,903
- List price
- $25,000
- Delta
- -84.84%
- Verdict
- UNDERPRICED
- Comps
- 4 within 2.0 mi
Projected returns pro-forma
2.58% appreciation · 3.0% rent growth · sell at horizon
- IRR
- —
- Equity multiple
- 7.14×
- Total profit
- $42,949
- Equity at exit
- $10,659
- IRR
- —
- Equity multiple
- 14.96×
- Total profit
- $97,704
- Equity at exit
- $15,988
Cash invested: $7,000 (down + closing). Projections, not guarantees.
Landlord ↔ Tenant lean methodology
- Overall (STATE)
- 62 Landlord-Friendly
- State Pennsylvania
- 62 Landlord-Friendly · EVEN
- County
- — inherits STATE
- City
- — inherits STATE
ZIP-level market 15442
- Home prices YoY
- 1.8%
- Active inventory
- 7
- Price-to-rent
- 1.3×
Monthly cashflow live
- Estimated rent
- $1,600 medium interval (Pro) →
- Mortgage (P&I)
- −$131
- Tax est. 1.5%
- −$31 /mo · $375/yr
- Insurance
- −$10
- Flood insurance flood zone
- −$460 /mo · $5,525/yr
- HOA
- −$0
- Vacancy / Maint / Mgmt
- −$336
- Net cashflow
- $631
Break-even live
Sensitivity live
| Price | -10% $648 | -5% $639 | +0% $631 | +5% $622 | +10% $614 |
|---|---|---|---|---|---|
| Rent | -10% $504 | -5% $568 | +0% $631 | +5% $694 | +10% $757 |
| Rate | -1.0pp $643 | -0.5pp $637 | base $631 | +0.5pp $624 | +1.0pp $618 |
UW: 25.0% down · 7.5% · 30yr · 1.5% tax · 5.0% vac · 8.0% maint · 8.0% mgmt
Financing live
Cash to close
- Down payment
- $6,250
- Closing costs
- $750
- Reserves months
- —
- Total cash needed
- —
Loan-product check · same deal, 3 products live
Conventional
25% down · 7.5% · 30yr
- Down + closing
- —
- Monthly P&I
- —
- Monthly cashflow
- —
- DSCR
- —
- Eligible?
- —
Personal DTI + credit; lowest rate.
DSCR
20% down · 8.5% · 30yr
- Down + closing
- —
- Monthly P&I
- —
- Monthly cashflow
- —
- DSCR
- —
- Eligible?
- —
No personal income docs; deal must DSCR.
Hard money
10% down · 12.0% · 12mo
- Down + closing
- —
- Monthly P&I
- —
- Monthly cashflow
- —
- DSCR
- —
- Eligible?
- —
Short-term bridge; refi at stabilization.
Rent comps 1 comps
| Address | Beds | Baths | Sqft | Rent | $/sqft | DOM | Units | Dist |
|---|---|---|---|---|---|---|---|---|
| 130 E 1st St Grindstone, PA | 4.0 | 1.0 | 1948 | $1,600 | $0.82 | 45d | 1 | 1.33mi |
Listing history 28 events
-
2026-06-21days on market $25,000 Active 39 DOM
-
2026-06-21days on market $25,000 Active 38 DOM
-
2026-06-18days on market $25,000 Active 36 DOM
-
2026-06-17days on market $25,000 Active 35 DOM
-
2026-06-16days on market $25,000 Active 34 DOM
-
2026-06-15days on market $25,000 Active 33 DOM
-
2026-06-13days on market $25,000 Active 31 DOM
-
2026-06-12days on market $25,000 Active 30 DOM
-
2026-06-09days on market $25,000 Active 27 DOM
-
2026-06-08days on market $25,000 Active 26 DOM
-
2026-06-08days on market $25,000 Active 25 DOM
-
2026-06-04pricedays on market $25,000 Active 21 DOM
-
2026-06-02days on market $30,000 Active 20 DOM
-
2026-06-01days on market $30,000 Active 19 DOM
-
2026-05-31days on market $30,000 Active 18 DOM
-
2026-05-13$35,000 Active 495-char remark
-
2023-06-07soldstatus $5,750 Closed 69-char remark
Show marketing remark (69 chars)
Larger two-story home. Front porch and a detached garage in the rear.
-
2023-05-04status Pending 69-char remark
Show marketing remark (69 chars)
Larger two-story home. Front porch and a detached garage in the rear.
-
2023-04-06status Active 69-char remark
Show marketing remark (69 chars)
Larger two-story home. Front porch and a detached garage in the rear.
-
2023-04-06price $11,500 69-char remark
Show marketing remark (69 chars)
Larger two-story home. Front porch and a detached garage in the rear.
-
2023-03-01status Active 69-char remark
Show marketing remark (69 chars)
Larger two-story home. Front porch and a detached garage in the rear.
-
2023-02-14status Pending 69-char remark
Show marketing remark (69 chars)
Larger two-story home. Front porch and a detached garage in the rear.
-
2022-11-15status Active 69-char remark
Show marketing remark (69 chars)
Larger two-story home. Front porch and a detached garage in the rear.
-
2022-11-15price $14,900 69-char remark
Show marketing remark (69 chars)
Larger two-story home. Front porch and a detached garage in the rear.
-
2022-11-07historical 69-char remark
Show marketing remark (69 chars)
Larger two-story home. Front porch and a detached garage in the rear.
-
2022-07-19$26,500 Active 69-char remark
Show marketing remark (69 chars)
Larger two-story home. Front porch and a detached garage in the rear.
-
2013-07-29historical
Show marketing remark (294 chars)
Get the charm & space of an older home with all the updates of a newer home! Range & microwave as well as new flooring in kitchen, washer & dryer, updated windows, doors & siding, concrete porches, all window treatments included! Nice landscping complete with fish pond!
-
2012-07-29$79,900
Show marketing remark (294 chars)
Get the charm & space of an older home with all the updates of a newer home! Range & microwave as well as new flooring in kitchen, washer & dryer, updated windows, doors & siding, concrete porches, all window treatments included! Nice landscping complete with fish pond!
ⓘ Source: listings_history table (triggers on properties + properties_extension) + one-shot
backfill from property_details.listing_events for pre-trigger history.
Climate risk First Street
- Flood 10/10 Extreme FEMA zone AE · 99% chance over 30 yrs
- Wildfire 1/10 Low
- Heat 4/10 Moderate 7 d/yr ≥97°F today · 19 d/yr by 30 yrs out
- Wind 2/10 Low
- Air quality 2/10 Low 1 unhealthy d/yr today · 2 by 30 yrs out
Nearby sold comps map
Loading sold comps map…
Walkable amenities ~0.75 mi
Loading nearby amenities…
Taxation est. · year 1
- Rental income
- $19,200
- − Mortgage interest
- −$1,400
- − Property taxes
- −$375
- − Insurance
- −$5,650
- − Repairs & maintenance
- −$1,536
- − Management
- −$1,536
- − Depreciation
- −$727
- Taxable income
- $7,975
- Est. tax owed @ 24.0%
- −$1,914
- After-tax cash flow
- $5,656/yr
For passive investors: Depreciation is non-cash, so a rental often shows a tax loss while cash-flowing — sheltering income. Rental losses are passive: they offset passive income freely, and up to $25,000/yr can offset ordinary (W-2) income if you actively participate and your MAGI is under $100k (phasing out to $0 by $150k); unused losses carry forward. On sale, claimed depreciation is recaptured at up to 25%, and gains may owe capital-gains tax (a 1031 exchange can defer both). Figures are a year-1 estimate at your 24.0% rate — not tax advice; consult a CPA.
Schools (NCES district)
- District
- Brownsville Area SD
- NCES district ID
- 4204080
- Math proficiency
- 17% ▼ -3.00%
- Reading proficiency
- 34% ▼ -5.00%
- Median HH income
- $34,500
- Composite
- 20.93/100
- National rank
- #8481
- State rank
- #472 of 539 in PA
Livability — Redstone
No livability data for this city. (Only ~50 U.S. cities are tracked.)
Census & demographics
- Population (ZIP)
- 2,521
Population outlook (Fayette County) Hauer SSP2
- Today (2025)
- 127,561 people
- By 2030
- 123,206 · -3.4%
- By 2040
- 113,232 · -11.2%
- By 2050
- 103,468 · -18.9%
- By 2075
- 83,185 · -34.8%
- By 2100
- 62,384 · -51.1%
Race, ethnicity, and origin ACS 2023
- Neighborhood character
- Predominantly White (95%)
- Race & ethnicity
- White 95% Two or more races 4%
- Common ancestry
- Romanian 8% Italian 1% Lithuanian 1%
- Foreign-born
- 0% · South Korea
- Languages at home
- 99% English-only · Other Indo-European 0%
Political lean MEDSL · Fayette
- 2024 margin
- Solid R (+37.9) · D 30.8% · R 68.7%
- 2008→2024 swing
- -37.5pp toward R · 2008: -0.4pp · 2024: -37.9pp
- All cycles
- 2024: R+37.9 2020: R+33.5 2016: R+31.0 2012: R+8.3 2008: R+0.4
Not yet ingested
- Civics
- —
Market trends
- HPI YoY
- ▲ 2.58%
- Current HPI
- 143.1025
- Rent YoY
- —
- Metro
- —
- State GDP YoY
- ▲ 1.68%
- F500 in state
- 34
Industry mix (Fortune 500 HQ in PA)
| Industry | F500 HQs | Revenue |
|---|---|---|
| Healthcare | 2 | $309B |
|
||
| Insurance | 2 | $27B |
|
||
| Telecommunications / Media | 1 | $124B |
|
||
| Industrial Distribution | 1 | $22B |
|
||
| Financial Services | 1 | $20B |
|
||
| Chemicals / Materials | 1 | $18B |
|
||
Price history
-68.7% since first listed15 events — show timeline
- 2026-06-03 Price Changed $25,000 West Penn MLS
- 2026-05-27 Price Changed $30,000 West Penn MLS
- 2026-05-13 Listed $35,000 West Penn MLS
- 2023-06-07 Sold (MLS) $5,750 West Penn MLS
- 2023-05-04 Pending — West Penn MLS
- 2023-04-06 Relisted — West Penn MLS
- 2023-04-06 Price Changed $11,500 West Penn MLS
- 2023-03-01 Relisted — West Penn MLS
- 2023-02-14 Pending — West Penn MLS
- 2022-11-15 Relisted — West Penn MLS
- 2022-11-15 Price Changed $14,900 West Penn MLS
- 2022-11-07 Delisted — West Penn MLS
- 2022-07-19 Listed $26,500 West Penn MLS
- 2013-07-29 Delisted — West Penn MLS
- 2012-07-29 Listed $79,900 West Penn MLS
Property tax history
+2.6%/yrLatest (2026): $1,738 · +0.0% YoY. Source: county tax records.
Cash-flow waterfall
monthlySold comps — $/sqft
last 12 mo · ≤1 miLoading sold comps…