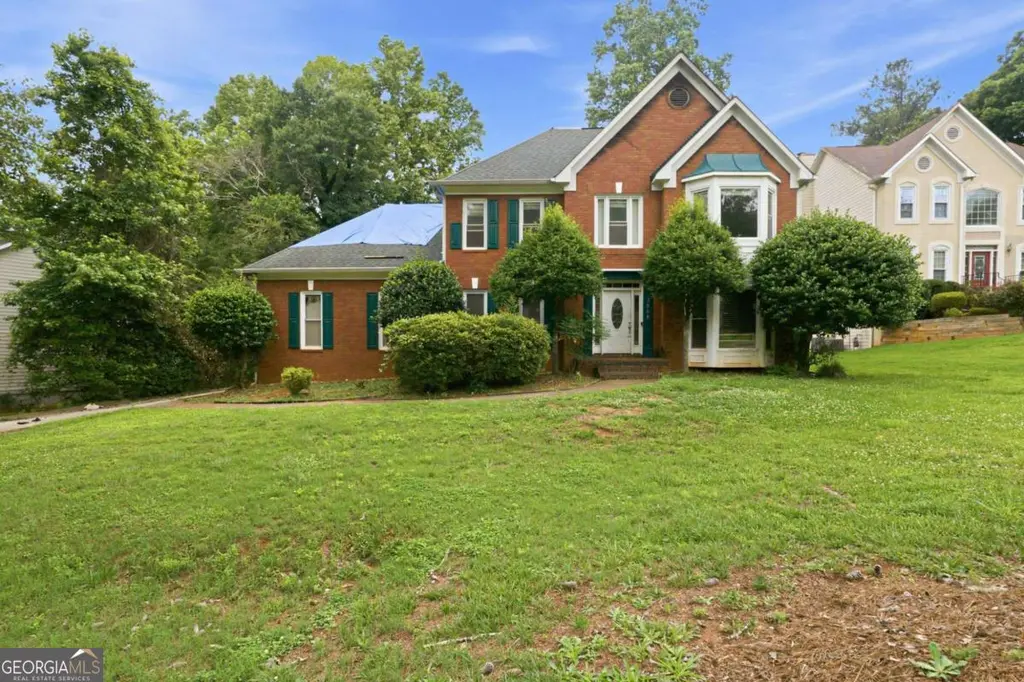
3888 Brookgreen Pt · Stonecrest, GA
Flood risk 1/10 · Minimal
- FEMA flood zone
- X (unshaded)
- Chance of flooding over 30 yrs
- 0.0%
- Est. flood insurance / yr
- $507 – $1,088
Fire risk 2/10 · Minimal
- Est. fire insurance / yr
- $963 – $1,789
Heat risk 6/10 · Moderate
- Hot days now (above 105°F)
- 7 days/yr
- Hot days in 30 yrs
- 18 days/yr
Wind risk 6/10 · Moderate
- Chance of severe wind over 30 yrs
- 27.0%
Air-quality risk 5/10 · Moderate
- Unhealthy air days now
- 7 days/yr
- Unhealthy air days in 30 yrs
- 10 days/yr
Risk factors via First Street. Map © Google.
Why this score? — see what drove the C grade
The composite is a weighted blend of 9 inputs, each scored 0–100. Each bar is that input's sub-score; the figure is the points it added to the 100-point composite (weight × sub-score).
- Cash flow +23.5/30.0
- 1% rule +8.0/10.0
- DSCR +7.5/10.0
- ARV discount +7.5/15.0
- Rent growth +3.0/5.0
- Livability +2.5/5.0
- Condition / age +2.5/5.0
- Schools +2.1/10.0
- Appreciation +0.0/10.0
$179,000
🖨 Deal sheet (PDF) 📄 Offer letter ✓ Due diligence
Listing remarks MLS
Attention investors, renovators, and project seekers! 3888 Brookgreen Pt offers a prime opportunity to transform a property in an established Decatur neighborhood. This home is ready for updates and repairs, providing the perfect canvas for a renovation project, fix-and-flip, rental investment, or value-add opportunity. The traditional floor plan includes a spacious living area, kitchen, and generously sized bedrooms, with significant potential to reimagine and modernize the space. Conveniently located near schools, shopping, dining, and major commuter routes, this property combines location with upside potential. Sold as-is. Bring your contractor, vision, and creativity to unlock the possibilities.
Key facts
- Conveniently located
- 0.36 acre lot
- 3 garage spots
Tags
Property features AI
Finance
- HOA & community: Homeowners association with an $800 annual fee
Exterior
- Parking: Attached garage with 3 garage spaces; Driveway parking; Open parking available
- Utilities: Central air for cooling; Water: other; Electric: other; Sewer: other; Other utilities listed
- Home design: Two-story home; Brick construction; Composition roof; Slab foundation; Resale property
- Construction: Brick exterior; Composition (shingle) roof; Slab foundation
- Exterior features: Located in a cul-de-sac; Asphalt road frontage on a city street
Interior
- Kitchen: Eat-in kitchen with stained cabinets; Solid surface countertops; Open view to family room; Dishwasher; Gas range; Microwave; Refrigerator
- Bedrooms: Four bedrooms on the upper level; Primary suite includes a sitting room
- Flooring: Hardwood floors
- Bathrooms: Two full bathrooms; One half bathroom; Upper-level full bathrooms include double vanity
- Heating & cooling: Central air conditioning; Other type of heating system
- Interior features: Built-in bookcases; Disappearing attic stairs; Double vanity in bathrooms; High 9-foot ceilings on main level; Walk-in closets; Finished basement; One fireplace located in the family room
- Laundry & utility: Laundry on the upper level
Neighborhood map
What this means for you Summary
Snapshot
- This is a 4-bed/2.5-bath single-family listed at $179k.
Deal economics
- At list price, monthly cash flow is $333 ($4k/yr) — positive.
- The deal already cash-flows at list — no discount required.
- Meets the 1% rule at list price ($2k rent vs $179k).
- Cap rate 8.5% vs local median 5.1% in Stonecrest — top-decile yield for the area; either an underpriced asset or a hidden risk that comps aren't pricing in. Stress-test before assuming the spread holds.
Location & tenants
- Location reads: area grade C — affects rentability + tenant quality, not the cash-flow math above.
- Dekalb County (suburban): math 19% / reading 28% proficiency, ranked #125 of 174 in GA (top 72%) — low school quality limits family demand, transient renter base, plan for 1-2y turnover; 68% free/reduced lunch — lower-income household profile, screen leases tightly.
- Zoned schools: Narvie Harris Elementary School (math 24% / reading 34%, grade F, #633 of 1,228 statewide, top 54%, 603 students, 100% FRL); Southwest Dekalb High School (math 17% / reading 37%, grade F, #162 of 424 statewide, top 40%, 1,307 students, 100% FRL) — zoned schools average 100% FRL vs 68% district-wide (32 pts higher); higher-poverty schools than district average — tighter screening recommended.
- Market conditions: Rents rising (+2.2%/yr); 355 active listings in the ZIP; 15 comparable units currently listed for rent nearby; rentals at typical pace (median 26d on market — plan ~3-4 weeks tenant-placement turnaround); 40% of comp listings sitting > 30 days — soft ceiling on asking rent; 1,240 units permitted in DeKalb County in 2024 (385 in 5+ unit buildings).
- This rent runs 44% of the median local income ($64k/yr) — at the standard rent-burdened threshold; future hikes will face affordability resistance.
Forward outlook
- Local home prices are declining (-3.0%/yr); year-one equity from $1k of loan paydown is wiped out by about $5k of value loss. Plan a longer hold.
- DeKalb County population projected at +28% by 2050 — long-run rental-demand tailwind backs the buy-and-hold thesis.
Negotiation context
- Only 6 days on market — expect competitive offers; lowballing is unlikely to land.
- 3 sale attempts with the ask held roughly flat each time — persistent listings suggest the price (not the market) is what's stuck; bring a comps-based counter.
Risks & watch-outs
- Watch-outs: property tax is 2.9% of price.
- Climate carrying-cost: major wind risk, 27% chance of damaging wind over 30y; extreme-heat days projected 7→18/yr by 2055 (HVAC capex compounding) — expect insurance premiums to compound above CPI over the hold.
Questions for the listing agent
- Property tax is high relative to price — has the assessment been appealed recently, and will the sale trigger a re-assessment?
- What does the HOA fee cover, when was the last increase, and are there any pending special assessments or reserve-fund shortfalls?
- Is there a deadline driving the sale (1031 exchange, divorce, estate, relocation)? That informs how much negotiation room exists.
- What's the average days-on-market for RENTAL listings here right now (not sales)? A rising rental-DOM trend means longer vacancies and softer asking-rent achievability than the comps imply.
- What's the recent tenant-quality profile in this submarket — average credit score on applications, eviction rate, late-payment / NSF rate, and stable-employment percentage? A property-management company in the area should have these aggregated.
- How much new for-sale + rental construction is in the pipeline within 1–3 miles? Heavy new supply typically softens prices + rents 12–24 months out; constrained supply supports both.
Investment metrics
- 1% rule
- 1.30% ✓
- Cap rate
- 8.52%
- Cash-on-cash
- 7.97%
- DSCR
- 1.35
- GRM
- 6.4
CMA / ARV
- ARV (on-the-fly)
- $361,284
- Comps found
- 12
Show comp detail 12 sales within ~0.75 mi
| Address | Dist | Beds/Ba | Sqft | Sold | Price | $/sf | Match |
|---|---|---|---|---|---|---|---|
| 3870 Brookgreen Pt | 0.04mi | 5/2.5 (+1) | 2,834 (+4%) | 1mo | $415,000 | $146 | 86 |
| 3878 Brookside Pkwy | 0.07mi | 4/2.5 | 2,588 (-5%) | 5mo | $415,000 | $160 | 83 |
| 4062 Brookside Pkwy | 0.22mi | 4/2.5 | 2,865 (+5%) | 5mo | $390,000 | $136 | 77 |
| 3664 Hofstra Ct | 0.39mi | 4/2.5 | 2,816 (+3%) | 3mo | $272,500 | $97 | 75 |
| 3627 Seton Hall Way | 0.62mi | 4/2.5 | 2,737 (0%) | 2mo | $238,000 | $87 | 69 |
| 3697 Mortons Landing Dr | 0.50mi | 5/3.5 (+1) | 2,770 (+1%) | 1mo | $364,900 | $132 | 65 |
| 3740 Brown Dr | 0.33mi | 4/2.5 | 3,132 (+14%) | 2mo | $367,500 | $117 | 60 |
| 3692 Belmont Abbey Dr | 0.37mi | 4/2.5 | 2,454 (-10%) | 8mo | $399,900 | $163 | 59 |
| 3636 River Hts | 0.65mi | 4/2.5 | 2,922 (+7%) | 5mo | $339,900 | $116 | 55 |
| 3773 Guilford Ct | 0.44mi | 4/2.5 | 2,424 (-11%) | 9mo | $370,000 | $153 | 52 |
| 3864 Wake Forest Rd | 0.36mi | 5/3.0 (+1) | 2,445 (-11%) | 8mo | $318,000 | $130 | 51 |
| 3691 Sapphire Ct | 0.52mi | 3/2.5 (-1) | 2,390 (-13%) | 2mo | $227,000 | $95 | 48 |
Match score weights: distance 35% · size 25% · config 20% · recency 20%. Top-matched comps best support the ARV.
Projected returns pro-forma
-3.0% appreciation · 2.18% rent growth · sell at horizon
- IRR
- -5.1%
- Equity multiple
- 0.81×
- Total profit
- $-9,509
- Equity at exit
- $26,689
- IRR
- 3.5%
- Equity multiple
- 1.24×
- Total profit
- $12,146
- Equity at exit
- $15,477
Cash invested: $50,120 (down + closing). Projections, not guarantees.
Landlord ↔ Tenant lean methodology
- Overall (STATE)
- 90 Strongly Landlord-Friendly
- State Georgia
- 90 Strongly Landlord-Friendly · R+3
- County
- — inherits STATE
- City
- — inherits STATE
ZIP-level market 30034
- Home prices YoY
- -27.4%
- Rents YoY
- 2.2%
- Active inventory
- 355
- Price-to-rent
- 6.4×
Monthly cashflow live
- Estimated rent
- $2,327 high interval (Pro) →
- Mortgage (P&I)
- −$939
- Tax from tax record
- −$426 /mo · $5,106/yr
- Insurance
- −$75
- HOA
- −$67
- Vacancy / Maint / Mgmt
- −$489
- Net cashflow
- $333
Break-even live
Sensitivity live
| Price | -10% $434 | -5% $384 | +0% $333 | +5% $282 | +10% $232 |
|---|---|---|---|---|---|
| Rent | -10% $149 | -5% $241 | +0% $333 | +5% $425 | +10% $517 |
| Rate | -1.0pp $423 | -0.5pp $378 | base $333 | +0.5pp $286 | +1.0pp $239 |
UW: 25.0% down · 7.5% · 30yr · 1.5% tax · 5.0% vac · 8.0% maint · 8.0% mgmt
Financing live
Cash to close
- Down payment
- $44,750
- Closing costs
- $5,370
- Reserves months
- —
- Total cash needed
- —
Loan-product check · same deal, 3 products live
Conventional
25% down · 7.5% · 30yr
- Down + closing
- —
- Monthly P&I
- —
- Monthly cashflow
- —
- DSCR
- —
- Eligible?
- —
Personal DTI + credit; lowest rate.
DSCR
20% down · 8.5% · 30yr
- Down + closing
- —
- Monthly P&I
- —
- Monthly cashflow
- —
- DSCR
- —
- Eligible?
- —
No personal income docs; deal must DSCR.
Hard money
10% down · 12.0% · 12mo
- Down + closing
- —
- Monthly P&I
- —
- Monthly cashflow
- —
- DSCR
- —
- Eligible?
- —
Short-term bridge; refi at stabilization.
Rent comps 15 comps
| Address | Beds | Baths | Sqft | Rent | $/sqft | DOM | Units | Dist |
|---|---|---|---|---|---|---|---|---|
| 3693 Belmont Abbey Dr Decatur, GA | 4.0 | 2.5 | 2454 | $2,531 | $1.03 | 14d | 1 | 0.35mi |
| 3843 Chimney Ridge Ct Ellenwood, GA | 5.0 | 3.0 | 1912 | $1,945 | $1.02 | 45d | 1 | 0.47mi |
| 4068 Day Trl S Ellenwood, GA | 4.0 | 2.0 | 1836 | $2,100 | $1.14 | 6d | 1 | 0.49mi |
| 3688 Seton Hall Dr Decatur, GA | 4.0 | 2.5 | 2308 | $2,300 | $1.00 | 6d | 1 | 0.51mi |
| 4061 Faron Ct Ellenwood, GA | 4.0 | 2.0 | 2184 | $2,174 | $1.00 | 0d | 1 | 0.52mi |
| 3604 Spring Trce Decatur, GA | 3.0 | 2.5 | 1806 | $1,595 | $0.88 | 45d | 1 | 0.56mi |
| 3856 Radcliffe Blvd Decatur, GA | 4.0 | 3.0 | 1968 | $1,995 | $1.01 | 45d | 1 | 0.56mi |
| 4000 Wychwood Ln Ellenwood, GA | 4.0 | 2.5 | 2535 | $2,535 | $1.00 | 14d | 1 | 0.75mi |
| 3725 Patti Pkwy Decatur, GA | 4.0 | 2.0 | 1914 | $2,220 | $1.16 | 45d | 1 | 1.01mi |
| 4267 Azalea Walk Ellenwood, GA | 4.0 | 2.5 | 2912 | $2,890 | $0.99 | 25d | 1 | 1.05mi |
| 3948 English Valley Dr Ellenwood, GA | 4.0 | 3.0 | 2492 | $2,590 | $1.04 | 14d | 1 | 1.10mi |
| 4254 Catalpa Park Ellenwood, GA | 3.0 | 2.0 | 2048 | $1,605 | $0.78 | 45d | 1 | 1.10mi |
| 4611 River Rd Ellenwood, GA | 4.0 | 4.0 | 2564 | $2,181 | $0.85 | 25d | 1 | 1.11mi |
| 3370 Flagstone Trce Ellenwood, GA | 4.0 | 3.5 | 2451 | $2,750 | $1.12 | 45d | 1 | 1.28mi |
| 3518 Moonlight Ct Decatur, GA | 4.0 | 3.0 | 2022 | $2,400 | $1.19 | 14d | 1 | 1.36mi |
HOA detail
- Monthly dues
- $67 · $804/yr
Listing history 5 events
-
2026-06-13statusdays on market $179,000 Pending 6 DOM
-
2026-06-09days on market $179,000 Active 5 DOM
-
2026-06-08days on market $179,000 Active 4 DOM
-
2026-06-07remarks 699-char remark
-
2026-06-07$179,000 Active 3 DOM
ⓘ Source: listings_history table (triggers on properties + properties_extension) + one-shot
backfill from property_details.listing_events for pre-trigger history.
Tax reassessment forecast GA · Resets to sale price
- Current annual tax
- $5,106 · $426/mo
- Projected year-2 tax
- $5,106 · $426/mo
- Expected delta
- $0/yr ($0/mo · 0.0%)
ⓘ Screening estimate from a state-policy table — verify with the county assessor before closing.
Climate risk First Street
- Flood 1/10 Low FEMA zone X (unshaded) · 0% chance over 30 yrs
- Wildfire 2/10 Low
- Heat 6/10 Major 7 d/yr ≥105°F today · 18 d/yr by 30 yrs out
- Wind 6/10 Major 27% chance of damaging wind over 30 yrs
- Air quality 5/10 Major 7 unhealthy d/yr today · 10 by 30 yrs out
Nearby sold comps map
Loading sold comps map…
Walkable amenities ~0.75 mi
Loading nearby amenities…
Taxation est. · year 1
- Rental income
- $27,929
- − Mortgage interest
- −$10,027
- − Property taxes
- −$5,106
- − Insurance
- −$895
- − Repairs & maintenance
- −$2,234
- − Management
- −$2,234
- − HOA
- −$804
- − Depreciation
- −$5,207
- Taxable income
- $1,421
- Est. tax owed @ 24.0%
- −$341
- After-tax cash flow
- $3,653/yr
For passive investors: Depreciation is non-cash, so a rental often shows a tax loss while cash-flowing — sheltering income. Rental losses are passive: they offset passive income freely, and up to $25,000/yr can offset ordinary (W-2) income if you actively participate and your MAGI is under $100k (phasing out to $0 by $150k); unused losses carry forward. On sale, claimed depreciation is recaptured at up to 25%, and gains may owe capital-gains tax (a 1031 exchange can defer both). Figures are a year-1 estimate at your 24.0% rate — not tax advice; consult a CPA.
Schools (NCES district)
- District
- Dekalb County
- NCES district ID
- 1301740
- Math proficiency
- 19% ▼ -12.00%
- Reading proficiency
- 28% ▼ -7.00%
- Median HH income
- $51,448
- Composite
- 20.92/100
- National rank
- #8482
- State rank
- #125 of 174 in GA
Livability — Stonecrest
No livability data for this city. (Only ~50 U.S. cities are tracked.)
Census & demographics
- County
- Dekalb County · 782,738 people
- City population
- 106,165
- Metro
- Atlanta-Sandy Springs-Alpharetta, GA
- Population (ZIP)
- 41,847
- Household income
- $63,517
- Rent vs Own
- Severe rent burden
- 1659.0
Population outlook (DeKalb County) Hauer SSP2
- Today (2025)
- 839,977 people
- By 2030
- 891,768 · +6.2%
- By 2040
- 988,894 · +17.7%
- By 2050
- 1,074,583 · +27.9%
- By 2075
- 1,245,026 · +48.2%
- By 2100
- 1,303,135 · +55.1%
Race, ethnicity, and origin ACS 2023
- Neighborhood character
- Predominantly Black (90%)
- Race & ethnicity
- Black 90% White 4% Two or more races 3% Hispanic / Latino 2%
- Common ancestry
- Hispanic 1% Lithuanian 1%
- Foreign-born
- 8% · Canada
- Languages at home
- 93% English-only · Spanish 2% French/Haitian/Cajun 1%
Political lean MEDSL · DeKalb
- 2024 margin
- Solid D (+64.8) · D 81.9% · R 17.1% · Other 1.0%
- 2008→2024 swing
- +6.1pp toward D · 2008: 58.6pp · 2024: 64.8pp
- All cycles
- 2024: D+64.8 2020: D+67.4 2016: D+64.8 2012: D+56.8 2008: D+58.6
Not yet ingested
- Civics
- —
Market trends
- HPI YoY
- ▼ -78.92%
- Current HPI
- 209.5638
- Rent YoY
- ▲ 2.18%
- Metro
- Atlanta-Sandy Springs-Alpharetta, GA
- State GDP YoY
- ▲ 2.66%
- F500 in state
- 28
Industry mix (Fortune 500 HQ in GA)
| Industry | F500 HQs | Revenue |
|---|---|---|
| Paper / Packaging | 2 | $29B |
|
||
| Retail | 1 | $160B |
|
||
| Transportation / Logistics | 1 | $91B |
|
||
| Airlines | 1 | $62B |
|
||
| Consumer Goods | 1 | $47B |
|
||
| Utilities | 1 | $25B |
|
||
Price history
-16.7% since first listed10 events — show timeline
- 2026-06-04 Listed $179,000 GAMLS
- 2026-06-04 Listed $179,000 FMLS
- 2026-05-01 Rental Removed $2,611 RENTLY
- 2026-04-17 Price Changed $2,611 RENTLY
- 2026-04-10 Price Changed $2,671 RENTLY
- 2026-04-02 Price Changed $2,736 RENTLY
- 2026-04-01 Listed for Rent $2,916 RENTLY
- 2018-08-20 Sold (Public Records) $169,600 Public Records
- 2018-07-27 Sold (Public Records) $165,000 Public Records
- 2006-10-13 Sold (Public Records) $215,000 Public Records
Property tax history
+5.0%/yrLatest (2025): $5,106 · +0.0% YoY. Source: county tax records.
Cash-flow waterfall
monthlySold comps — $/sqft
last 12 mo · ≤1 miLoading sold comps…