36533 N Pebble Dr #18304 · Long Neck, DE
Flood risk 9/10 · Severe
- FEMA flood zone
- AE
- Chance of flooding over 30 yrs
- 0.99%
- Est. flood insurance / yr
- $2,026 – $9,024
Fire risk 2/10 · Minimal
- Est. fire insurance / yr
- $476 – $884
Heat risk 9/10 · Severe
- Hot days now (above 100°F)
- 7 days/yr
- Hot days in 30 yrs
- 18 days/yr
Wind risk 8/10 · Major
- Chance of severe wind over 30 yrs
- 80.0%
Air-quality risk 2/10 · Minimal
- Unhealthy air days now
- 1 days/yr
- Unhealthy air days in 30 yrs
- 1 days/yr
Risk factors via First Street. Map © Google.
Why this score? — see what drove the D grade
The composite is a weighted blend of 9 inputs, each scored 0–100. Each bar is that input's sub-score; the figure is the points it added to the 100-point composite (weight × sub-score).
- Cash flow +15.0/30.0
- ARV discount +7.5/15.0
- 1% rule +5.0/10.0
- DSCR +5.0/10.0
- Livability +3.5/5.0
- Schools +2.9/10.0
- Rent growth +2.5/5.0
- Condition / age +2.5/5.0
- Appreciation +0.0/10.0
$38,000
🖨 Deal sheet 📄 Offer letter ✓ Due diligence
Listing remarks
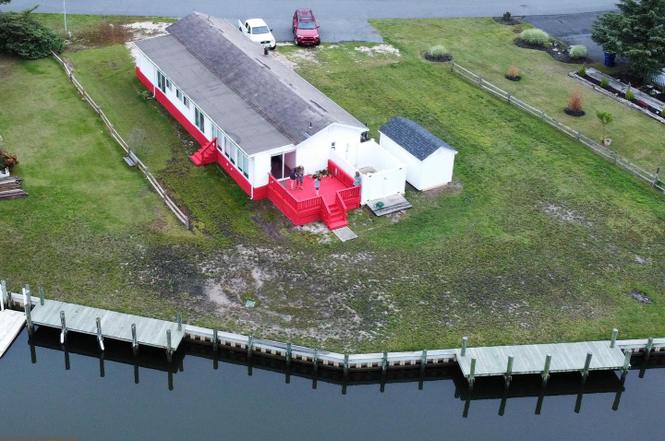
WATERFRONT COMMUNITY LIVING AT ITS BEST! Welcome to Pot-Nets Coveside, one of Sussex County's most sought-after waterfront communities. Situated on a spacious lot just steps from the marina and waterfront, this well-maintained home offers the perfect blend of comfort, coastal charm, and resort-style amenities. Inside, you'll find an open-concept layout featuring a large living area with fireplace, luxury vinyl plank flooring, abundant natural light, and a spacious kitchen with breakfast bar, updated stainless steel appliances, ample cabinetry, and plenty of counter space for entertaining. The home offers comfortable bedrooms, including a spacious primary suite, and generous storage througho
Key facts
- Large living area
- Waterfront community
- Spacious lot
Tags
Property features AI
Finance
- Other: Property located in a federal flood zone (AE); Ownership is land lease; Property is in city limits; Directions: Use preferred GPS
- Financial info: Land lease of $1,600 monthly with approximately 1 year remaining; Annual ground rent applies
- HOA & community: Community pool
Exterior
- Parking: Driveway
- Utilities: Public water; Public sewer; Electric power
- Home design: Manufactured home; Modular/Manufactured construction; Shingle/asphalt roof; Single level (all bedrooms on main level); Estimated year built
- Construction: Manufactured structure; Shingle/asphalt roof; Above grade and below grade structures noted
- Exterior features: Porch(es); Outside shower; Partial fencing; Water view with 40 ft. frontage; Water access on a canal; Community pool
Interior
- Kitchen: Stainless steel appliances; Electric oven/range; Stove; Refrigerator; Microwave
- Bedrooms: 3 bedrooms on the main level
- Bathrooms: 2 full bathrooms on the main level; 2 full bathrooms total
- Heating & cooling: Forced air heating (electric); Central air conditioning (electric); Electric hot water
- Interior features: Ceiling fan(s); Insulated and storm doors
Neighborhood map
What this means for you Summary
Snapshot
- This is a 3-bed/2.0-bath single-family listed at $38k.
Deal economics
- At list price, monthly cash flow is $1k ($12k/yr) — positive.
- The deal already cash-flows at list — no discount required.
- Meets the 1% rule at list price ($2k rent vs $38k).
- Cap rate 53.7% vs local median 3.2% in Long Neck — top-decile yield for the area; either an underpriced asset or a hidden risk that comps aren't pricing in. Stress-test before assuming the spread holds.
Location & tenants
- Location reads 69/100 on livability (#30 in DE) — a middle-class / working-renter tenant base. Strengths: cost of living A+, housing A+, crime A-; Watch: employment D+, schools F, amenities F.
- Indian River School District (rural): math 25% / reading 41% proficiency, ranked #14 of 26 in DE (top 54%) — families likely to look elsewhere, expect single-tenant / working-renter base with shorter leases.
- Market conditions: 865 active listings in the ZIP; 1 comparable units currently listed for rent nearby; solid renter incomes; 4,354 units permitted in Sussex County in 2024 (344 in 5+ unit buildings).
- This rent runs 34% of the median local income ($78k/yr) — at the standard rent-burdened threshold; future hikes will face affordability resistance.
Forward outlook
- Local home prices are declining (-3.0%/yr); year-one equity from $263 of loan paydown is wiped out by about $1k of value loss. Plan a longer hold.
- Sussex County population projected at +25% by 2050 — long-run rental-demand tailwind backs the buy-and-hold thesis.
- At projected returns (-3.0% appreciation + 3.0% rent growth), your $11k cash investment doubles in ~1 year — after that, you're playing with house money.
Negotiation context
- Only 4 days on market — expect competitive offers; lowballing is unlikely to land.
- 7 sale attempts since 12y ago with the ask held roughly flat each time — persistent listings suggest the price (not the market) is what's stuck; bring a comps-based counter.
- Current owner paid $30k; 29% above their basis — modest negotiation headroom, anchor on the comps not their cost.
Risks & watch-outs
- Watch-outs: flood insurance adds $460/mo.
- Climate carrying-cost: in FEMA flood zone AE (mandatory federal flood insurance); severe wind risk, 80% chance of damaging wind over 30y; extreme-heat days projected 7→18/yr by 2055 (HVAC capex compounding) — expect insurance premiums to compound above CPI over the hold.
Questions for the listing agent
- What's the actual annual flood-insurance premium (NFIP or private), and is the property in a SFHA with mandatory coverage?
- Is there a deadline driving the sale (1031 exchange, divorce, estate, relocation)? That informs how much negotiation room exists.
- Schools are F-rated, which usually means shorter tenancies and higher turnover. Who's the typical renter profile here, and what's been the actual vacancy rate?
- The area grade is low — what's the realistic commute time and amenity access for the typical tenant pool here? Any planned neighborhood developments (good or bad) we should know about?
- What's the average days-on-market for RENTAL listings here right now (not sales)? A rising rental-DOM trend means longer vacancies and softer asking-rent achievability than the comps imply.
- What's the recent tenant-quality profile in this submarket — average credit score on applications, eviction rate, late-payment / NSF rate, and stable-employment percentage? A property-management company in the area should have these aggregated.
- How much new for-sale + rental construction is in the pipeline within 1–3 miles? Heavy new supply typically softens prices + rents 12–24 months out; constrained supply supports both.
Investment metrics
- 1% rule
- 5.87% ✓
- Cap rate
- 53.67%
- Cash-on-cash
- 169.20%
- DSCR
- 8.53
- GRM
- 1.4
CMA / ARV
- ARV (on-the-fly)
- $159,840
- Comps found
- 12
Show comp detail 12 sales within ~0.75 mi
| Address | Dist | Beds/Ba | Sqft | Sold | Price | $/sf | Match |
|---|---|---|---|---|---|---|---|
| 36768 Ruddy Duck Ln #92 | 0.43mi | 3/2.0 | 1,344 (-7%) | 5mo | $77,000 | $57 | 65 |
| 26217 Cove Dr | 0.48mi | 3/2.0 | 1,567 (+9%) | 2mo | $210,000 | $134 | 62 |
| 36806 Teal Rd #50 | 0.51mi | 3/2.0 | 1,344 (-7%) | 4mo | $101,500 | $76 | 61 |
| 35515 Knoll Way #56383 | 0.67mi | 3/2.0 | 1,447 (+0%) | 10mo | $210,000 | $145 | 60 |
| 35518 Joann Dr #137 | 0.63mi | 2/— (-1) | 1,484 (+3%) | 3mo | $138,000 | $93 | 58 |
| 26221 Cove Dr | 0.49mi | 3/2.0 | 1,296 (-10%) | 4mo | $205,000 | $158 | 57 |
| 25861 Mahogany St | 0.58mi | 4/2.0 (+1) | 1,360 (-6%) | 2mo | $107,500 | $79 | 57 |
| 35593 Main St #36356 | 0.65mi | 3/2.0 | 1,536 (+7%) | 3mo | $75,000 | $49 | 56 |
| 36904 Nob Hill North | 0.52mi | 4/2.0 (+1) | 1,321 (-8%) | 3mo | $59,000 | $45 | 54 |
| 26586 Barn Ln #9 | 0.72mi | 3/2.0 | 1,310 (-9%) | 1mo | $184,350 | $141 | 50 |
| 25874 N Oak St #1959 | 0.70mi | 3/2.0 | 1,356 (-6%) | 9mo | $150,000 | $111 | 50 |
| 26273 N Cove Dr #47846 | 0.60mi | 3/2.0 | 1,624 (+13%) | 9mo | $210,000 | $129 | 43 |
Match score weights: distance 35% · size 25% · config 20% · recency 20%. Top-matched comps best support the ARV.
Projected returns pro-forma
-3.0% appreciation · 3.0% rent growth · sell at horizon
- IRR
- —
- Equity multiple
- 6.68×
- Total profit
- $60,385
- Equity at exit
- $5,666
- IRR
- —
- Equity multiple
- 14.08×
- Total profit
- $139,144
- Equity at exit
- $3,286
Cash invested: $10,640 (down + closing). Projections, not guarantees.
Landlord ↔ Tenant lean methodology
- Overall (STATE)
- 70 Landlord-Friendly
- State Delaware
- 70 Landlord-Friendly · D+7
- County
- — inherits STATE
- City
- — inherits STATE
ZIP-level market 19966
- Home prices YoY
- -6.4%
- Active inventory
- 865
- Price-to-rent
- 1.4×
Monthly cashflow live
- Estimated rent
- $2,231 medium interval (Pro) →
- Mortgage (P&I)
- −$199
- Tax est. 1.5%
- −$48 /mo · $570/yr
- Insurance
- −$16
- Flood insurance flood zone
- −$460 /mo · $5,525/yr
- HOA
- −$0
- Vacancy / Maint / Mgmt
- −$469
- Net cashflow
- $1,040
Break-even live
UW: 25.0% down · 7.5% · 30yr · 1.5% tax · 5.0% vac · 8.0% maint · 8.0% mgmt
Financing live
Cash to close
- Down payment
- $9,500
- Closing costs
- $1,140
- Reserves months
- —
- Total cash needed
- —
Loan-product check · same deal, 3 products live
Conventional
25% down · 7.5% · 30yr
- Down + closing
- —
- Monthly P&I
- —
- Monthly cashflow
- —
- DSCR
- —
- Eligible?
- —
Personal DTI + credit; lowest rate.
DSCR
20% down · 8.5% · 30yr
- Down + closing
- —
- Monthly P&I
- —
- Monthly cashflow
- —
- DSCR
- —
- Eligible?
- —
No personal income docs; deal must DSCR.
Hard money
10% down · 12.0% · 12mo
- Down + closing
- —
- Monthly P&I
- —
- Monthly cashflow
- —
- DSCR
- —
- Eligible?
- —
Short-term bridge; refi at stabilization.
Rent comps 1 comps
| Address | Beds | Baths | Sqft | Rent | $/sqft | DOM | Units | Dist |
|---|---|---|---|---|---|---|---|---|
| 35829 S Gloucester Cir Unit 35829 Long Neck, DE | 3.0 | 2.5 | 1500 | $1,995 | $1.33 | 13d | 1 | 0.73mi |
Listing history 5 events
-
2026-06-18days on market $38,000 Active 4 DOM
-
2026-06-17days on market $38,000 Active 3 DOM
-
2026-06-16days on market $38,000 Active 2 DOM
-
2026-06-15remarks 699-char remark
-
2026-06-15$38,000 Active 1 DOM
ⓘ Source: listings_history table (triggers on properties + properties_extension) + one-shot
backfill from property_details.listing_events for pre-trigger history.
Climate risk First Street
- Flood 9/10 Extreme FEMA zone AE · 99% chance over 30 yrs
- Wildfire 2/10 Low
- Heat 9/10 Extreme 7 d/yr ≥100°F today · 18 d/yr by 30 yrs out
- Wind 8/10 Severe 80% chance of damaging wind over 30 yrs
- Air quality 2/10 Low 1 unhealthy d/yr today · 1 by 30 yrs out
Nearby sold comps map
Loading sold comps map…
Walkable amenities ~0.75 mi
Loading nearby amenities…
Taxation est. · year 1
- Rental income
- $26,777
- − Mortgage interest
- −$2,129
- − Property taxes
- −$570
- − Insurance
- −$5,715
- − Repairs & maintenance
- −$2,142
- − Management
- −$2,142
- − Depreciation
- −$1,105
- Taxable income
- $12,974
- Est. tax owed @ 24.0%
- −$3,114
- After-tax cash flow
- $9,364/yr
For passive investors: Depreciation is non-cash, so a rental often shows a tax loss while cash-flowing — sheltering income. Rental losses are passive: they offset passive income freely, and up to $25,000/yr can offset ordinary (W-2) income if you actively participate and your MAGI is under $100k (phasing out to $0 by $150k); unused losses carry forward. On sale, claimed depreciation is recaptured at up to 25%, and gains may owe capital-gains tax (a 1031 exchange can defer both). Figures are a year-1 estimate at your 24.0% rate — not tax advice; consult a CPA.
Schools (NCES district)
- District
- Indian River School District
- NCES district ID
- 1000680
- Math proficiency
- 25% ▼ -27.00%
- Reading proficiency
- 41% ▼ -17.00%
- Median HH income
- $53,838
- Composite
- 28.99/100
- National rank
- #6620
- State rank
- #14 of 26 in DE
Livability — Long Neck
- Score
- 69/100
- State rank
- #30
- US rank
- #8720
Category grades
Schools grade is shown separately in the Schools card above.
Census & demographics
- County
- Sussex County · 82,708 people
- Metro
- Salisbury, MD-DE
- Population (ZIP)
- 35,884
- Household income
- $78,305
- Rent vs Own
- Severe rent burden
- 464.0
Population outlook (Sussex County) Hauer SSP2
- Today (2025)
- 248,853 people
- By 2030
- 264,464 · +6.3%
- By 2040
- 290,980 · +16.9%
- By 2050
- 311,259 · +25.1%
- By 2075
- 352,488 · +41.6%
- By 2100
- 367,406 · +47.6%
Race, ethnicity, and origin ACS 2023
- Neighborhood character
- Predominantly White (74%)
- Race & ethnicity
- White 74% Hispanic / Latino 11% Black 8% Two or more races 7% Native American 3% Asian 1%
- Hispanic origin (detail)
- Mexican 3%
- Common ancestry
- Romanian 4% Slovak 2% Serbian 1%
- Foreign-born
- 8% · Canada, China
- Languages at home
- 88% English-only · Spanish 9% Other Indo-European 1%
Political lean MEDSL · Sussex
- 2024 margin
- R (+11.0) · D 43.9% · R 54.9% · Other 1.2%
- 2008→2024 swing
- -2.4pp toward R · 2008: -8.6pp · 2024: -11.0pp
- All cycles
- 2024: R+11.0 2020: R+11.2 2016: R+22.0 2012: R+13.0 2008: R+8.6
Not yet ingested
- Civics
- —
Market trends
- HPI YoY
- ▼ -18.26%
- Current HPI
- 268.5609
- Rent YoY
- —
- Metro
- Salisbury, MD-DE
- State GDP YoY
- —
- F500 in state
- 0
Price history
-61.4% since first listed13 events — show timeline
- 2026-06-14 Listed $38,000 BRIGHT MLS
- 2018-05-30 Listing Removed — BRIGHT MLS
- 2018-05-30 Listing Removed — BRIGHT MLS
- 2018-03-26 Listed $64,500 BRIGHT MLS
- 2017-12-18 Listing Removed — BRIGHT MLS
- 2017-09-22 Listed $64,500 BRIGHT MLS
- 2017-09-21 Listed $64,500 BRIGHT MLS
- 2015-12-18 Sold (MLS) $29,500 BRIGHT MLS
- 2015-09-02 Listed $38,500 BRIGHT MLS
- 2015-06-17 Listing Removed — BRIGHT MLS
- 2015-06-16 Listed $44,500 BRIGHT MLS
- 2014-07-01 Listing Removed — BRIGHT MLS
- 2014-04-03 Listed $98,500 BRIGHT MLS
Cash-flow waterfall
monthlySold comps — $/sqft
last 12 mo · ≤1 miLoading sold comps…