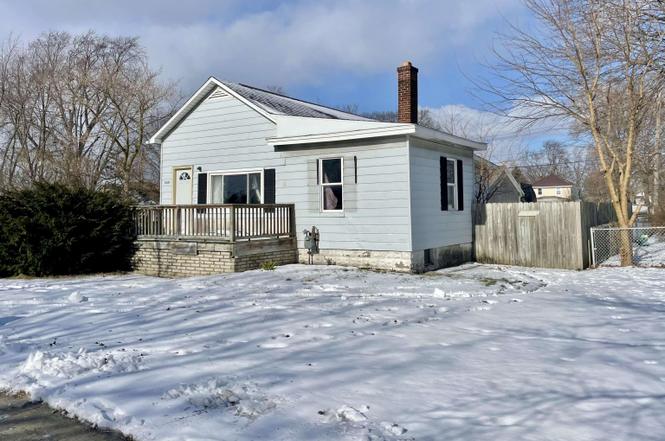
1821 Pine St · Port Huron, MI
Flood risk No data
- FEMA flood zone
- —
- Chance of flooding over 30 yrs
- —
- Est. flood insurance / yr
- —
Fire risk No data
- Est. fire insurance / yr
- —
Heat risk No data
- Hot days now (above threshold)
- —
- Hot days in 30 yrs
- —
Wind risk No data
- Chance of severe wind over 30 yrs
- —
Air-quality risk No data
- Unhealthy air days now
- —
- Unhealthy air days in 30 yrs
- —
Risk factors via First Street. Map © Google.
Why this score? — see what drove the C+ grade
The composite is a weighted blend of 9 inputs, each scored 0–100. Each bar is that input's sub-score; the figure is the points it added to the 100-point composite (weight × sub-score).
- Cash flow +20.3/30.0
- ARV discount +15.0/15.0
- 1% rule +7.6/10.0
- DSCR +6.5/10.0
- Rent growth +3.4/5.0
- Livability +3.2/5.0
- Schools +2.5/10.0
- Condition / age +2.5/5.0
- Appreciation +0.0/10.0
$95,000
🖨 Deal sheet 📄 Offer letter ✓ Due diligence
Listing remarks MLS
This unique property is conveniently located near local amenities, schools, and parks, and provides easy access to the heart of Port Huron. Whether you are an investor looking to flip or a homeowner with a vision for your next project, 1821 Pine St. presents an outstanding opportunity to build equity and create a space that fits your needs and tastes. Do not miss your chance to capitalize on the potential of this home and make it your own! Schedule a showing today and explore the possibilities.
Key facts
- 0.27 acre lot
- Garage
- Built 1908
Neighborhood map
What this means for you Summary
Snapshot
- This is a 2-bed/1.0-bath single-family listed at $95k.
Deal economics
- At list price, monthly cash flow is $122 ($1k/yr) — positive.
- The deal already cash-flows at list — no discount required.
- Meets the 1% rule at list price ($1k rent vs $95k).
- Cap rate 7.8% vs local median 4.6% in Port Huron — top-decile yield for the area; either an underpriced asset or a hidden risk that comps aren't pricing in. Stress-test before assuming the spread holds.
Location & tenants
- Location reads 65/100 on livability (#445 in MI) — a middle-class / working-renter tenant base. Strengths: cost of living A+, housing A+; Watch: amenities C-, health & safety D, schools F.
- Port Huron Area School District (suburban): math 23% / reading 37% proficiency, ranked #368 of 540 in MI (top 68%) — families likely to look elsewhere, expect single-tenant / working-renter base with shorter leases.
- Market conditions: Rents rising (+3.6%/yr); 220 active listings in the ZIP; 13 comparable units currently listed for rent nearby; rentals lingering (median 44d on market — plan ~5-8 weeks vacancy on turnover, expect pricing pressure); 54% of comp listings sitting > 30 days — soft ceiling on asking rent; 232 units permitted in St. Clair County in 2024 (0 in 5+ unit buildings).
Forward outlook
- Local home prices are declining (-3.0%/yr); year-one equity from $657 of loan paydown is wiped out by about $3k of value loss. Plan a longer hold.
- St. Clair County population projected at -20% by 2050 — secular population decline; favor cash flow + early exit over multi-decade hold.
Negotiation context
- Only 1 days on market — expect competitive offers; lowballing is unlikely to land.
- 5 sale attempts since 27y ago with the ask held roughly flat each time — persistent listings suggest the price (not the market) is what's stuck; bring a comps-based counter.
- Current owner paid $75k; 27% above their basis — modest negotiation headroom, anchor on the comps not their cost.
Risks & watch-outs
- Watch-outs: property tax is 3.6% of price; built in 1908 — expect roof / HVAC / electrical / plumbing capex.
Questions for the listing agent
- Built in 1908 — when were the roof, HVAC, electrical panel, plumbing, and water heater last replaced?
- Property tax is high relative to price — has the assessment been appealed recently, and will the sale trigger a re-assessment?
- Is there a deadline driving the sale (1031 exchange, divorce, estate, relocation)? That informs how much negotiation room exists.
- Schools are F-rated, which usually means shorter tenancies and higher turnover. Who's the typical renter profile here, and what's been the actual vacancy rate?
- Crime grade is F in this area — have there been break-ins, vandalism, or insurance claims at this property in the last 3 years? What carrier currently insures it and at what premium?
- What's the average days-on-market for RENTAL listings here right now (not sales)? A rising rental-DOM trend means longer vacancies and softer asking-rent achievability than the comps imply.
- What's the recent tenant-quality profile in this submarket — average credit score on applications, eviction rate, late-payment / NSF rate, and stable-employment percentage? A property-management company in the area should have these aggregated.
- How much new for-sale + rental construction is in the pipeline within 1–3 miles? Heavy new supply typically softens prices + rents 12–24 months out; constrained supply supports both.
Investment metrics
- 1% rule
- 1.26% ✓
- Cap rate
- 7.84%
- Cash-on-cash
- 5.52%
- DSCR
- 1.25
- GRM
- 6.6
CMA / ARV
- ARV (on-the-fly)
- $141,174
- Comps found
- 12
Show comp detail 12 sales within ~0.75 mi
| Address | Dist | Beds/Ba | Sqft | Sold | Price | $/sf | Match |
|---|---|---|---|---|---|---|---|
| 1821 Pine St | 0.00mi | 2/1.0 | 1,023 (0%) | 0mo | $60,000 | $59 | 100 |
| 741 17th St | 0.16mi | 2/1.0 | 924 (-10%) | 0mo | $135,000 | $146 | 76 |
| 1503 Wall St | 0.25mi | 3/1.5 (+1) | 930 (-9%) | 0mo | $128,000 | $138 | 66 |
| 1312 11th St | 0.65mi | 3/1.0 (+1) | 1,008 (-2%) | 3mo | $72,500 | $72 | 60 |
| 1424 14th St | 0.50mi | 2/1.0 | 1,124 (+10%) | 1mo | $155,000 | $138 | 60 |
| 1504 18th St | 0.40mi | 2/1.0 | 900 (-12%) | 3mo | $118,000 | $131 | 59 |
| 2213 Bancroft St | 0.72mi | 2/1.0 | 984 (-4%) | 2mo | $152,500 | $155 | 58 |
| 1517 Gordon St | 0.55mi | 2/1.0 | 906 (-11%) | 2mo | $135,000 | $149 | 54 |
| 2210 Griswold St | 0.51mi | 3/1.0 (+1) | 1,136 (+11%) | 1mo | $184,000 | $162 | 52 |
| 2506 Division St | 0.71mi | 3/1.0 (+1) | 1,085 (+6%) | 1mo | $140,000 | $129 | 51 |
| 113 Runnels St | 0.72mi | 3/1.0 (+1) | 1,138 (+11%) | 2mo | $65,000 | $57 | 41 |
| 1909 Minnie St | 0.62mi | 3/1.0 (+1) | 875 (-14%) | 2mo | $150,000 | $171 | 40 |
Match score weights: distance 35% · size 25% · config 20% · recency 20%. Top-matched comps best support the ARV.
Projected returns pro-forma
-3.0% appreciation · 3.61% rent growth · sell at horizon
- IRR
- -6.8%
- Equity multiple
- 0.75×
- Total profit
- $-6,747
- Equity at exit
- $14,165
- IRR
- 3.8%
- Equity multiple
- 1.29×
- Total profit
- $7,706
- Equity at exit
- $8,214
Cash invested: $26,600 (down + closing). Projections, not guarantees.
Landlord ↔ Tenant lean methodology
- Overall (STATE)
- 62 Landlord-Friendly
- State Michigan
- 62 Landlord-Friendly · EVEN
- County
- — inherits STATE
- City
- — inherits STATE
ZIP-level market 48060
- Rents YoY
- 3.6%
- Active inventory
- 220
- Price-to-rent
- 6.6×
Monthly cashflow live
- Estimated rent
- $1,194 high interval (Pro) →
- Mortgage (P&I)
- −$498
- Tax from tax record
- −$284 /mo · $3,402/yr
- Insurance
- −$40
- HOA
- −$0
- Vacancy / Maint / Mgmt
- −$251
- Net cashflow
- $122
Break-even live
UW: 25.0% down · 7.5% · 30yr · 1.5% tax · 5.0% vac · 8.0% maint · 8.0% mgmt
Financing live
Cash to close
- Down payment
- $23,750
- Closing costs
- $2,850
- Reserves months
- —
- Total cash needed
- —
Loan-product check · same deal, 3 products live
Conventional
25% down · 7.5% · 30yr
- Down + closing
- —
- Monthly P&I
- —
- Monthly cashflow
- —
- DSCR
- —
- Eligible?
- —
Personal DTI + credit; lowest rate.
DSCR
20% down · 8.5% · 30yr
- Down + closing
- —
- Monthly P&I
- —
- Monthly cashflow
- —
- DSCR
- —
- Eligible?
- —
No personal income docs; deal must DSCR.
Hard money
10% down · 12.0% · 12mo
- Down + closing
- —
- Monthly P&I
- —
- Monthly cashflow
- —
- DSCR
- —
- Eligible?
- —
Short-term bridge; refi at stabilization.
Rent comps 13 comps
| Address | Beds | Baths | Sqft | Rent | $/sqft | DOM | Units | Dist |
|---|---|---|---|---|---|---|---|---|
| 1613 Lapeer Ave Unit 2 Port Huron, MI | 2.0 | 1.0 | 800 | $875 | $1.09 | 44d | 1 | 0.32mi |
| 937 Howard St Port Huron, MI | 3.0 | 1.0 | 1080 | $1,500 | $1.39 | 18d | 1 | 0.69mi |
| 1820 Kern St Port Huron, MI | 2.0 | 1.0 | 950 | $1,000 | $1.05 | 24d | 1 | 0.74mi |
| 145 Rural St Unit 145 Port Huron, MI | 2.0 | 1.5 | 950 | $1,190 | $1.25 | 24d | 1 | 0.77mi |
| 619 Taylor St Port Huron, MI | 2.0–3.0 | 1.0–1.5 | 716 | $780 | $1.09 | 2d | 1 | 0.83mi |
| 909 Stone St Unit 1 Port Huron, MI | 3.0 | 1.0 | 1100 | $1,250 | $1.14 | 44d | 1 | 1.05mi |
| 512 Quay St Port Huron, MI | 1.0 | 1.0 | 1054 | $1,700 | $1.61 | 44d | 1 | 1.10mi |
| 508 Quay St Unit 3 Port Huron, MI | 1.0 | 1.0 | 840 | $2,500 | $2.98 | 44d | 1 | 1.10mi |
| 218 Huron Ave Unit 303 Port Huron, MI | 2.0 | 2.0 | 1239 | $1,600 | $1.29 | 44d | 1 | 1.15mi |
| 218 Huron Ave Apt 204 Port Huron, MI | 2.0 | 2.0 | 1086 | $1,700 | $1.57 | 44d | 1 | 1.15mi |
| 208 Huron Ave Unit 202-2B Port Huron, MI | 2.0 | 2.0 | 1096 | $1,600 | $1.46 | 44d | 1 | 1.15mi |
| 415 Griswold St Unit 3 Port Huron, MI | 1.0 | 1.0 | 700 | $875 | $1.25 | 17d | 1 | 1.17mi |
| 2008 Military St #18 Port Huron, MI | 2.0 | 1.0 | 750 | $1,250 | $1.67 | 18d | 1 | 1.28mi |
Listing history 10 events
-
2025-01-21status Pending
Show marketing remark (499 chars)
This unique property is conveniently located near local amenities, schools, and parks, and provides easy access to the heart of Port Huron. Whether you are an investor looking to flip or a homeowner with a vision for your next project, 1821 Pine St. presents an outstanding opportunity to build equity and create a space that fits your needs and tastes. Do not miss your chance to capitalize on the potential of this home and make it your own! Schedule a showing today and explore the possibilities.
-
2025-01-21status Pending 499-char remark
Show marketing remark (499 chars)
This unique property is conveniently located near local amenities, schools, and parks, and provides easy access to the heart of Port Huron. Whether you are an investor looking to flip or a homeowner with a vision for your next project, 1821 Pine St. presents an outstanding opportunity to build equity and create a space that fits your needs and tastes. Do not miss your chance to capitalize on the potential of this home and make it your own! Schedule a showing today and explore the possibilities.
-
2025-01-21$95,000 Active
Show marketing remark (499 chars)
This unique property is conveniently located near local amenities, schools, and parks, and provides easy access to the heart of Port Huron. Whether you are an investor looking to flip or a homeowner with a vision for your next project, 1821 Pine St. presents an outstanding opportunity to build equity and create a space that fits your needs and tastes. Do not miss your chance to capitalize on the potential of this home and make it your own! Schedule a showing today and explore the possibilities.
-
2025-01-20$95,000 Active 499-char remark
Show marketing remark (499 chars)
This unique property is conveniently located near local amenities, schools, and parks, and provides easy access to the heart of Port Huron. Whether you are an investor looking to flip or a homeowner with a vision for your next project, 1821 Pine St. presents an outstanding opportunity to build equity and create a space that fits your needs and tastes. Do not miss your chance to capitalize on the potential of this home and make it your own! Schedule a showing today and explore the possibilities.
-
2003-03-25soldstatus $75,000
-
2002-11-16$84,900
-
2002-07-30historical
-
2002-01-25$92,500
-
1999-06-30soldstatus $86,000
-
1999-02-27$85,900
ⓘ Source: listings_history table (triggers on properties + properties_extension) + one-shot
backfill from property_details.listing_events for pre-trigger history.
Tax reassessment forecast MI · Partial reset (capped growth)
- Current annual tax
- $3,402 · $284/mo
- Projected year-2 tax
- $3,402 · $284/mo
- Expected delta
- $0/yr ($0/mo · 0.0%)
ⓘ Screening estimate from a state-policy table — verify with the county assessor before closing.
Nearby sold comps map
Loading sold comps map…
Walkable amenities ~0.75 mi
Loading nearby amenities…
Taxation est. · year 1
- Rental income
- $14,334
- − Mortgage interest
- −$5,321
- − Property taxes
- −$3,402
- − Insurance
- −$475
- − Repairs & maintenance
- −$1,147
- − Management
- −$1,147
- − Depreciation
- −$2,764
- Taxable income
- $78
- Est. tax owed @ 24.0%
- −$19
- After-tax cash flow
- $1,449/yr
For passive investors: Depreciation is non-cash, so a rental often shows a tax loss while cash-flowing — sheltering income. Rental losses are passive: they offset passive income freely, and up to $25,000/yr can offset ordinary (W-2) income if you actively participate and your MAGI is under $100k (phasing out to $0 by $150k); unused losses carry forward. On sale, claimed depreciation is recaptured at up to 25%, and gains may owe capital-gains tax (a 1031 exchange can defer both). Figures are a year-1 estimate at your 24.0% rate — not tax advice; consult a CPA.
Schools (NCES district)
- District
- Port Huron Area School District
- NCES district ID
- 2628830
- Math proficiency
- 23% ▼ -5.00%
- Reading proficiency
- 37% ▼ -2.00%
- Median HH income
- $42,093
- Composite
- 25.4/100
- National rank
- #7462
- State rank
- #368 of 540 in MI
Livability — Port Huron
- Score
- 65/100
- State rank
- #445
- US rank
- #12478
Category grades
Schools grade is shown separately in the Schools card above.
Census & demographics
- Census place
- Port Huron, MI
- County
- Saint Clair County · 44,760 people
- City population
- 39,342
- Metro
- Detroit-Warren-Dearborn, MI
- Population (ZIP)
- 39,342
- Household income
- $53,018
- Rent vs Own
- Severe rent burden
- 1808.0
Population outlook (St. Clair County) Hauer SSP2
- Today (2025)
- 154,587 people
- By 2030
- 150,031 · -2.9%
- By 2040
- 138,177 · -10.6%
- By 2050
- 124,390 · -19.5%
- By 2075
- 95,825 · -38.0%
- By 2100
- 68,672 · -55.6%
Race, ethnicity, and origin ACS 2023
- Neighborhood character
- Predominantly White (80%)
- Race & ethnicity
- White 80% Black 7% Two or more races 7% Hispanic / Latino 6%
- Hispanic origin (detail)
- Mexican 4%
- Common ancestry
- Romanian 6% Lithuanian 4% Slovak 3%
- Foreign-born
- 2% · Canada
- Languages at home
- 97% English-only · Spanish 2%
Political lean MEDSL · St. Clair
- 2024 margin
- Solid R (+34.6) · D 32.0% · R 66.6% · Other 1.4%
- 2008→2024 swing
- -37.3pp toward R · 2008: 2.6pp · 2024: -34.6pp
- All cycles
- 2024: R+34.6 2020: R+30.2 2016: R+31.4 2012: R+7.1 2008: D+2.6
Not yet ingested
- Civics
- —
Market trends
- HPI YoY
- ▼ -134.75%
- Current HPI
- 177.2401
- Rent YoY
- ▲ 3.61%
- Metro
- Detroit-Warren-Dearborn, MI
- State GDP YoY
- ▲ 1.37%
- F500 in state
- 28
Industry mix (Fortune 500 HQ in MI)
| Industry | F500 HQs | Revenue |
|---|---|---|
| Automotive Parts | 3 | $48B |
|
||
| Automotive | 2 | $372B |
|
||
| Chemicals | 1 | $45B |
|
||
| Automotive Retail | 1 | $29B |
|
||
| Healthcare / Medical Devices | 1 | $23B |
|
||
| Automotive Technology | 1 | $20B |
|
||
Price history
+10.6% since first listed10 events — show timeline
- 2025-01-21 Pending — REALCOMP
- 2025-01-21 Pending — MiRealSource-MiMLS
- 2025-01-21 Listed $95,000 REALCOMP
- 2025-01-20 Listed $95,000 MiRealSource-MiMLS
- 2003-03-25 Sold (MLS) $75,000 REALCOMP
- 2002-11-16 Listed $84,900 REALCOMP
- 2002-07-30 Listing Removed — REALCOMP
- 2002-01-25 Listed $92,500 REALCOMP
- 1999-06-30 Sold (MLS) $86,000 REALCOMP
- 1999-02-27 Listed $85,900 REALCOMP
Property tax history
+14.9%/yrLatest (2023): $3,402 · +59.6% YoY. Source: county tax records.
Cash-flow waterfall
monthlySold comps — $/sqft
last 12 mo · ≤1 miLoading sold comps…