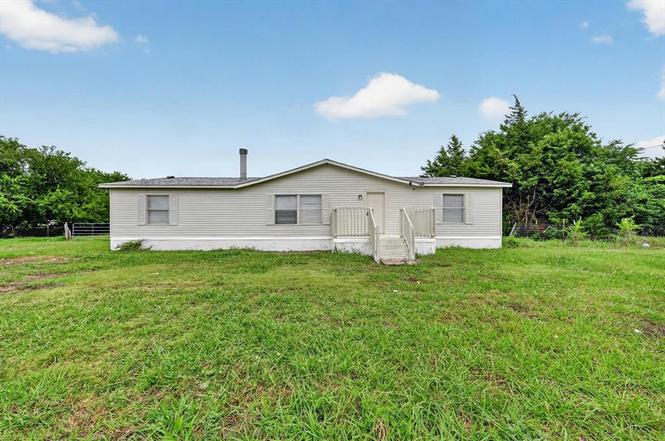
13405 Wheat Rd · Venus, TX
Flood risk 1/10 · Minimal
- FEMA flood zone
- X (unshaded)
- Chance of flooding over 30 yrs
- 0.0%
- Est. flood insurance / yr
- $507 – $1,088
Fire risk 5/10 · Moderate
- Est. fire insurance / yr
- $1,222 – $2,270
Heat risk 7/10 · Major
- Hot days now (above 110°F)
- 7 days/yr
- Hot days in 30 yrs
- 23 days/yr
Wind risk 6/10 · Moderate
- Chance of severe wind over 30 yrs
- 27.0%
Air-quality risk 2/10 · Minimal
- Unhealthy air days now
- 2 days/yr
- Unhealthy air days in 30 yrs
- 2 days/yr
Risk factors via First Street. Map © Google.
Why this score? — see what drove the C grade
The composite is a weighted blend of 9 inputs, each scored 0–100. Each bar is that input's sub-score; the figure is the points it added to the 100-point composite (weight × sub-score).
- ARV discount +15.0/15.0
- Cash flow +14.6/30.0
- Appreciation +8.7/10.0
- DSCR +4.4/10.0
- 1% rule +4.0/10.0
- Livability +3.5/5.0
- Rent growth +3.1/5.0
- Schools +2.5/10.0
- Condition / age +2.5/5.0
$239,900
🖨 Deal sheet (PDF) 📄 Offer letter ✓ Due diligence
Listing remarks
Beautifully Remodeled Home on 1 Acre in Venus, TX! Welcome to this beautifully updated home situated on a spacious 1-acre lot, offering the perfect blend of country living and modern convenience. Enjoy easy access to major highways including US-67 and I-35W. You'll also be just minutes from local shopping, dining, schools, and recreational opportunities. This move-in-ready home has been completely remodeled and features new flooring, brand-new carpeting, fresh interior and exterior paint, granite countertops in both the kitchen and bathrooms, and stainless-steel appliances. The open and inviting layout provides comfortable living spaces filled with natural light. Don't miss this opportunit
Key facts
- Natural light
- Open layout
- 1 acre
Tags
Property features AI
Finance
- Other: Property treated as residential; Property subtype: Mobile Home; Parcel number: 126445100361
- Financial info: Listing is For Sale; Listing agreement: Exclusive Right To Sell
- HOA & community: No homeowners association
Exterior
- Parking: No garage; No covered or carport spaces; Other parking features
- Utilities: Well water; Co-op electric
- Home design: Residential mobile home; Attached; One level; Built in 1998
- Construction: Year built 1998
- Exterior features: Approximately 1.03-acre lot; Will not subdivide; Subdivision: B Fielderdale Farms; Lot in Johnson County
Interior
- Kitchen: Dishwasher; Garbage disposal; Electric range
- Bedrooms: 3 bedrooms (primary bedroom on main level)
- Bathrooms: 2 full bathrooms
- Heating & cooling: Electric heating; Electric cooling
- Interior features: Granite counters; One living area; One dining area; Two total bathrooms; Rooms listed as 2
Neighborhood map
What this means for you Summary
Snapshot
- This is a 3-bed/2.0-bath manufactured listed at $240k.
Deal economics
- At list price, monthly cash flow is $57 ($678/yr) — positive.
- The deal already cash-flows at list — no discount required.
- To meet the 1% rule (rent ≥ 1% of price), the offer needs to be $216k (9.8% below list).
- Recommended offer: $216k (9.8% below list) — sets the bar for 1% rule.
- Cap rate 6.6% vs local median 3.0% in Venus — top-decile yield for the area; either an underpriced asset or a hidden risk that comps aren't pricing in. Stress-test before assuming the spread holds.
Location & tenants
- Location reads 70/100 on livability (#356 in TX) — a middle-class / working-renter tenant base. Strengths: crime A+, employment A+, cost of living A+; Watch: amenities F, commute F, health & safety F.
- Venus ISD (town): math 25% / reading 32% proficiency, ranked #646 of 826 in TX (top 78%) — low school quality limits family demand, transient renter base, plan for 1-2y turnover; 60% free/reduced lunch — lower-income household profile, screen leases tightly.
- Zoned schools: Venus El (math 27% / reading 30%, grade F, #2,706 of 4,322 statewide, top 63%, 658 students, 82% FRL) — zoned schools average 82% FRL vs 60% district-wide (22 pts higher); higher-poverty schools than district average — tighter screening recommended.
- Market conditions: Rents rising (+2.4%/yr); 428 active listings in the ZIP; solid renter incomes; 2,152 units permitted in Johnson County in 2024 (76 in 5+ unit buildings).
Forward outlook
- In year one you build about $19k of equity ($2k loan paydown + $18k appreciation (7.3% local appreciation)).
- Johnson County population projected at +24% by 2050 — long-run rental-demand tailwind backs the buy-and-hold thesis.
- At projected returns (7.3% appreciation + 2.4% rent growth), your $67k cash investment doubles in ~4 years — after that, you're playing with house money.
- By year 2, paydown + projected appreciation supports a ~$31k cash-out refi (75% LTV) — recoverable capital for the next deal without selling this one.
Negotiation context
- Only 10 days on market — expect competitive offers; lowballing is unlikely to land.
Risks & watch-outs
- Climate carrying-cost: major wind risk, 27% chance of damaging wind over 30y; moderate wildfire risk; extreme-heat days projected 7→23/yr by 2055 (HVAC capex compounding) — expect insurance premiums to compound above CPI over the hold.
Questions for the listing agent
- Is there a deadline driving the sale (1031 exchange, divorce, estate, relocation)? That informs how much negotiation room exists.
- Schools are D-rated, which usually means shorter tenancies and higher turnover. Who's the typical renter profile here, and what's been the actual vacancy rate?
- What's the average days-on-market for RENTAL listings here right now (not sales)? A rising rental-DOM trend means longer vacancies and softer asking-rent achievability than the comps imply.
- What's the recent tenant-quality profile in this submarket — average credit score on applications, eviction rate, late-payment / NSF rate, and stable-employment percentage? A property-management company in the area should have these aggregated.
- How much new for-sale + rental construction is in the pipeline within 1–3 miles? Heavy new supply typically softens prices + rents 12–24 months out; constrained supply supports both.
Investment metrics
- 1% rule
- 0.90% ✗
- Cap rate
- 6.58%
- Cash-on-cash
- 1.01%
- DSCR
- 1.04
- GRM
- 9.2
CMA / ARV
- ARV (on-the-fly)
- $305,312
- Comps found
- 2
Show comp detail 2 sales within ~0.75 mi
| Address | Dist | Beds/Ba | Sqft | Sold | Price | $/sf | Match |
|---|---|---|---|---|---|---|---|
| 4105 Adriels Ln | 0.44mi | 3/2.0 | 1,484 (-9%) | 19mo | $279,000 | $188 | 50 |
| 11224 Pikes Peak Dr | 0.73mi | 3/2.0 | 1,403 (-14%) | 23mo | $219,000 | $156 | 24 |
Match score weights: distance 35% · size 25% · config 20% · recency 20%. Top-matched comps best support the ARV.
Projected returns pro-forma
7.32% appreciation · 2.39% rent growth · sell at horizon
- IRR
- 19.0%
- Equity multiple
- 2.35×
- Total profit
- $90,827
- Equity at exit
- $171,293
- IRR
- 17.8%
- Equity multiple
- 4.85×
- Total profit
- $258,322
- Equity at exit
- $330,059
Cash invested: $67,172 (down + closing). Projections, not guarantees.
Landlord ↔ Tenant lean methodology
- Overall (STATE)
- 87 Strongly Landlord-Friendly
- State Texas
- 87 Strongly Landlord-Friendly · R+5
- County
- — inherits STATE
- City
- — inherits STATE
ZIP-level market 76084
- Home prices YoY
- 2.1%
- Rents YoY
- 2.4%
- Active inventory
- 428
- Price-to-rent
- 9.2×
Monthly cashflow live
- Estimated rent
- $2,164 medium interval (Pro) →
- Mortgage (P&I)
- −$1,258
- Tax from tax record
- −$295 /mo · $3,541/yr
- Insurance
- −$100
- HOA
- −$0
- Vacancy / Maint / Mgmt
- −$454
- Net cashflow
- $57
Break-even live
Sensitivity live
| Price | -10% $192 | -5% $124 | +0% $57 | +5% $-11 | +10% $-79 |
|---|---|---|---|---|---|
| Rent | -10% $-114 | -5% $-29 | +0% $57 | +5% $142 | +10% $227 |
| Rate | -1.0pp $177 | -0.5pp $118 | base $57 | +0.5pp $-6 | +1.0pp $-69 |
UW: 25.0% down · 7.5% · 30yr · 1.5% tax · 5.0% vac · 8.0% maint · 8.0% mgmt
Financing live
Cash to close
- Down payment
- $59,975
- Closing costs
- $7,197
- Reserves months
- —
- Total cash needed
- —
Loan-product check · same deal, 3 products live
Conventional
25% down · 7.5% · 30yr
- Down + closing
- —
- Monthly P&I
- —
- Monthly cashflow
- —
- DSCR
- —
- Eligible?
- —
Personal DTI + credit; lowest rate.
DSCR
20% down · 8.5% · 30yr
- Down + closing
- —
- Monthly P&I
- —
- Monthly cashflow
- —
- DSCR
- —
- Eligible?
- —
No personal income docs; deal must DSCR.
Hard money
10% down · 12.0% · 12mo
- Down + closing
- —
- Monthly P&I
- —
- Monthly cashflow
- —
- DSCR
- —
- Eligible?
- —
Short-term bridge; refi at stabilization.
Listing history 8 events
-
2026-06-21days on market $239,900 Active 10 DOM
-
2026-06-18days on market $239,900 Active 7 DOM
-
2026-06-17days on market $239,900 Active 6 DOM
-
2026-06-16days on market $239,900 Active 5 DOM
-
2026-06-15days on market $239,900 Active 4 DOM
-
2026-06-13days on market $239,900 Active 2 DOM
-
2026-06-13remarks 699-char remark
-
2026-06-13$239,900 Active 1 DOM
ⓘ Source: listings_history table (triggers on properties + properties_extension) + one-shot
backfill from property_details.listing_events for pre-trigger history.
Tax reassessment forecast TX · Resets to sale price
- Current annual tax
- $3,541 · $295/mo
- Projected year-2 tax
- $4,390 · $366/mo
- Expected delta
- +$849/yr (+$71/mo · 24.0%)
ⓘ Screening estimate from a state-policy table — verify with the county assessor before closing.
Climate risk First Street
- Flood 1/10 Low FEMA zone X (unshaded) · 0% chance over 30 yrs
- Wildfire 5/10 Major
- Heat 7/10 Severe 7 d/yr ≥110°F today · 23 d/yr by 30 yrs out
- Wind 6/10 Major 27% chance of damaging wind over 30 yrs
- Air quality 2/10 Low 2 unhealthy d/yr today · 2 by 30 yrs out
Nearby sold comps map
Loading sold comps map…
Walkable amenities ~0.75 mi
Loading nearby amenities…
Taxation est. · year 1
- Rental income
- $25,969
- − Mortgage interest
- −$13,438
- − Property taxes
- −$3,541
- − Insurance
- −$1,200
- − Repairs & maintenance
- −$2,078
- − Management
- −$2,078
- − Depreciation
- −$6,979
- Taxable loss
- −$3,344
- Est. tax savings @ 24.0%
- +$802
- After-tax cash flow
- $1,481/yr
For passive investors: Depreciation is non-cash, so a rental often shows a tax loss while cash-flowing — sheltering income. Rental losses are passive: they offset passive income freely, and up to $25,000/yr can offset ordinary (W-2) income if you actively participate and your MAGI is under $100k (phasing out to $0 by $150k); unused losses carry forward. On sale, claimed depreciation is recaptured at up to 25%, and gains may owe capital-gains tax (a 1031 exchange can defer both). Figures are a year-1 estimate at your 24.0% rate — not tax advice; consult a CPA.
Schools (NCES district)
- District
- Venus ISD
- NCES district ID
- 4844010
- Math proficiency
- 25% ▼ -15.00%
- Reading proficiency
- 32% ▼ -2.00%
- Median HH income
- $50,394
- Composite
- 24.97/100
- National rank
- #7563
- State rank
- #646 of 826 in TX
Livability — Venus
- Score
- 70/100
- State rank
- #356
- US rank
- #7724
Category grades
Schools grade is shown separately in the Schools card above.
Census & demographics
- County
- Johnson County · 147,987 people
- Metro
- Dallas-Fort Worth-Arlington, TX
- Population (ZIP)
- 14,097
- Household income
- $102,115
- Rent vs Own
- Severe rent burden
- 70.0
Population outlook (Johnson County) Hauer SSP2
- Today (2025)
- 179,678 people
- By 2030
- 189,208 · +5.3%
- By 2040
- 207,261 · +15.4%
- By 2050
- 223,064 · +24.1%
- By 2075
- 259,979 · +44.7%
- By 2100
- 275,395 · +53.3%
Race, ethnicity, and origin ACS 2023
- Neighborhood character
- Diverse neighborhood (Simpson 0.63)
- Race & ethnicity
- White 52% Hispanic / Latino 30% Two or more races 24% Black 11% Asian 1%
- Hispanic origin (detail)
- Mexican 25% Puerto Rican 1%
- Common ancestry
- Romanian 2% Lithuanian 1% Slovak 1%
- Foreign-born
- 8% · Canada
- Languages at home
- 78% English-only · Spanish 18% Arabic 1% French/Haitian/Cajun 1%
Political lean MEDSL · Johnson
- 2024 margin
- Solid R (+51.4) · D 23.9% · R 75.3%
- 2008→2024 swing
- -3.9pp toward R · 2008: -47.5pp · 2024: -51.4pp
- All cycles
- 2024: R+51.4 2020: R+53.0 2016: R+58.3 2012: R+55.6 2008: R+47.5
Not yet ingested
- Civics
- —
Market trends
- HPI YoY
- ▲ 7.32%
- Current HPI
- 355.74
- Rent YoY
- ▲ 2.39%
- Metro
- Dallas-Fort Worth-Arlington, TX
- State GDP YoY
- ▲ 3.95%
- F500 in state
- 110
Industry mix (Fortune 500 HQ in TX)
| Industry | F500 HQs | Revenue |
|---|---|---|
| Energy | 16 | $1,198B |
|
||
| Technology | 5 | $198B |
|
||
| Engineering / Construction | 4 | $72B |
|
||
| Energy Services | 3 | $60B |
|
||
| Utilities | 3 | $41B |
|
||
| Healthcare | 2 | $330B |
|
||
Price history
2 events — show timeline
- 2026-06-11 Listed $239,900 NTREIS
- 2000-05-11 Sold (Public Records) — Public Records
Property tax history
+8.7%/yrLatest (2025): $3,541 · +5.0% YoY. Source: county tax records.
Cash-flow waterfall
monthlySold comps — $/sqft
last 12 mo · ≤1 miLoading sold comps…