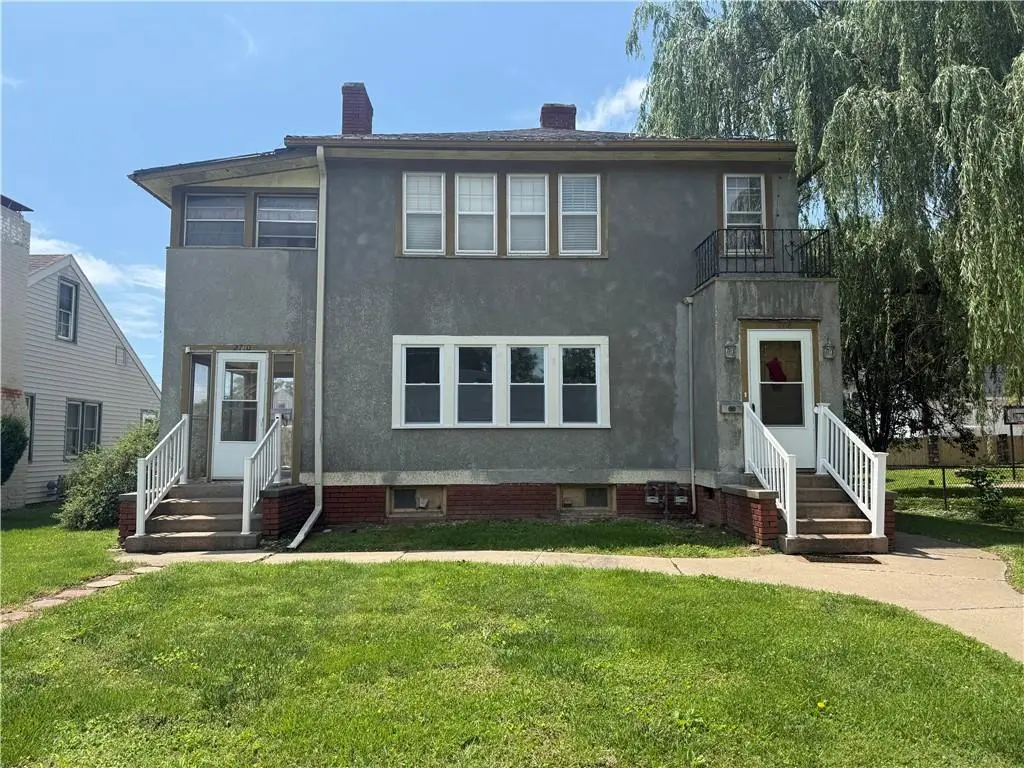
 Duplex
2708 - 2710 Faraon St · St. Joseph, MO
Flood risk 5/10 · Moderate
- FEMA flood zone
- X
- Chance of flooding over 30 yrs
- 0.24%
- Est. flood insurance / yr
- $473 – $860
Fire risk 1/10 · Minimal
- Est. fire insurance / yr
- $1,054 – $1,958
Heat risk 4/10 · Minor
- Hot days now (above 106°F)
- 7 days/yr
- Hot days in 30 yrs
- 16 days/yr
Wind risk 2/10 · Minimal
- Chance of severe wind over 30 yrs
- —
Air-quality risk 2/10 · Minimal
- Unhealthy air days now
- 1 days/yr
- Unhealthy air days in 30 yrs
- 1 days/yr
Risk factors via First Street. Map © Google.
Why this score? — see what drove the F grade
The composite is a weighted blend of 9 inputs, each scored 0–100. Each bar is that input's sub-score; the figure is the points it added to the 100-point composite (weight × sub-score).
- Cash flow +10.4/30.0
- ARV discount +7.5/15.0
- DSCR +3.0/10.0
- Schools +2.8/10.0
- Rent growth +2.5/5.0
- Livability +2.5/5.0
- Condition / age +2.5/5.0
- 1% rule +2.0/10.0
- Appreciation +0.0/10.0
$240,000
🖨 Deal sheet 📄 Offer letter ✓ Due diligence
Multi-family units
County records classify this as Multi-Family (2-4 Unit). Listing-text estimate: 2 units. confirmed
Listing remarks MLS
This Duplex with basement and off street parking for each side is aways rented. Tenants for both units are on yearly leases and they pay for all of their own utilities while landlord pays for trash and lawn care.
Key facts
- 5,662 sq ft lot
- Garage
- Built 1912
Property features AI
Finance
- Other: Zoning: r-4; Not in a flood plain; Lot roughly 0.13 acres (50 x 112); Inside city limits
- Financial info: Gross income reported at $17,400; Operating expenses include other items
- HOA & community: No association fees; Maintenance provided includes building exterior, HVAC, and lawn
Exterior
- Parking: Direct access garage with space for 2 vehicles
- Utilities: Public water; Public sewer; Electric service (other); Individual heating and air; Individual water heaters
- Home design: Residential income property; Duplex; Two-story
- Construction: Stucco and frame construction; Composition roof
- Exterior features: Paved road access; Public maintenance for road
Interior
- Kitchen: Range/oven; Refrigerator
- Bedrooms: Two-bedroom unit types (multiple units)
- Bathrooms: One bathroom in each unit type
- Heating & cooling: Forced air heating; Electric cooling with multiple units
- Interior features: Storm windows; Range/oven and refrigerator included
- Laundry & utility: Laundry located in the basement
Neighborhood map
What this means for you Summary
Snapshot
- This is a 2 × 2-bed/1.0-bath units multifamily listed at $240k.
Deal economics
- At list price, monthly cash flow is $-127 ($-2k/yr) — negative. Per door: $-64/mo.
- To cash-flow at today's rent, offer at most $218k (9.3% below list).
- To meet the 1% rule (rent ≥ 1% of price), the offer needs to be $169k (29.6% below list).
- Recommended offer: $169k (29.6% below list) — sets the bar for 1% rule.
- Cap rate 5.7% vs local median 4.7% in St. Joseph — meaningfully above typical; check what's discounted (condition, days-on-market, listing class) to confirm the premium yield is real.
Location & tenants
- Location reads: area grade F — affects rentability + tenant quality, not the cash-flow math above.
- St. Joseph (urban): math 28% / reading 38% proficiency, ranked #241 of 324 in MO (top 74%) — families likely to look elsewhere, expect single-tenant / working-renter base with shorter leases.
- Market conditions: 97 active listings in the ZIP; 9 comparable units currently listed for rent nearby; rentals lingering (median 44d on market — plan ~5-8 weeks vacancy on turnover, expect pricing pressure); 100% of comp listings sitting > 30 days — soft ceiling on asking rent; 70 units permitted in Buchanan County in 2024 (0 in 5+ unit buildings).
- This rent runs 43% of the median local income ($47k/yr) — at the standard rent-burdened threshold; future hikes will face affordability resistance.
Forward outlook
- Local home prices are declining (-3.0%/yr); year-one equity from $2k of loan paydown is wiped out by about $7k of value loss. Plan a longer hold.
- Buchanan County population projected to shrink 6% by 2050 — rents likely to lag national; underwrite the cash flow, not the appreciation.
Negotiation context
- Only 8 days on market — expect competitive offers; lowballing is unlikely to land.
- 5 sale attempts since 10y ago with the ask held roughly flat each time — persistent listings suggest the price (not the market) is what's stuck; bring a comps-based counter.
- Current owner paid $160k; list at $240k implies a 50% gain — meaningful room to come down on a strong offer.
Risks & watch-outs
- Watch-outs: built in 1912 — expect roof / HVAC / electrical / plumbing capex.
- Climate carrying-cost: moderate flood risk — expect insurance premiums to compound above CPI over the hold.
Questions for the listing agent
- What do current leases actually rent for vs. the listed asking? Can we see a recent rent roll and the last 12 months of T-12 income?
- Can we see the unit-by-unit rent roll, current vacancy, and any below-market leases? What's the average tenancy length?
- What capital expenditures (roof, boiler, parking lot, exteriors) have been made in the last 5 years, and what's planned in the next 2?
- Built in 1912 — when were the roof, HVAC, electrical panel, plumbing, and water heater last replaced?
- Is there a deadline driving the sale (1031 exchange, divorce, estate, relocation)? That informs how much negotiation room exists.
- The area grade is low — what's the realistic commute time and amenity access for the typical tenant pool here? Any planned neighborhood developments (good or bad) we should know about?
- What's the average days-on-market for RENTAL listings here right now (not sales)? A rising rental-DOM trend means longer vacancies and softer asking-rent achievability than the comps imply.
- What's the recent tenant-quality profile in this submarket — average credit score on applications, eviction rate, late-payment / NSF rate, and stable-employment percentage? A property-management company in the area should have these aggregated.
- How much new apartment / multifamily construction is in the pipeline within 1–3 miles? Heavy new supply (>2% of stock underway) typically softens rents 12–24 months out; light construction supports rent growth.
Investment metrics
- 1% rule
- 0.70% ✗
- Cap rate
- 5.66%
- Cash-on-cash
- -2.27%
- DSCR
- 0.90
- GRM
- 11.8
CMA / ARV
No comps found within radius.
Projected returns pro-forma
-3.0% appreciation · 3.0% rent growth · sell at horizon
- IRR
- -20.1%
- Equity multiple
- 0.30×
- Total profit
- $-47,075
- Equity at exit
- $35,785
- IRR
- -13.2%
- Equity multiple
- 0.23×
- Total profit
- $-51,796
- Equity at exit
- $20,751
Cash invested: $67,200 (down + closing). Projections, not guarantees.
Landlord ↔ Tenant lean methodology
- Overall (STATE)
- 81 Strongly Landlord-Friendly
- State Missouri
- 81 Strongly Landlord-Friendly · R+10
- County
- — inherits STATE
- City
- — inherits STATE
ZIP-level market 64501
- Active inventory
- 97
- Price-to-rent
- 23.7×
Monthly cashflow live
- Estimated rent
- $1,690 high interval (Pro) →
- Mortgage (P&I)
- −$1,259
- Tax from tax record
- −$104 /mo · $1,242/yr
- Insurance
- −$100
- HOA
- −$0
- Vacancy / Maint / Mgmt
- −$355
- Net cashflow
- $-127
Break-even live
2-unit breakdown (identical units grouped — click to expand)
| Units | Beds | Baths | Est. rent |
|---|---|---|---|
| 2× units | 2 | 1 | $1,690 |
| #1 | 2 | 1 | $845 |
| #2 | 2 | 1 | $845 |
| Total (2 units) | $1,690 | ||
UW: 25.0% down · 7.5% · 30yr · 1.5% tax · 5.0% vac · 8.0% maint · 8.0% mgmt
Financing live
Cash to close
- Down payment
- $60,000
- Closing costs
- $7,200
- Reserves months
- —
- Total cash needed
- —
Loan-product check · same deal, 3 products live
Conventional
25% down · 7.5% · 30yr
- Down + closing
- —
- Monthly P&I
- —
- Monthly cashflow
- —
- DSCR
- —
- Eligible?
- —
Personal DTI + credit; lowest rate.
DSCR
20% down · 8.5% · 30yr
- Down + closing
- —
- Monthly P&I
- —
- Monthly cashflow
- —
- DSCR
- —
- Eligible?
- —
No personal income docs; deal must DSCR.
Hard money
10% down · 12.0% · 12mo
- Down + closing
- —
- Monthly P&I
- —
- Monthly cashflow
- —
- DSCR
- —
- Eligible?
- —
Short-term bridge; refi at stabilization.
Rent comps 9 comps
| Address | Beds | Baths | Sqft | Rent | $/sqft | DOM | Units | Dist |
|---|---|---|---|---|---|---|---|---|
| 2408 Jules St Saint Joseph, MO | 2.0 | 1.0 | 1032 | $1,100 | $1.07 | 43d | 1 | 0.28mi |
| 917 N 24th St Unit 1 St Joseph, MO | 2.0 | 1.0 | 933 | $925 | $0.99 | 43d | 1 | 0.54mi |
| 3128 Midland St Saint Joseph, MO | 2.0 | 1.0 | 1104 | $975 | $0.88 | 43d | 1 | 0.64mi |
| 2901 Frederick Ave Saint Joseph, MO | 2.0–3.0 | 1.0 | 900 | $835 | $0.93 | 43d | 1 | 0.67mi |
| 303 S 13th St St Joseph, MO | 3.0 | 1.5 | 1000 | $950 | $0.95 | 43d | 1 | 1.00mi |
| 1616 S 25th St Saint Joseph, MO | 3.0 | 1.0 | 1500 | $1,300 | $0.87 | 43d | 1 | 1.21mi |
| 516 N 10th St Saint Joseph, MO | 1.0–2.0 | 1.0 | 700 | $900 | $1.29 | 43d | 1 | 1.21mi |
| 1300 S 11th St Apt 605 St Joseph, MO | 2.0 | 2.0 | 1141 | $940 | $0.82 | 43d | 1 | 1.48mi |
| 1300 S 11th St Apt 603 St Joseph, MO | 2.0 | 2.0 | 1176 | $910 | $0.77 | 43d | 1 | 1.48mi |
Listing history 8 events
-
2026-06-19days on market $240,000 Active 8 DOM
-
2026-06-18days on market $240,000 Active 7 DOM
-
2026-06-17days on market $240,000 Active 6 DOM
-
2026-06-16days on market $240,000 Active 5 DOM
-
2026-06-15days on market $240,000 Active 4 DOM
-
2026-06-14days on market $240,000 Active 2 DOM
-
2026-06-12remarks 493-char remark
-
2026-06-12$240,000 Active 1 DOM
ⓘ Source: listings_history table (triggers on properties + properties_extension) + one-shot
backfill from property_details.listing_events for pre-trigger history.
Tax reassessment forecast MO · Resets to sale price
- Current annual tax
- $1,242 · $104/mo
- Projected year-2 tax
- $2,328 · $194/mo
- Expected delta
- +$1,086/yr (+$90/mo · 87.4%)
ⓘ Screening estimate from a state-policy table — verify with the county assessor before closing.
Climate risk First Street
- Flood 5/10 Major FEMA zone X · 24% chance over 30 yrs
- Wildfire 1/10 Low
- Heat 4/10 Moderate 7 d/yr ≥106°F today · 16 d/yr by 30 yrs out
- Wind 2/10 Low
- Air quality 2/10 Low 1 unhealthy d/yr today · 1 by 30 yrs out
Nearby sold comps map
Loading sold comps map…
Walkable amenities ~0.75 mi
Loading nearby amenities…
Taxation est. · year 1
- Rental income
- $20,280
- − Mortgage interest
- −$13,444
- − Property taxes
- −$1,242
- − Insurance
- −$1,200
- − Repairs & maintenance
- −$1,622
- − Management
- −$1,622
- − Depreciation
- −$6,982
- Taxable loss
- −$5,833
- Est. tax savings @ 24.0%
- +$1,400
- After-tax cash flow
- $-124/yr
For passive investors: Depreciation is non-cash, so a rental often shows a tax loss while cash-flowing — sheltering income. Rental losses are passive: they offset passive income freely, and up to $25,000/yr can offset ordinary (W-2) income if you actively participate and your MAGI is under $100k (phasing out to $0 by $150k); unused losses carry forward. On sale, claimed depreciation is recaptured at up to 25%, and gains may owe capital-gains tax (a 1031 exchange can defer both). Figures are a year-1 estimate at your 24.0% rate — not tax advice; consult a CPA.
Schools (NCES district)
- District
- St. Joseph
- NCES district ID
- 2927060
- Math proficiency
- 28% ▼ -6.00%
- Reading proficiency
- 38% ▼ -1.00%
- Median HH income
- $43,007
- Composite
- 27.99/100
- National rank
- #6853
- State rank
- #241 of 324 in MO
Livability — St. Joseph
No livability data for this city. (Only ~50 U.S. cities are tracked.)
Census & demographics
- Census place
- St. Joseph, MO
- County
- Buchanan County · 32,150 people
- City population
- 44,382
- Metro
- St. Joseph, MO-KS
- Population (ZIP)
- 10,689
- Household income
- $46,731
- Rent vs Own
- Severe rent burden
- 721.0
Population outlook (Buchanan County) Hauer SSP2
- Today (2025)
- 89,041 people
- By 2030
- 88,401 · -0.7%
- By 2040
- 86,220 · -3.2%
- By 2050
- 83,603 · -6.1%
- By 2075
- 76,750 · -13.8%
- By 2100
- 67,623 · -24.1%
Race, ethnicity, and origin ACS 2023
- Neighborhood character
- Predominantly White (69%)
- Race & ethnicity
- White 69% Black 12% Hispanic / Latino 11% Two or more races 9%
- Hispanic origin (detail)
- Mexican 6% Puerto Rican 1%
- Common ancestry
- Italian 3% Romanian 1% Slovak 1%
- Foreign-born
- 7% · Canada, China
- Languages at home
- 89% English-only · Spanish 7% Arabic 1%
Political lean MEDSL · Buchanan
- 2024 margin
- Strong R (+28.0) · D 35.2% · R 63.3% · Other 1.5%
- 2008→2024 swing
- -28.2pp toward R · 2008: 0.1pp · 2024: -28.0pp
- All cycles
- 2024: R+28.0 2020: R+24.6 2016: R+26.2 2012: R+8.7 2008: D+0.1
Not yet ingested
- Civics
- —
Market trends
- HPI YoY
- ▼ -150.20%
- Current HPI
- 157.8706
- Rent YoY
- —
- Metro
- St. Joseph, MO-KS
- State GDP YoY
- ▲ 1.84%
- F500 in state
- 20
Industry mix (Fortune 500 HQ in MO)
| Industry | F500 HQs | Revenue |
|---|---|---|
| Healthcare | 1 | $163B |
|
||
| Insurance | 1 | $21B |
|
||
| Industrial Technology | 1 | $17B |
|
||
| Retail | 1 | $16B |
|
||
| Industrial Distribution | 1 | $10B |
|
||
| Utilities | 1 | $9B |
|
||
Price history
+92.0% since first listed15 events — show timeline
- 2026-06-11 Rental Removed $950 APPFOLIO
- 2026-06-11 Listed $240,000 Heartland MLS as Distributed by MLS Grid
- 2026-06-05 Price Changed $950 APPFOLIO
- 2026-05-20 Listed for Rent $1,000 APPFOLIO
- 2023-09-11 Sold (Public Records) $160,000 Public Records
- 2023-09-07 Sold (MLS) — Heartland MLS as Distributed by MLS Grid
- 2023-04-27 Contingent — Heartland MLS as Distributed by MLS Grid
- 2023-04-07 Listed $177,000 Heartland MLS as Distributed by MLS Grid
- 2017-09-20 Sold (Public Records) — Public Records
- 2017-09-20 Sold (MLS) — Heartland MLS as Distributed by MLS Grid
- 2017-05-22 Listing Removed — Heartland MLS as Distributed by MLS Grid
- 2017-05-17 Listed $125,000 Heartland MLS as Distributed by MLS Grid
- 2016-05-02 Listed $125,000 Heartland MLS as Distributed by MLS Grid
- 2007-05-15 Sold (Public Records) — Public Records
- 2004-02-18 Sold (Public Records) — Public Records
Property tax history
+1.8%/yrLatest (2025): $1,242 · +10.1% YoY. Source: county tax records.
Cash-flow waterfall
monthlySold comps — $/sqft
last 12 mo · ≤1 miLoading sold comps…