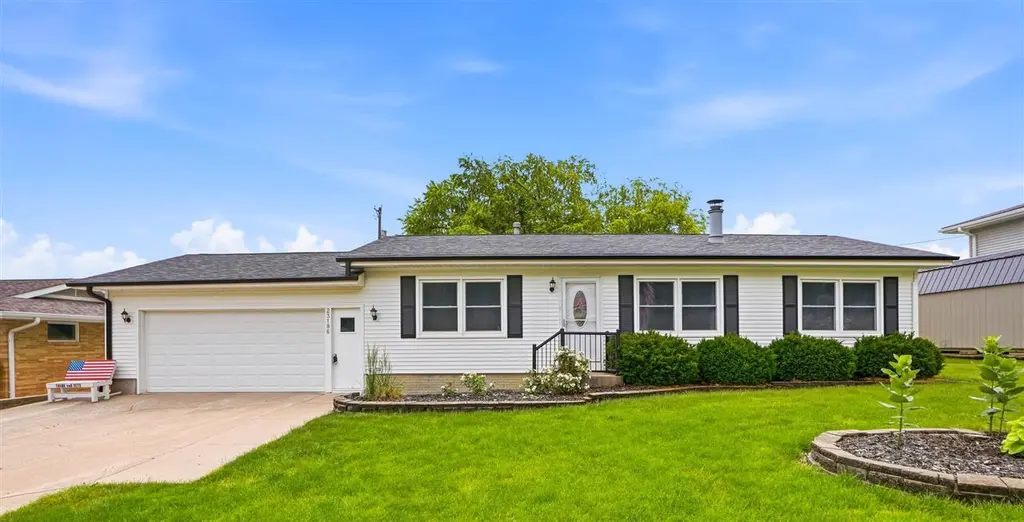
23186 207th Ave · Sigourney, IA
Flood risk 1/10 · Minimal
- FEMA flood zone
- X (unshaded)
- Chance of flooding over 30 yrs
- 0.0%
- Est. flood insurance / yr
- $473 – $860
Fire risk 4/10 · Minor
- Est. fire insurance / yr
- $902 – $1,676
Heat risk 3/10 · Minor
- Hot days now (above 105°F)
- 7 days/yr
- Hot days in 30 yrs
- 15 days/yr
Wind risk 2/10 · Minimal
- Chance of severe wind over 30 yrs
- —
Air-quality risk 2/10 · Minimal
- Unhealthy air days now
- 1 days/yr
- Unhealthy air days in 30 yrs
- 1 days/yr
Risk factors via First Street. Map © Google.
Why this score? — see what drove the D grade
The composite is a weighted blend of 9 inputs, each scored 0–100. Each bar is that input's sub-score; the figure is the points it added to the 100-point composite (weight × sub-score).
- Appreciation +10.0/10.0
- Cash flow +7.2/30.0
- Schools +6.1/10.0
- ARV discount +5.9/15.0
- Livability +4.0/5.0
- Rent growth +2.5/5.0
- Condition / age +2.5/5.0
- 1% rule +1.4/10.0
- DSCR +1.4/10.0
$197,500
🖨 Deal sheet (PDF) 📄 Offer letter ✓ Due diligence
Listing remarks MLS
Beautiful, ranch style home on spacious lot! Many updates including roof, windows, furnace, central air unit, flooring, bathroom remodel, and interior paint. The main level of the home features 3 bedrooms, 1 full bathroom, kitchen, dining room, and living room. The finished lower level features an open concept family room with gorgeous stone fireplace (wood burning), 2 non-conforming bedrooms (or bonus rooms), and 3/4 bathroom/laundry area. Laundry could easily be moved to main level if desired. Step onto the covered patio that overlooks the beautiful backyard, featuring a large storage shed (8x12) and firepit area. Attached 2 car garage. Includes refrigerator, stove, & dishwasher. Washer & dryer are negotiable. Schedule a showing today to see all what this home has to offer!
Key facts
- Large windows
- Pantry
- Patio doors
Tags
Property features AI
Finance
- HOA & community: Association fee billed annually; No community amenities listed
Exterior
- Parking: Attached garage with 2 parking spaces
- Utilities: Public water; Public sewer; Cable available
- Home design: Single-family residence; One story
- Construction: Vinyl siding; Frame construction
- Exterior features: Patio; Lot approximately 0.23 acres (80' x 125'); Residential zoning
Interior
- Kitchen: Dishwasher; Microwave; Refrigerator
- Flooring: Carpet
- Bathrooms: One full bathroom; One half bathroom
- Heating & cooling: Forced air heating; Central air; Ceiling fans
- Interior features: Wood-burning fireplace in the family room; Full basement with concrete floor
- Laundry & utility: Washer; Dryer; Laundry on main level
Neighborhood map
What this means for you Summary
Snapshot
- This is a 5-bed/1.5-bath single-family listed at $198k.
Deal economics
- At list price, monthly cash flow is $-270 ($-3k/yr) — negative.
- To cash-flow at today's rent, offer at most $150k (24.1% below list).
- To meet the 1% rule (rent ≥ 1% of price), the offer needs to be $126k (36.3% below list).
- Recommended offer: $126k (36.3% below list) — sets the bar for 1% rule.
Location & tenants
- Location reads 79/100 on livability (#108 in IA, #2,086 nationally) — a middle-class / working-renter tenant base. Strengths: crime A+, cost of living A+, housing A+; Watch: amenities F, commute F.
- Sigourney Community School District (rural): math 76% / reading 68% proficiency, ranked #122 of 289 in IA (top 42%) — strong family-tenant draw, lease renewals of 3-5y typical.
- Zoned schools: Sigourney Elementary (math 82% / reading 57%, grade A-, #224 of 616 statewide, top 42%, 323 students, 39% FRL); Sigourney Jr-Sr High Sch (math 72% / reading 75%, grade B+, #108 of 336 statewide, top 33%, 270 students, 34% FRL).
- Market conditions: 25 active listings in the ZIP; 1 units permitted in Keokuk County in 2024 (0 in 5+ unit buildings).
Forward outlook
- In year one you build about $21k of equity ($1k loan paydown + $20k appreciation (10.0% local appreciation)).
- Keokuk County population projected at -24% by 2050 — secular population decline; favor cash flow + early exit over multi-decade hold.
- By year 2, paydown + projected appreciation supports a ~$34k cash-out refi (75% LTV) — recoverable capital for the next deal without selling this one.
Negotiation context
- It's been on market 15 days — a 2% lower offer ($195k) is reasonable based on typical stale-listing flexibility.
- 2 sale attempts since 6y ago with the ask held roughly flat each time — persistent listings suggest the price (not the market) is what's stuck; bring a comps-based counter.
- Current owner paid $132k; 49% above their basis — modest negotiation headroom, anchor on the comps not their cost.
Questions for the listing agent
- What do current leases actually rent for vs. the listed asking? Can we see a recent rent roll and the last 12 months of T-12 income?
- Built in 1978 — when were the roof, HVAC, electrical panel, plumbing, and water heater last replaced?
- Is there a deadline driving the sale (1031 exchange, divorce, estate, relocation)? That informs how much negotiation room exists.
- Schools are A-rated — typically a magnet for longer-tenancy family renters. What's the average tenant stay here, and is there a school-zone premium baked into asking?
- The area grade is low — what's the realistic commute time and amenity access for the typical tenant pool here? Any planned neighborhood developments (good or bad) we should know about?
- What's the average days-on-market for RENTAL listings here right now (not sales)? A rising rental-DOM trend means longer vacancies and softer asking-rent achievability than the comps imply.
- What's the recent tenant-quality profile in this submarket — average credit score on applications, eviction rate, late-payment / NSF rate, and stable-employment percentage? A property-management company in the area should have these aggregated.
- How much new for-sale + rental construction is in the pipeline within 1–3 miles? Heavy new supply typically softens prices + rents 12–24 months out; constrained supply supports both.
Investment metrics
- 1% rule
- 0.64% ✗
- Cap rate
- 4.66%
- Cash-on-cash
- -5.85%
- DSCR
- 0.74
- GRM
- 13.1
CMA / ARV
- ARV (on-the-fly)
- $190,570
- Comps found
- 3
Show comp detail 3 sales within ~0.75 mi
| Address | Dist | Beds/Ba | Sqft | Sold | Price | $/sf | Match |
|---|---|---|---|---|---|---|---|
| 905 Mackey Ave | 0.42mi | 4/2.0 (-1) | 1,800 (-10%) | 11mo | $210,000 | $117 | 47 |
| 500 S Main St | 0.67mi | 5/2.0 | 2,236 (+12%) | 11mo | $212,500 | $95 | 38 |
| 621 W Pleasant Valley St | 0.73mi | 4/2.0 (-1) | 2,267 (+13%) | 22mo | $113,500 | $50 | 18 |
Match score weights: distance 35% · size 25% · config 20% · recency 20%. Top-matched comps best support the ARV.
Projected returns pro-forma
10.0% appreciation · 3.0% rent growth · sell at horizon
- IRR
- 20.1%
- Equity multiple
- 2.63×
- Total profit
- $90,352
- Equity at exit
- $177,924
- IRR
- 18.4%
- Equity multiple
- 6.05×
- Total profit
- $279,487
- Equity at exit
- $383,699
Cash invested: $55,300 (down + closing). Projections, not guarantees.
Landlord ↔ Tenant lean methodology
- Overall (STATE)
- 83 Strongly Landlord-Friendly
- State Iowa
- 83 Strongly Landlord-Friendly · R+6
- County
- — inherits STATE
- City
- — inherits STATE
ZIP-level market 52591
- Home prices YoY
- 22.5%
- Active inventory
- 25
- Price-to-rent
- 13.1×
Monthly cashflow live
- Estimated rent
- $1,257 medium interval (Pro) →
- Mortgage (P&I)
- −$1,036
- Tax from tax record
- −$145 /mo · $1,738/yr
- Insurance
- −$82
- HOA
- −$0
- Vacancy / Maint / Mgmt
- −$264
- Net cashflow
- $-270
Break-even live
Sensitivity live
| Price | -10% $-158 | -5% $-214 | +0% $-270 | +5% $-325 | +10% $-381 |
|---|---|---|---|---|---|
| Rent | -10% $-369 | -5% $-319 | +0% $-270 | +5% $-220 | +10% $-170 |
| Rate | -1.0pp $-170 | -0.5pp $-219 | base $-270 | +0.5pp $-321 | +1.0pp $-373 |
UW: 25.0% down · 7.5% · 30yr · 1.5% tax · 5.0% vac · 8.0% maint · 8.0% mgmt
Financing live
Cash to close
- Down payment
- $49,375
- Closing costs
- $5,925
- Reserves months
- —
- Total cash needed
- —
Loan-product check · same deal, 3 products live
Conventional
25% down · 7.5% · 30yr
- Down + closing
- —
- Monthly P&I
- —
- Monthly cashflow
- —
- DSCR
- —
- Eligible?
- —
Personal DTI + credit; lowest rate.
DSCR
20% down · 8.5% · 30yr
- Down + closing
- —
- Monthly P&I
- —
- Monthly cashflow
- —
- DSCR
- —
- Eligible?
- —
No personal income docs; deal must DSCR.
Hard money
10% down · 12.0% · 12mo
- Down + closing
- —
- Monthly P&I
- —
- Monthly cashflow
- —
- DSCR
- —
- Eligible?
- —
Short-term bridge; refi at stabilization.
Listing history 13 events
-
2026-06-21days on market $197,500 Active 15 DOM
-
2026-06-21days on market $197,500 Active 14 DOM
-
2026-06-18days on market $197,500 Active 12 DOM
-
2026-06-17days on market $197,500 Active 11 DOM
-
2026-06-17price $197,500 Active 10 DOM
-
2026-06-16days on market $205,000 Active 10 DOM
-
2026-06-15days on market $205,000 Active 9 DOM
-
2026-06-13days on market $205,000 Active 7 DOM
-
2026-06-12days on market $205,000 Active 6 DOM
-
2026-06-09days on market $205,000 Active 3 DOM
-
2026-06-08days on market $205,000 Active 2 DOM
-
2026-06-07remarks 675-char remark
-
2026-06-07$205,000 Active 1 DOM
ⓘ Source: listings_history table (triggers on properties + properties_extension) + one-shot
backfill from property_details.listing_events for pre-trigger history.
Tax reassessment forecast IA · Partial reset (capped growth)
- Current annual tax
- $1,738 · $145/mo
- Projected year-2 tax
- $2,419 · $202/mo
- Expected delta
- +$681/yr (+$57/mo · 39.2%)
ⓘ Screening estimate from a state-policy table — verify with the county assessor before closing.
Climate risk First Street
- Flood 1/10 Low FEMA zone X (unshaded) · 0% chance over 30 yrs
- Wildfire 4/10 Moderate
- Heat 3/10 Moderate 7 d/yr ≥105°F today · 15 d/yr by 30 yrs out
- Wind 2/10 Low
- Air quality 2/10 Low 1 unhealthy d/yr today · 1 by 30 yrs out
Nearby sold comps map
Loading sold comps map…
Walkable amenities ~0.75 mi
Loading nearby amenities…
Taxation est. · year 1
- Rental income
- $15,088
- − Mortgage interest
- −$11,063
- − Property taxes
- −$1,738
- − Insurance
- −$988
- − Repairs & maintenance
- −$1,207
- − Management
- −$1,207
- − Depreciation
- −$5,745
- Taxable loss
- −$6,860
- Est. tax savings @ 24.0%
- +$1,646
- After-tax cash flow
- $-1,588/yr
For passive investors: Depreciation is non-cash, so a rental often shows a tax loss while cash-flowing — sheltering income. Rental losses are passive: they offset passive income freely, and up to $25,000/yr can offset ordinary (W-2) income if you actively participate and your MAGI is under $100k (phasing out to $0 by $150k); unused losses carry forward. On sale, claimed depreciation is recaptured at up to 25%, and gains may owe capital-gains tax (a 1031 exchange can defer both). Figures are a year-1 estimate at your 24.0% rate — not tax advice; consult a CPA.
Schools (NCES district)
- District
- Sigourney Community School District
- NCES district ID
- 1926280
- Math proficiency
- 76% ▼ -7.00%
- Reading proficiency
- 68% ▼ -9.00%
- Median HH income
- $44,250
- Composite
- 60.52/100
- National rank
- #840
- State rank
- #122 of 289 in IA
Livability — Sigourney
- Score
- 79/100
- State rank
- #108
- US rank
- #2086
Category grades
Schools grade is shown separately in the Schools card above.
Census & demographics
- Population (ZIP)
- 2,646
Population outlook (Keokuk County) Hauer SSP2
- Today (2025)
- 9,354 people
- By 2030
- 8,885 · -5.0%
- By 2040
- 7,956 · -14.9%
- By 2050
- 7,123 · -23.9%
- By 2075
- 5,777 · -38.2%
- By 2100
- 4,808 · -48.6%
Race, ethnicity, and origin ACS 2023
- Neighborhood character
- Predominantly White (98%)
- Race & ethnicity
- White 98% Two or more races 1%
- Common ancestry
- Italian 3% English 2% Iranian 1%
- Foreign-born
- 1% · Canada
- Languages at home
- 96% English-only · German/W. Germanic 4%
Political lean MEDSL · Keokuk
- 2024 margin
- Solid R (+51.5) · D 23.7% · R 75.2% · Other 1.1%
- 2008→2024 swing
- -47.9pp toward R · 2008: -3.6pp · 2024: -51.5pp
- All cycles
- 2024: R+51.5 2020: R+44.9 2016: R+43.6 2012: R+10.4 2008: R+3.6
Not yet ingested
- Civics
- —
Market trends
- HPI YoY
- ▲ 47.08%
- Current HPI
- 256.0682
- Rent YoY
- —
- Metro
- —
- State GDP YoY
- ▲ 2.48%
- F500 in state
- 4
Industry mix (Fortune 500 HQ in IA)
| Industry | F500 HQs | Revenue |
|---|---|---|
| Financial Services | 1 | $16B |
|
||
| Retail / Convenience | 1 | $15B |
|
||
Price history
+113.5% since first listed6 events — show timeline
- 2026-06-06 Listed $205,000 ICAARMLS
- 2020-08-21 Sold (MLS) $132,500 IAR
- 2020-08-18 Sold (Public Records) $132,500 Public Records
- 2020-07-01 Listed $134,000 IAR
- 2015-07-06 Sold (Public Records) $100,000 Public Records
- 2006-09-22 Sold (Public Records) $96,000 Public Records
Property tax history
+3.0%/yrLatest (2025): $1,738 · -2.4% YoY. Source: county tax records.
Cash-flow waterfall
monthlySold comps — $/sqft
last 12 mo · ≤1 miLoading sold comps…