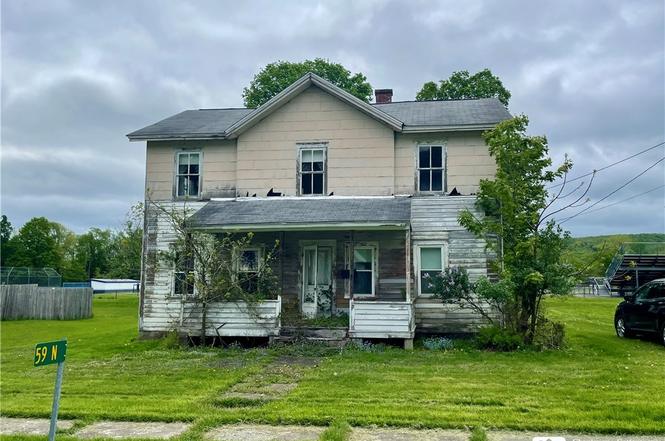
59 N Franklin St · Cattaraugus, NY
Flood risk 1/10 · Minimal
- FEMA flood zone
- X
- Chance of flooding over 30 yrs
- 0.0%
- Est. flood insurance / yr
- $473 – $860
Fire risk 1/10 · Minimal
- Est. fire insurance / yr
- $691 – $1,283
Heat risk 2/10 · Minimal
- Hot days now (above 90°F)
- 8 days/yr
- Hot days in 30 yrs
- 19 days/yr
Wind risk 1/10 · Minimal
- Chance of severe wind over 30 yrs
- —
Air-quality risk 2/10 · Minimal
- Unhealthy air days now
- 0 days/yr
- Unhealthy air days in 30 yrs
- 1 days/yr
Risk factors via First Street. Map © Google.
Why this score? — see what drove the A grade
The composite is a weighted blend of 9 inputs, each scored 0–100. Each bar is that input's sub-score; the figure is the points it added to the 100-point composite (weight × sub-score).
- Cash flow +30.0/30.0
- ARV discount +15.0/15.0
- 1% rule +10.0/10.0
- DSCR +10.0/10.0
- Appreciation +10.0/10.0
- Schools +3.9/10.0
- Livability +3.0/5.0
- Rent growth +2.5/5.0
- Condition / age +2.5/5.0
$57,000
🖨 Deal sheet (PDF) 📄 Offer letter ✓ Due diligence
Listing remarks
This property is being offered as is, where is, with clear title only being provided. Septic inspection and a survey if needed will be the responsibility of the purchaser. This is a large double lot, on a dead end Street, with the school property being directly behind it. The house has good floor space. Needing rehab, basically a shell ready for you to lay out how you would like. Ample square footage allows for multiple bedrooms and bathrooms. The basement stairs are broken/missing, please do not go down them. There is a large two-story barn with a concrete pad in the front for you to park your vehicle. Ample room for a garden and space to build a nice garage. All utilities are currently of
Key facts
- Concrete pad
- Large two story barn
- Built ins in kitchen
Tags
Neighborhood map
What this means for you Summary
Snapshot
- This is a 3-bed/1.0-bath single-family listed at $57k.
Deal economics
- At list price, monthly cash flow is $472 ($6k/yr) — positive.
- The deal already cash-flows at list — no discount required.
- Meets the 1% rule at list price ($1k rent vs $57k).
- Recommended offer: $50k (12.0% below list) — sets the bar for market timing.
Location & tenants
- Location reads 60/100 on livability (#973 in NY) — a middle-class / working-renter tenant base. Strengths: cost of living A+, housing A; Watch: employment C-, crime F, amenities F.
- Cattaraugus-Little Valley Central School District (rural): math 42% / reading 49% proficiency, ranked #460 of 590 in NY (top 78%) — families likely to look elsewhere, expect single-tenant / working-renter base with shorter leases.
- Zoned schools: Cattaraugus-Little Valley Elementary School (math 42% / reading 52%, grade D-, #1,195 of 2,108 statewide, top 60%, 334 students, 55% FRL); Cattaraugus-Little Valley Middle School (math 22% / reading 47%, grade F, #483 of 729 statewide, top 68%, 255 students, 53% FRL); Cattaraugus-Little Valley High School (math 92%, 251 students, 48% FRL).
- Market conditions: 21 active listings in the ZIP; 128 units permitted in Cattaraugus County in 2024 (21 in 5+ unit buildings).
Forward outlook
- In year one you build about $6k of equity ($394 loan paydown + $6k appreciation (10.0% local appreciation)).
- Cattaraugus County population projected at -28% by 2050 — secular population decline; favor cash flow + early exit over multi-decade hold.
- At projected returns (10.0% appreciation + 3.0% rent growth), your $16k cash investment doubles in ~2 years — after that, you're playing with house money.
- By year 6, paydown + projected appreciation supports a ~$36k cash-out refi (75% LTV) — recoverable capital for the next deal without selling this one.
Negotiation context
- It's been on market 225 days — a 12% lower offer ($50k) is reasonable based on typical stale-listing flexibility.
- 2 sale attempts; this cycle's ask has dropped $3k (5%) from the opening price — seller is motivated, your offer sets the floor, not the list.
Risks & watch-outs
- Watch-outs: built in 1900 — expect roof / HVAC / electrical / plumbing capex.
Questions for the listing agent
- It's been on market 225 days. Have you received any prior offers? Is the seller open to a 12% concession, seller financing, or rate buy-down credit?
- Built in 1900 — when were the roof, HVAC, electrical panel, plumbing, and water heater last replaced?
- Why hasn't it sold? Are there any deal-killer items the seller is aware of (foundation, flood, title, zoning, code violations)?
- Is there a deadline driving the sale (1031 exchange, divorce, estate, relocation)? That informs how much negotiation room exists.
- Crime grade is F in this area — have there been break-ins, vandalism, or insurance claims at this property in the last 3 years? What carrier currently insures it and at what premium?
- What's the average days-on-market for RENTAL listings here right now (not sales)? A rising rental-DOM trend means longer vacancies and softer asking-rent achievability than the comps imply.
- What's the recent tenant-quality profile in this submarket — average credit score on applications, eviction rate, late-payment / NSF rate, and stable-employment percentage? A property-management company in the area should have these aggregated.
- How much new for-sale + rental construction is in the pipeline within 1–3 miles? Heavy new supply typically softens prices + rents 12–24 months out; constrained supply supports both.
Investment metrics
- 1% rule
- 2.01% ✓
- Cap rate
- 16.23%
- Cash-on-cash
- 35.51%
- DSCR
- 2.58
- GRM
- 4.1
CMA / ARV
- ARV (on-the-fly)
- $99,864
- Comps found
- 5
Show comp detail 5 sales within ~0.75 mi
| Address | Dist | Beds/Ba | Sqft | Sold | Price | $/sf | Match |
|---|---|---|---|---|---|---|---|
| 133 Jefferson St | 0.30mi | 2/1.0 (-1) | 1,666 (-5%) | 2mo | $126,000 | $76 | 71 |
| 110 Waverly St | 0.40mi | 3/2.0 | 1,840 (+5%) | 6mo | $105,000 | $57 | 64 |
| 74 Leavenworth St | 0.52mi | 3/2.0 | 1,800 (+3%) | 23mo | $100,000 | $56 | 48 |
| 75 Washington St | 0.41mi | 3/2.0 | 1,536 (-12%) | 19mo | $155,000 | $101 | 41 |
| 5 1st St | 0.66mi | 4/1.5 (+1) | 1,646 (-6%) | 21mo | $69,000 | $42 | 34 |
Match score weights: distance 35% · size 25% · config 20% · recency 20%. Top-matched comps best support the ARV.
Projected returns pro-forma
10.0% appreciation · 3.0% rent growth · sell at horizon
- IRR
- 51.6%
- Equity multiple
- 4.83×
- Total profit
- $61,162
- Equity at exit
- $51,350
- IRR
- 45.2%
- Equity multiple
- 10.81×
- Total profit
- $156,543
- Equity at exit
- $110,738
Cash invested: $15,960 (down + closing). Projections, not guarantees.
Landlord ↔ Tenant lean methodology
- Overall (STATE)
- 15 Strongly Tenant-Friendly
- State New York
- 15 Strongly Tenant-Friendly · D+10
- County
- — inherits STATE
- City
- — inherits STATE
ZIP-level market 14719
- Home prices YoY
- 3.4%
- Active inventory
- 21
- Price-to-rent
- 4.1×
Monthly cashflow live
- Estimated rent
- $1,146 medium interval (Pro) →
- Mortgage (P&I)
- −$299
- Tax from tax record
- −$111 /mo · $1,329/yr
- Insurance
- −$24
- HOA
- −$0
- Vacancy / Maint / Mgmt
- −$241
- Net cashflow
- $472
Break-even live
Sensitivity live
| Price | -10% $504 | -5% $488 | +0% $472 | +5% $456 | +10% $440 |
|---|---|---|---|---|---|
| Rent | -10% $382 | -5% $427 | +0% $472 | +5% $518 | +10% $563 |
| Rate | -1.0pp $501 | -0.5pp $487 | base $472 | +0.5pp $457 | +1.0pp $442 |
UW: 25.0% down · 7.5% · 30yr · 1.5% tax · 5.0% vac · 8.0% maint · 8.0% mgmt
Financing live
Cash to close
- Down payment
- $14,250
- Closing costs
- $1,710
- Reserves months
- —
- Total cash needed
- —
Loan-product check · same deal, 3 products live
Conventional
25% down · 7.5% · 30yr
- Down + closing
- —
- Monthly P&I
- —
- Monthly cashflow
- —
- DSCR
- —
- Eligible?
- —
Personal DTI + credit; lowest rate.
DSCR
20% down · 8.5% · 30yr
- Down + closing
- —
- Monthly P&I
- —
- Monthly cashflow
- —
- DSCR
- —
- Eligible?
- —
No personal income docs; deal must DSCR.
Hard money
10% down · 12.0% · 12mo
- Down + closing
- —
- Monthly P&I
- —
- Monthly cashflow
- —
- DSCR
- —
- Eligible?
- —
Short-term bridge; refi at stabilization.
Listing history 5 events
-
2025-12-29status Pending
-
2025-11-18status Active
-
2025-11-14historical
-
2025-06-15price $57,000
-
2025-05-14$60,000 Active
ⓘ Source: listings_history table (triggers on properties + properties_extension) + one-shot
backfill from property_details.listing_events for pre-trigger history.
Tax reassessment forecast NY · Partial reset (capped growth)
- Current annual tax
- $1,329 · $111/mo
- Projected year-2 tax
- $1,329 · $111/mo
- Expected delta
- $0/yr ($0/mo · 0.0%)
ⓘ Screening estimate from a state-policy table — verify with the county assessor before closing.
Climate risk First Street
- Flood 1/10 Low FEMA zone X · 0% chance over 30 yrs
- Wildfire 1/10 Low
- Heat 2/10 Low 8 d/yr ≥90°F today · 19 d/yr by 30 yrs out
- Wind 1/10 Low
- Air quality 2/10 Low 0 unhealthy d/yr today · 1 by 30 yrs out
Nearby sold comps map
Loading sold comps map…
Walkable amenities ~0.75 mi
Loading nearby amenities…
Taxation est. · year 1
- Rental income
- $13,757
- − Mortgage interest
- −$3,193
- − Property taxes
- −$1,329
- − Insurance
- −$285
- − Repairs & maintenance
- −$1,101
- − Management
- −$1,101
- − Depreciation
- −$1,658
- Taxable income
- $5,091
- Est. tax owed @ 24.0%
- −$1,222
- After-tax cash flow
- $4,445/yr
For passive investors: Depreciation is non-cash, so a rental often shows a tax loss while cash-flowing — sheltering income. Rental losses are passive: they offset passive income freely, and up to $25,000/yr can offset ordinary (W-2) income if you actively participate and your MAGI is under $100k (phasing out to $0 by $150k); unused losses carry forward. On sale, claimed depreciation is recaptured at up to 25%, and gains may owe capital-gains tax (a 1031 exchange can defer both). Figures are a year-1 estimate at your 24.0% rate — not tax advice; consult a CPA.
Schools (NCES district)
- District
- Cattaraugus-Little Valley Central School District
- NCES district ID
- 3600024
- Math proficiency
- 42% ▼ -15.00%
- Reading proficiency
- 49% ▲ 3.00%
- Median HH income
- $45,623
- Composite
- 38.61/100
- National rank
- #4159
- State rank
- #460 of 590 in NY
Livability — Cattaraugus
- Score
- 60/100
- State rank
- #973
- US rank
- #19013
Category grades
Schools grade is shown separately in the Schools card above.
Census & demographics
- Census place
- Cattaraugus, NY
- Population (ZIP)
- 3,334
Population outlook (Cattaraugus County) Hauer SSP2
- Today (2025)
- 71,623 people
- By 2030
- 67,751 · -5.4%
- By 2040
- 59,488 · -16.9%
- By 2050
- 51,601 · -28.0%
- By 2075
- 35,025 · -51.1%
- By 2100
- 21,243 · -70.3%
Race, ethnicity, and origin ACS 2023
- Neighborhood character
- Predominantly White (94%)
- Race & ethnicity
- White 94% Hispanic / Latino 3% Two or more races 3%
- Common ancestry
- Romanian 9% Lithuanian 2% Slovak 1%
- Foreign-born
- 1% · Canada
- Languages at home
- 96% English-only · German/W. Germanic 3% Spanish 1%
Political lean MEDSL · Cattaraugus
- 2024 margin
- Solid R (+32.8) · D 33.6% · R 66.4%
- 2008→2024 swing
- -22.2pp toward R · 2008: -10.6pp · 2024: -32.8pp
- All cycles
- 2024: R+32.8 2020: R+29.5 2016: R+34.4 2012: R+13.4 2008: R+10.6
Not yet ingested
- Civics
- —
Market trends
- HPI YoY
- ▲ 10.94%
- Current HPI
- 331.9433
- Rent YoY
- —
- Metro
- —
- State GDP YoY
- ▲ 2.60%
- F500 in state
- 92
Industry mix (Fortune 500 HQ in NY)
| Industry | F500 HQs | Revenue |
|---|---|---|
| Financial Services | 10 | $950B |
|
||
| Consumer Goods | 9 | $162B |
|
||
| Insurance | 4 | $225B |
|
||
| Telecommunications | 2 | $144B |
|
||
| Pharmaceuticals | 2 | $112B |
|
||
| Media / Entertainment | 2 | $69B |
|
||
Price history
-5.0% since first listed5 events — show timeline
- 2025-12-29 Pending — UNYREIS
- 2025-11-18 Relisted — UNYREIS
- 2025-11-14 Listing Removed — UNYREIS
- 2025-06-15 Price Changed $57,000 UNYREIS
- 2025-05-14 Listed $60,000 UNYREIS
Property tax history
+5.7%/yrLatest (2025): $1,329 · +12.0% YoY. Source: county tax records.
Cash-flow waterfall
monthlySold comps — $/sqft
last 12 mo · ≤1 miLoading sold comps…