120 Bordic Rd · Lorane, PA
Flood risk No data
- FEMA flood zone
- —
- Chance of flooding over 30 yrs
- —
- Est. flood insurance / yr
- —
Fire risk No data
- Est. fire insurance / yr
- —
Heat risk No data
- Hot days now (above threshold)
- —
- Hot days in 30 yrs
- —
Wind risk No data
- Chance of severe wind over 30 yrs
- —
Air-quality risk No data
- Unhealthy air days now
- —
- Unhealthy air days in 30 yrs
- —
Risk factors via First Street. Map © Google.
Why this score? — see what drove the B+ grade
The composite is a weighted blend of 9 inputs, each scored 0–100. Each bar is that input's sub-score; the figure is the points it added to the 100-point composite (weight × sub-score).
- Cash flow +30.0/30.0
- ARV discount +15.0/15.0
- 1% rule +10.0/10.0
- DSCR +10.0/10.0
- Schools +4.5/10.0
- Livability +3.8/5.0
- Rent growth +2.5/5.0
- Condition / age +2.5/5.0
- Appreciation +0.0/10.0
$49,900
🖨 Deal sheet (PDF) 📄 Offer letter ✓ Due diligence
Listing remarks MLS
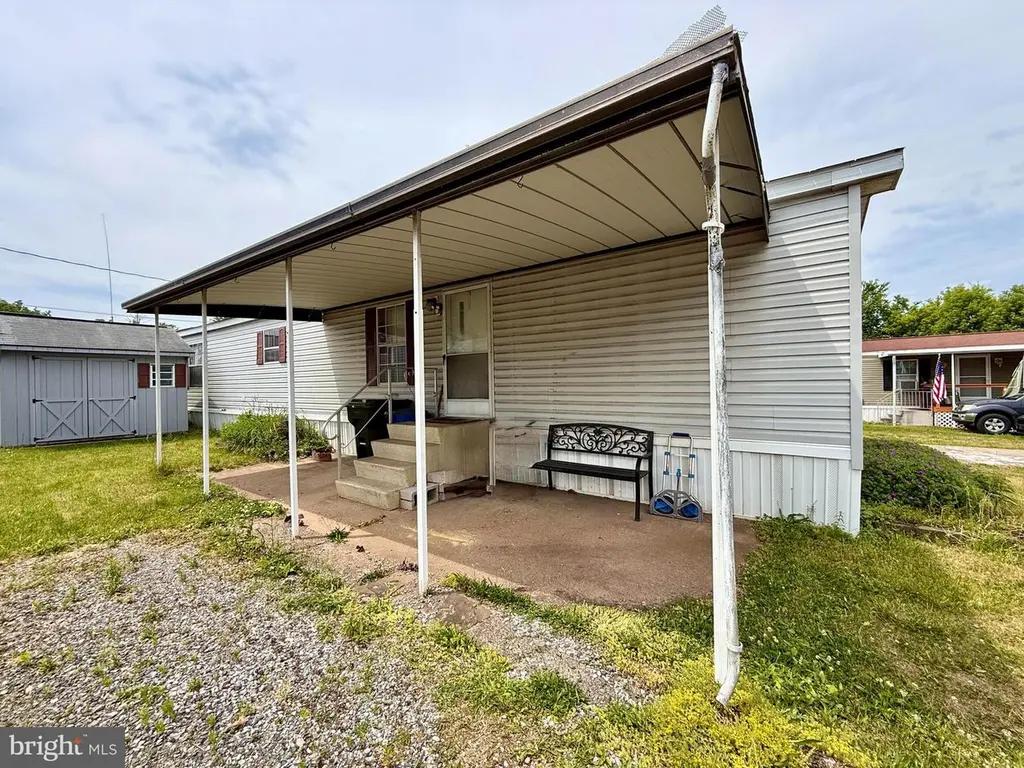
This is a really nice single-wide unit in excellent condition. The bedrooms are larger than most bedrooms in other units in this area. All appliances stay, and there's a covered patio. The shed is well constructed, quite large, and is in very good condition. Great place for really easy living in a tidy and convenient park community. $290 per month lot rent. Dogs not allowed, but cats are permitted. This unit has 6" walls and a roof shingled with "house" shingles. Is a 2000 Redman (manufactured by Tammac Corp. )
Key facts
- Spacious living area
- Covered patio area
- 6 parking spots
Tags
Property features AI
Finance
- Other: Property manager present; Not in a federal flood zone; Pets allowed with restrictions (breed, size/weight, case-by-case; pet addendum/deposit may apply); Building not winterized; Above-grade finished area reported by assessor
- Financial info: Ground rent exists; $470 monthly (ground rent payment); Ownership interest listed as ground rent
Exterior
- Parking: Six total garage/parking spaces; Driveway with three spaces; Three off-street spaces; On-street parking available; Crushed stone parking; Private parking
- Utilities: 100 Amp electric service; Electric available; Natural gas available; Cable TV available; Public sewer; Community water
- Home design: Manufactured single-wide home; Entry on level 1; Main entrance faces east; Very good condition
- Construction: Frame construction with vinyl siding; Shingle roof; Slab foundation; Year built per assessor
- Exterior features: Patio(s); Porch(es); Breezeway; Street lights; Shed; Private road responsibility; Concrete road surface
Interior
- Kitchen: Built-in range
- Bedrooms: Two bedrooms on the main level
- Bathrooms: One full bathroom; One half bathroom
- Heating & cooling: Forced air heating (electric); Electric cooling (other type); Electric hot water
- Interior features: Tub with shower; Breakfast area; Family room off the kitchen; Traditional floor plan; Eat-in kitchen
- Laundry & utility: Washer and dryer in unit (main floor)
Neighborhood map
What this means for you Summary
Snapshot
- This is a 2-bed/1.5-bath manufactured listed at $50k.
Deal economics
- At list price, monthly cash flow is $981 ($12k/yr) — positive.
- The deal already cash-flows at list — no discount required.
- Meets the 1% rule at list price ($2k rent vs $50k).
- Cap rate 29.9% vs local median 4.0% in Lorane — top-decile yield for the area; either an underpriced asset or a hidden risk that comps aren't pricing in. Stress-test before assuming the spread holds.
Location & tenants
- Location reads 75/100 on livability (#428 in PA, #3,912 nationally) — a middle-class / working-renter tenant base. Strengths: crime A+, housing A+, health & safety A+; Watch: amenities F, commute F.
- Exeter Township SD (suburban): math 41% / reading 60% proficiency, ranked #141 of 539 in PA (top 26%) — acceptable for families but not a draw, mixed tenant base, ~2y average lease.
- Zoned schools: Lorane El Sch (math 32% / reading 62%, grade D-, #737 of 1,518 statewide, top 52%, 451 students, 36% FRL); Reiffton Sch (math 37% / reading 66%, grade C, #109 of 512 statewide, top 22%, 612 students, 39% FRL); Exeter Twp Shs (math 74% / reading 24%, grade D, #149 of 437 statewide, top 34%, 1,286 students, 30% FRL).
- Market conditions: 166 active listings in the ZIP; 1 comparable units currently listed for rent nearby; solid renter incomes; 258 units permitted in Berks County in 2024 (27 in 5+ unit buildings).
Forward outlook
- Local home prices are declining (-3.0%/yr); year-one equity from $345 of loan paydown is wiped out by about $1k of value loss. Plan a longer hold.
- Berks County population projected at +3% by 2050 — modest demand growth; plan on rents tracking national, not racing it.
- At projected returns (-3.0% appreciation + 3.0% rent growth), your $14k cash investment doubles in ~2 years — after that, you're playing with house money.
Negotiation context
- Only 10 days on market — expect competitive offers; lowballing is unlikely to land.
- 8 sale attempts since 15y ago with the ask held roughly flat each time — persistent listings suggest the price (not the market) is what's stuck; bring a comps-based counter.
- Current owner paid $16k; list at $50k implies a 212% gain — meaningful room to come down on a strong offer.
Questions for the listing agent
- Is there a deadline driving the sale (1031 exchange, divorce, estate, relocation)? That informs how much negotiation room exists.
- Schools are F-rated, which usually means shorter tenancies and higher turnover. Who's the typical renter profile here, and what's been the actual vacancy rate?
- What's the average days-on-market for RENTAL listings here right now (not sales)? A rising rental-DOM trend means longer vacancies and softer asking-rent achievability than the comps imply.
- What's the recent tenant-quality profile in this submarket — average credit score on applications, eviction rate, late-payment / NSF rate, and stable-employment percentage? A property-management company in the area should have these aggregated.
- How much new for-sale + rental construction is in the pipeline within 1–3 miles? Heavy new supply typically softens prices + rents 12–24 months out; constrained supply supports both.
Investment metrics
- 1% rule
- 3.42% ✓
- Cap rate
- 29.88%
- Cash-on-cash
- 84.25%
- DSCR
- 4.75
- GRM
- 2.4
CMA / ARV
- ARV (on-the-fly)
- $62,160
- Comps found
- 2
Show comp detail 2 sales within ~0.75 mi
| Address | Dist | Beds/Ba | Sqft | Sold | Price | $/sf | Match |
|---|---|---|---|---|---|---|---|
| 215 Bordic Rd | 0.06mi | 2/1.5 | 720 (-14%) | 9mo | $53,500 | $74 | 66 |
| 13 Keystone Rd | 0.29mi | 2/1.0 | 720 (-14%) | 14mo | $45,000 | $63 | 49 |
Match score weights: distance 35% · size 25% · config 20% · recency 20%. Top-matched comps best support the ARV.
Projected returns pro-forma
-3.0% appreciation · 3.0% rent growth · sell at horizon
- IRR
- 84.7%
- Equity multiple
- 4.90×
- Total profit
- $54,433
- Equity at exit
- $7,440
- IRR
- 87.9%
- Equity multiple
- 10.16×
- Total profit
- $128,011
- Equity at exit
- $4,314
Cash invested: $13,972 (down + closing). Projections, not guarantees.
Landlord ↔ Tenant lean methodology
- Overall (STATE)
- 62 Landlord-Friendly
- State Pennsylvania
- 62 Landlord-Friendly · EVEN
- County
- — inherits STATE
- City
- — inherits STATE
ZIP-level market 19606
- Active inventory
- 166
- Price-to-rent
- 2.4×
Monthly cashflow live
- Estimated rent
- $1,706 medium interval (Pro) →
- Mortgage (P&I)
- −$262
- Tax from tax record
- −$84 /mo · $1,009/yr
- Insurance
- −$21
- HOA
- −$0
- Vacancy / Maint / Mgmt
- −$358
- Net cashflow
- $981
Break-even live
Sensitivity live
| Price | -10% $1,009 | -5% $995 | +0% $981 | +5% $967 | +10% $953 |
|---|---|---|---|---|---|
| Rent | -10% $846 | -5% $914 | +0% $981 | +5% $1,048 | +10% $1,116 |
| Rate | -1.0pp $1,006 | -0.5pp $994 | base $981 | +0.5pp $968 | +1.0pp $955 |
UW: 25.0% down · 7.5% · 30yr · 1.5% tax · 5.0% vac · 8.0% maint · 8.0% mgmt
Financing live
Cash to close
- Down payment
- $12,475
- Closing costs
- $1,497
- Reserves months
- —
- Total cash needed
- —
Loan-product check · same deal, 3 products live
Conventional
25% down · 7.5% · 30yr
- Down + closing
- —
- Monthly P&I
- —
- Monthly cashflow
- —
- DSCR
- —
- Eligible?
- —
Personal DTI + credit; lowest rate.
DSCR
20% down · 8.5% · 30yr
- Down + closing
- —
- Monthly P&I
- —
- Monthly cashflow
- —
- DSCR
- —
- Eligible?
- —
No personal income docs; deal must DSCR.
Hard money
10% down · 12.0% · 12mo
- Down + closing
- —
- Monthly P&I
- —
- Monthly cashflow
- —
- DSCR
- —
- Eligible?
- —
Short-term bridge; refi at stabilization.
Rent comps 1 comps
| Address | Beds | Baths | Sqft | Rent | $/sqft | DOM | Units | Dist |
|---|---|---|---|---|---|---|---|---|
| 1251 Buddies Pl Birdsboro, PA | 3.0 | 2.0 | 1040 | $2,400 | $2.31 | 14d | 1 | 1.26mi |
Listing history 8 events
-
2026-06-21days on market $49,900 Active 10 DOM
-
2026-06-18days on market $49,900 Active 7 DOM
-
2026-06-17days on market $49,900 Active 6 DOM
-
2026-06-16days on market $49,900 Active 5 DOM
-
2026-06-15days on market $49,900 Active 4 DOM
-
2026-06-14days on market $49,900 Active 2 DOM
-
2026-06-13remarks 699-char remark
-
2026-06-13$49,900 Active 1 DOM
ⓘ Source: listings_history table (triggers on properties + properties_extension) + one-shot
backfill from property_details.listing_events for pre-trigger history.
Tax reassessment forecast PA · Partial reset (capped growth)
- Current annual tax
- $1,009 · $84/mo
- Projected year-2 tax
- $1,009 · $84/mo
- Expected delta
- $0/yr ($0/mo · 0.0%)
ⓘ Screening estimate from a state-policy table — verify with the county assessor before closing.
Nearby sold comps map
Loading sold comps map…
Walkable amenities ~0.75 mi
Loading nearby amenities…
Taxation est. · year 1
- Rental income
- $20,469
- − Mortgage interest
- −$2,795
- − Property taxes
- −$1,009
- − Insurance
- −$250
- − Repairs & maintenance
- −$1,637
- − Management
- −$1,637
- − Depreciation
- −$1,452
- Taxable income
- $11,689
- Est. tax owed @ 24.0%
- −$2,805
- After-tax cash flow
- $8,967/yr
For passive investors: Depreciation is non-cash, so a rental often shows a tax loss while cash-flowing — sheltering income. Rental losses are passive: they offset passive income freely, and up to $25,000/yr can offset ordinary (W-2) income if you actively participate and your MAGI is under $100k (phasing out to $0 by $150k); unused losses carry forward. On sale, claimed depreciation is recaptured at up to 25%, and gains may owe capital-gains tax (a 1031 exchange can defer both). Figures are a year-1 estimate at your 24.0% rate — not tax advice; consult a CPA.
Schools (NCES district)
- District
- Exeter Township SD
- NCES district ID
- 4209480
- Math proficiency
- 41% ▼ -8.00%
- Reading proficiency
- 60% ▼ -11.00%
- Median HH income
- $71,744
- Composite
- 45.21/100
- National rank
- #2669
- State rank
- #141 of 539 in PA
Livability — Lorane
- Score
- 75/100
- State rank
- #428
- US rank
- #3912
Category grades
Schools grade is shown separately in the Schools card above.
Census & demographics
- Census place
- Lorane, PA
- County
- Berks County · 195,629 people
- Metro
- Reading, PA
- Population (ZIP)
- 35,853
- Household income
- $85,557
- Rent vs Own
- Severe rent burden
- 619.0
Population outlook (Berks County) Hauer SSP2
- Today (2025)
- 425,767 people
- By 2030
- 428,814 · +0.7%
- By 2040
- 433,463 · +1.8%
- By 2050
- 439,426 · +3.2%
- By 2075
- 478,647 · +12.4%
- By 2100
- 518,507 · +21.8%
Race, ethnicity, and origin ACS 2023
- Neighborhood character
- Predominantly White (72%)
- Race & ethnicity
- White 72% Hispanic / Latino 18% Two or more races 11% Black 5% Asian 2%
- Hispanic origin (detail)
- Mexican 2% Puerto Rican 9% Dominican 3%
- Common ancestry
- Romanian 7% Polish 2% Iranian 2%
- Foreign-born
- 6% · Canada, Jamaica
- Languages at home
- 86% English-only · Spanish 11% Other Indo-European 1% German/W. Germanic 1%
Political lean MEDSL · Berks
- 2024 margin
- R (+12.2) · D 43.4% · R 55.6%
- 2008→2024 swing
- -21.4pp toward R · 2008: 9.2pp · 2024: -12.2pp
- All cycles
- 2024: R+12.2 2020: R+8.2 2016: R+10.2 2012: R+0.6 2008: D+9.2
Not yet ingested
- Civics
- —
Market trends
- HPI YoY
- ▼ -211.56%
- Current HPI
- 283.6138
- Rent YoY
- —
- Metro
- Reading, PA
- State GDP YoY
- ▲ 1.68%
- F500 in state
- 34
Industry mix (Fortune 500 HQ in PA)
| Industry | F500 HQs | Revenue |
|---|---|---|
| Healthcare | 2 | $309B |
|
||
| Insurance | 2 | $27B |
|
||
| Telecommunications / Media | 1 | $124B |
|
||
| Industrial Distribution | 1 | $22B |
|
||
| Financial Services | 1 | $20B |
|
||
| Chemicals / Materials | 1 | $18B |
|
||
Price history
+47.2% since first listed20 events — show timeline
- 2026-06-12 Listed $49,900 BRIGHT MLS
- 2026-06-11 Coming Soon $49,900 BRIGHT MLS
- 2012-11-07 Sold (MLS) $16,000 TREND
- 2012-11-07 Sold (MLS) $16,000 BRIGHT MLS
- 2012-11-05 Pending — TREND
- 2012-11-02 Relisted — TREND
- 2012-11-02 Listing Removed — BRIGHT MLS
- 2012-11-01 Delisted — TREND
- 2012-08-24 Price Changed $20,900 TREND
- 2012-06-15 Relisted — TREND
- 2012-06-15 Delisted — TREND
- 2012-05-15 Relisted — TREND
- 2012-05-15 Delisted — TREND
- 2012-04-25 Price Changed $25,000 TREND
- 2012-02-24 Listed $27,800 TREND
- 2012-02-24 Listed $20,900 BRIGHT MLS
- 2011-12-10 Listing Removed — BRIGHT MLS
- 2011-12-10 Listing Removed — BRIGHT MLS
- 2011-07-20 Listed $33,900 BRIGHT MLS
- 2011-06-10 Listed $33,900 BRIGHT MLS
Property tax history
+1.5%/yrLatest (2026): $1,009 · +0.5% YoY. Source: county tax records.
Cash-flow waterfall
monthlySold comps — $/sqft
last 12 mo · ≤1 miLoading sold comps…