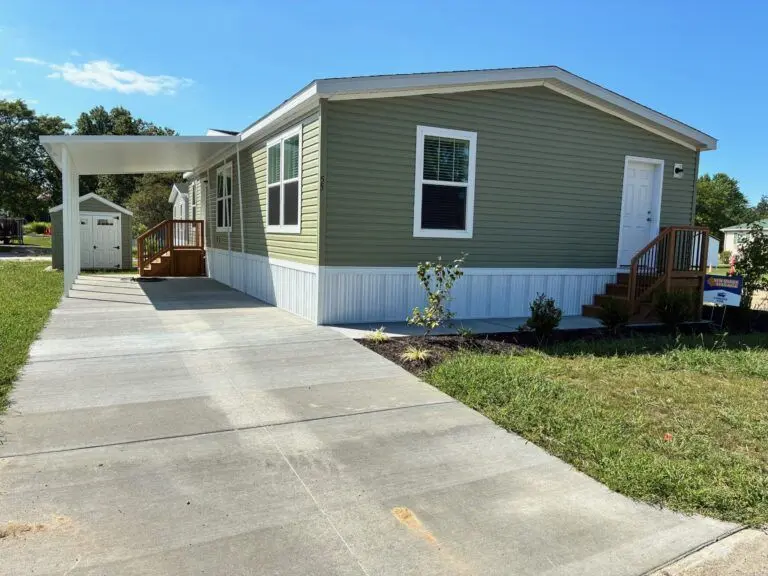
55 Flager Dr Unit A55 · Olmsted Falls, OH
Flood risk 9/10 · Severe
- FEMA flood zone
- X (unshaded)
- Chance of flooding over 30 yrs
- 0.99%
- Est. flood insurance / yr
- $507 – $1,088
Fire risk 1/10 · Minimal
- Est. fire insurance / yr
- $713 – $1,323
Heat risk 2/10 · Minimal
- Hot days now (above 96°F)
- 7 days/yr
- Hot days in 30 yrs
- 15 days/yr
Wind risk 1/10 · Minimal
- Chance of severe wind over 30 yrs
- —
Air-quality risk 2/10 · Minimal
- Unhealthy air days now
- 1 days/yr
- Unhealthy air days in 30 yrs
- 3 days/yr
Risk factors via First Street. Map © Google.
Why this score? — see what drove the B grade
The composite is a weighted blend of 9 inputs, each scored 0–100. Each bar is that input's sub-score; the figure is the points it added to the 100-point composite (weight × sub-score).
- Cash flow +30.0/30.0
- DSCR +10.0/10.0
- 1% rule +9.0/10.0
- ARV discount +7.5/15.0
- Schools +6.1/10.0
- Condition / age +4.0/5.0
- Livability +3.7/5.0
- Rent growth +2.5/5.0
- Appreciation +0.0/10.0
$133,777
🖨 Deal sheet 📄 Offer letter ✓ Due diligence
Listing remarks MLS
Open Concept, Private Owner's Suite and High Tech chefs kitchen!
Key facts
- Built 2025
- Listed 326 days
Neighborhood map
What this means for you Summary
Snapshot
- This is a 3-bed/2.0-bath manufactured listed at $134k. Condition is rated good.
Deal economics
- At list price, monthly cash flow is $487 ($6k/yr) — positive.
- The deal already cash-flows at list — no discount required.
- Meets the 1% rule at list price ($2k rent vs $134k).
- Recommended offer: $118k (12.0% below list) — sets the bar for market timing.
- Cap rate 11.3% vs local median 4.2% in Olmsted Falls — top-decile yield for the area; either an underpriced asset or a hidden risk that comps aren't pricing in. Stress-test before assuming the spread holds.
Location & tenants
- Location reads 73/100 on livability (#343 in OH) — a middle-class / working-renter tenant base. Strengths: schools A+, crime A+, employment A+; Watch: amenities F, commute F, health & safety F.
- Olmsted Falls City (suburban): math 70% / reading 70% proficiency, ranked #134 of 656 in OH (top 20%) — strong family-tenant draw, lease renewals of 3-5y typical; only 13% free/reduced lunch — higher-income household profile.
- Market conditions: 183 active listings in the ZIP; 4 comparable units currently listed for rent nearby; rentals leasing fast (median 3d on market — plan ~1-2 weeks tenant-placement turnaround); solid renter incomes; 1,441 units permitted in Cuyahoga County in 2024 (700 in 5+ unit buildings).
Forward outlook
- Local home prices are declining (-3.0%/yr); year-one equity from $925 of loan paydown is wiped out by about $4k of value loss. Plan a longer hold.
- Cuyahoga County population projected to shrink 8% by 2050 — rents likely to lag national; underwrite the cash flow, not the appreciation.
- At projected returns (-3.0% appreciation + 3.0% rent growth), your $37k cash investment doubles in ~8 years — after that, you're playing with house money.
Negotiation context
- It's been on market 326 days — a 12% lower offer ($118k) is reasonable based on typical stale-listing flexibility.
- 13 sale attempts with the ask held roughly flat each time — persistent listings suggest the price (not the market) is what's stuck; bring a comps-based counter.
Risks & watch-outs
- Watch-outs: flood insurance adds $66/mo.
- Climate carrying-cost: severe flood risk — expect insurance premiums to compound above CPI over the hold.
Questions for the listing agent
- It's been on market 326 days. Have you received any prior offers? Is the seller open to a 12% concession, seller financing, or rate buy-down credit?
- What's the actual annual flood-insurance premium (NFIP or private), and is the property in a SFHA with mandatory coverage?
- Why hasn't it sold? Are there any deal-killer items the seller is aware of (foundation, flood, title, zoning, code violations)?
- Is there a deadline driving the sale (1031 exchange, divorce, estate, relocation)? That informs how much negotiation room exists.
- Schools are A-rated — typically a magnet for longer-tenancy family renters. What's the average tenant stay here, and is there a school-zone premium baked into asking?
- What's the average days-on-market for RENTAL listings here right now (not sales)? A rising rental-DOM trend means longer vacancies and softer asking-rent achievability than the comps imply.
- What's the recent tenant-quality profile in this submarket — average credit score on applications, eviction rate, late-payment / NSF rate, and stable-employment percentage? A property-management company in the area should have these aggregated.
- How much new for-sale + rental construction is in the pipeline within 1–3 miles? Heavy new supply typically softens prices + rents 12–24 months out; constrained supply supports both.
Investment metrics
- 1% rule
- 1.40% ✓
- Cap rate
- 11.26%
- Cash-on-cash
- 17.74%
- DSCR
- 1.79
- GRM
- 6.0
CMA / ARV
No comps found within radius.
Projected returns pro-forma
-3.0% appreciation · 3.0% rent growth · sell at horizon
- IRR
- 6.5%
- Equity multiple
- 1.25×
- Total profit
- $9,435
- Equity at exit
- $19,947
- IRR
- 15.9%
- Equity multiple
- 2.29×
- Total profit
- $48,469
- Equity at exit
- $11,567
Cash invested: $37,458 (down + closing). Projections, not guarantees.
Landlord ↔ Tenant lean methodology
- Overall (STATE)
- 73 Landlord-Friendly
- State Ohio
- 73 Landlord-Friendly · R+6
- County
- — inherits STATE
- City
- — inherits STATE
ZIP-level market 44138
- Home prices YoY
- -30.8%
- Active inventory
- 183
- Price-to-rent
- 6.0×
Monthly cashflow live
- Estimated rent
- $1,871 medium interval (Pro) →
- Mortgage (P&I)
- −$702
- Tax est. 1.5%
- −$167 /mo · $2,007/yr
- Insurance
- −$56
- Flood insurance flood zone
- −$66 /mo · $798/yr
- HOA
- −$0
- Vacancy / Maint / Mgmt
- −$393
- Net cashflow
- $487
Break-even live
UW: 25.0% down · 7.5% · 30yr · 1.5% tax · 5.0% vac · 8.0% maint · 8.0% mgmt
Financing live
Cash to close
- Down payment
- $33,444
- Closing costs
- $4,013
- Reserves months
- —
- Total cash needed
- —
Loan-product check · same deal, 3 products live
Conventional
25% down · 7.5% · 30yr
- Down + closing
- —
- Monthly P&I
- —
- Monthly cashflow
- —
- DSCR
- —
- Eligible?
- —
Personal DTI + credit; lowest rate.
DSCR
20% down · 8.5% · 30yr
- Down + closing
- —
- Monthly P&I
- —
- Monthly cashflow
- —
- DSCR
- —
- Eligible?
- —
No personal income docs; deal must DSCR.
Hard money
10% down · 12.0% · 12mo
- Down + closing
- —
- Monthly P&I
- —
- Monthly cashflow
- —
- DSCR
- —
- Eligible?
- —
Short-term bridge; refi at stabilization.
Rent comps 4 comps
| Address | Beds | Baths | Sqft | Rent | $/sqft | DOM | Units | Dist |
|---|---|---|---|---|---|---|---|---|
| 5785 Fitch Rd North Olmsted, OH | 2.0 | 1.0 | 1080 | $1,650 | $1.53 | 43d | 1 | 1.18mi |
| 26875 Bagley Rd Olmsted Twp, OH | 1.0–3.0 | 1.0–2.0 | 890 | $1,299 | $1.46 | 2d | 1 | 1.28mi |
| 27080 Oakwood Dr Olmsted Falls, OH | 1.0–2.0 | 1.0–2.0 | 975 | $1,780 | $1.83 | 1d | 39 | 1.33mi |
| 8450 Daylily DR Olmsted Falls, OH | 2.0–3.0 | 2.5 | 1541 | $2,680 | $1.74 | 1d | 10 | 1.42mi |
Listing history 30 events
-
2026-06-03days on market $133,777 Active 326 DOM
-
2026-06-02days on market $133,777 Active 325 DOM
-
2026-06-01days on market $133,777 Active 324 DOM
-
2026-05-31days on market $133,777 Active 323 DOM
-
2026-05-06status Active 64-char remark
Show marketing remark (64 chars)
Open Concept, Private Owner's Suite and High Tech chefs kitchen!
-
2026-05-05historical 64-char remark
Show marketing remark (64 chars)
Open Concept, Private Owner's Suite and High Tech chefs kitchen!
-
2026-04-27status Active 64-char remark
Show marketing remark (64 chars)
Open Concept, Private Owner's Suite and High Tech chefs kitchen!
-
2026-04-27historical 64-char remark
Show marketing remark (64 chars)
Open Concept, Private Owner's Suite and High Tech chefs kitchen!
-
2026-04-20status Active 64-char remark
Show marketing remark (64 chars)
Open Concept, Private Owner's Suite and High Tech chefs kitchen!
-
2026-04-20historical 64-char remark
Show marketing remark (64 chars)
Open Concept, Private Owner's Suite and High Tech chefs kitchen!
-
2026-04-13status Active 64-char remark
Show marketing remark (64 chars)
Open Concept, Private Owner's Suite and High Tech chefs kitchen!
-
2026-04-13historical 64-char remark
Show marketing remark (64 chars)
Open Concept, Private Owner's Suite and High Tech chefs kitchen!
-
2026-04-03status Active 64-char remark
Show marketing remark (64 chars)
Open Concept, Private Owner's Suite and High Tech chefs kitchen!
-
2026-04-03historical 64-char remark
Show marketing remark (64 chars)
Open Concept, Private Owner's Suite and High Tech chefs kitchen!
-
2026-03-01status Active 64-char remark
Show marketing remark (64 chars)
Open Concept, Private Owner's Suite and High Tech chefs kitchen!
-
2026-02-26historical 64-char remark
Show marketing remark (64 chars)
Open Concept, Private Owner's Suite and High Tech chefs kitchen!
-
2026-02-09status Active 64-char remark
Show marketing remark (64 chars)
Open Concept, Private Owner's Suite and High Tech chefs kitchen!
-
2026-02-09historical 64-char remark
Show marketing remark (64 chars)
Open Concept, Private Owner's Suite and High Tech chefs kitchen!
-
2025-12-24price $133,777 64-char remark
Show marketing remark (64 chars)
Open Concept, Private Owner's Suite and High Tech chefs kitchen!
-
2025-12-03status Active 64-char remark
Show marketing remark (64 chars)
Open Concept, Private Owner's Suite and High Tech chefs kitchen!
-
2025-12-03historical 64-char remark
Show marketing remark (64 chars)
Open Concept, Private Owner's Suite and High Tech chefs kitchen!
-
2025-11-22status Active 64-char remark
Show marketing remark (64 chars)
Open Concept, Private Owner's Suite and High Tech chefs kitchen!
-
2025-11-22historical 64-char remark
Show marketing remark (64 chars)
Open Concept, Private Owner's Suite and High Tech chefs kitchen!
-
2025-10-25status Active 64-char remark
Show marketing remark (64 chars)
Open Concept, Private Owner's Suite and High Tech chefs kitchen!
-
2025-10-25historical 64-char remark
Show marketing remark (64 chars)
Open Concept, Private Owner's Suite and High Tech chefs kitchen!
-
2025-09-21status Active 64-char remark
Show marketing remark (64 chars)
Open Concept, Private Owner's Suite and High Tech chefs kitchen!
-
2025-09-21historical 64-char remark
Show marketing remark (64 chars)
Open Concept, Private Owner's Suite and High Tech chefs kitchen!
-
2025-08-15status Active 64-char remark
Show marketing remark (64 chars)
Open Concept, Private Owner's Suite and High Tech chefs kitchen!
-
2025-08-15historical 64-char remark
Show marketing remark (64 chars)
Open Concept, Private Owner's Suite and High Tech chefs kitchen!
-
2025-07-02$135,500 Active 64-char remark
Show marketing remark (64 chars)
Open Concept, Private Owner's Suite and High Tech chefs kitchen!
ⓘ Source: listings_history table (triggers on properties + properties_extension) + one-shot
backfill from property_details.listing_events for pre-trigger history.
Climate risk First Street
- Flood 9/10 Extreme FEMA zone X (unshaded) · 99% chance over 30 yrs
- Wildfire 1/10 Low
- Heat 2/10 Low 7 d/yr ≥96°F today · 15 d/yr by 30 yrs out
- Wind 1/10 Low
- Air quality 2/10 Low 1 unhealthy d/yr today · 3 by 30 yrs out
Nearby sold comps map
Loading sold comps map…
Walkable amenities ~0.75 mi
Loading nearby amenities…
Taxation est. · year 1
- Rental income
- $22,456
- − Mortgage interest
- −$7,494
- − Property taxes
- −$2,007
- − Insurance
- −$1,466
- − Repairs & maintenance
- −$1,796
- − Management
- −$1,796
- − Depreciation
- −$3,892
- Taxable income
- $4,005
- Est. tax owed @ 24.0%
- −$961
- After-tax cash flow
- $4,888/yr
For passive investors: Depreciation is non-cash, so a rental often shows a tax loss while cash-flowing — sheltering income. Rental losses are passive: they offset passive income freely, and up to $25,000/yr can offset ordinary (W-2) income if you actively participate and your MAGI is under $100k (phasing out to $0 by $150k); unused losses carry forward. On sale, claimed depreciation is recaptured at up to 25%, and gains may owe capital-gains tax (a 1031 exchange can defer both). Figures are a year-1 estimate at your 24.0% rate — not tax advice; consult a CPA.
Condition & rehab AI · 1 photo
This manufactured home is in good condition with a cosmetic rehab level, ready for minor updates to enhance its resale and rental value.
Value-add opportunities
- Both Painting the exterior — Fresh paint can enhance curb appeal and property value.
- Both Landscaping improvements — Enhanced landscaping can attract more buyers and renters.
- Both Interior updates (paint, minor repairs) — Fresh paint and minor repairs can make the interior more appealing and functional.
Renovation cost estimate screening
Value-add ROI direction
- Both Painting the exterior — Fresh paint can enhance curb appeal and property value. ↑
- Both Landscaping improvements — Enhanced landscaping can attract more buyers and renters. ↑
- Both Interior updates (paint, minor repairs) — Fresh paint and minor repairs can make the interior more appealing and functional. ↑
ⓘ Cost ranges are severity-bucket heuristics (US national rule-of-thumb). Get contractor quotes + a written scope before underwriting a rehab budget.
Schools (NCES district)
- District
- Olmsted Falls City
- NCES district ID
- 3904657
- Math proficiency
- 70% ▼ -14.00%
- Reading proficiency
- 70% ▼ -10.00%
- Median HH income
- $68,307
- Composite
- 61.12/100
- National rank
- #787
- State rank
- #134 of 656 in OH
Livability — Olmsted Falls
- Score
- 73/100
- State rank
- #343
- US rank
- #5595
Category grades
Schools grade is shown separately in the Schools card above.
Census & demographics
- County
- Cuyahoga · 1,045,444 people
- Metro
- Cleveland, OH
- Population (ZIP)
- 23,129
- Household income
- $93,877
- Rent vs Own
- Severe rent burden
- 7.6
Population outlook (Cuyahoga County) Hauer SSP2
- Today (2025)
- 1,244,621 people
- By 2030
- 1,230,093 · -1.2%
- By 2040
- 1,189,108 · -4.5%
- By 2050
- 1,145,706 · -7.9%
- By 2075
- 1,076,557 · -13.5%
- By 2100
- 978,987 · -21.3%
Race, ethnicity, and origin ACS 2023
- Neighborhood character
- Predominantly White (85%)
- Race & ethnicity
- White 85% Hispanic / Latino 9% Two or more races 6% Black 3% Asian 2%
- Hispanic origin (detail)
- Mexican 3% Puerto Rican 3%
- Common ancestry
- Romanian 9% Slovak 2% Lithuanian 1%
- Foreign-born
- 6% · Canada, Jamaica, China
- Languages at home
- 93% English-only · Spanish 4% Other Indo-European 1% Arabic 1%
Political lean MEDSL · Cuyahoga
- 2024 margin
- Solid D (+31.5) · D 65.4% · R 33.9%
- 2008→2024 swing
- -7.4pp toward R · 2008: 38.9pp · 2024: 31.5pp
- All cycles
- 2024: D+31.5 2020: D+34.1 2016: D+35.0 2012: D+38.7 2008: D+38.9
Not yet ingested
- Civics
- —
Market trends
- HPI YoY
- ▼ -89.76%
- Current HPI
- 201.9716
- Rent YoY
- —
- Metro
- —
- State GDP YoY
- ▲ 1.98%
- F500 in state
- 48
Industry mix (Fortune 500 HQ in OH)
| Industry | F500 HQs | Revenue |
|---|---|---|
| Insurance | 3 | $145B |
|
||
| Industrial Machinery | 3 | $49B |
|
||
| Financial Services | 3 | $24B |
|
||
| Consumer Goods | 2 | $93B |
|
||
| Aerospace / Defense | 2 | $47B |
|
||
| Utilities | 2 | $33B |
|
||
Price history
-1.3% since first listed26 events — show timeline
- 2026-05-06 Relisted — Zillow
- 2026-05-05 Delisted — Zillow
- 2026-04-27 Relisted — Zillow
- 2026-04-27 Delisted — Zillow
- 2026-04-20 Relisted — Zillow
- 2026-04-20 Delisted — Zillow
- 2026-04-13 Relisted — Zillow
- 2026-04-13 Delisted — Zillow
- 2026-04-03 Relisted — Zillow
- 2026-04-03 Delisted — Zillow
- 2026-03-01 Relisted — Zillow
- 2026-02-26 Delisted — Zillow
- 2026-02-09 Relisted — Zillow
- 2026-02-09 Delisted — Zillow
- 2025-12-24 Price Changed $133,777 Zillow
- 2025-12-03 Relisted — Zillow
- 2025-12-03 Delisted — Zillow
- 2025-11-22 Relisted — Zillow
- 2025-11-22 Delisted — Zillow
- 2025-10-25 Relisted — Zillow
- 2025-10-25 Delisted — Zillow
- 2025-09-21 Relisted — Zillow
- 2025-09-21 Delisted — Zillow
- 2025-08-15 Relisted — Zillow
- 2025-08-15 Delisted — Zillow
- 2025-07-02 Listed $135,500 Zillow
Cash-flow waterfall
monthlySold comps — $/sqft
last 12 mo · ≤1 miLoading sold comps…