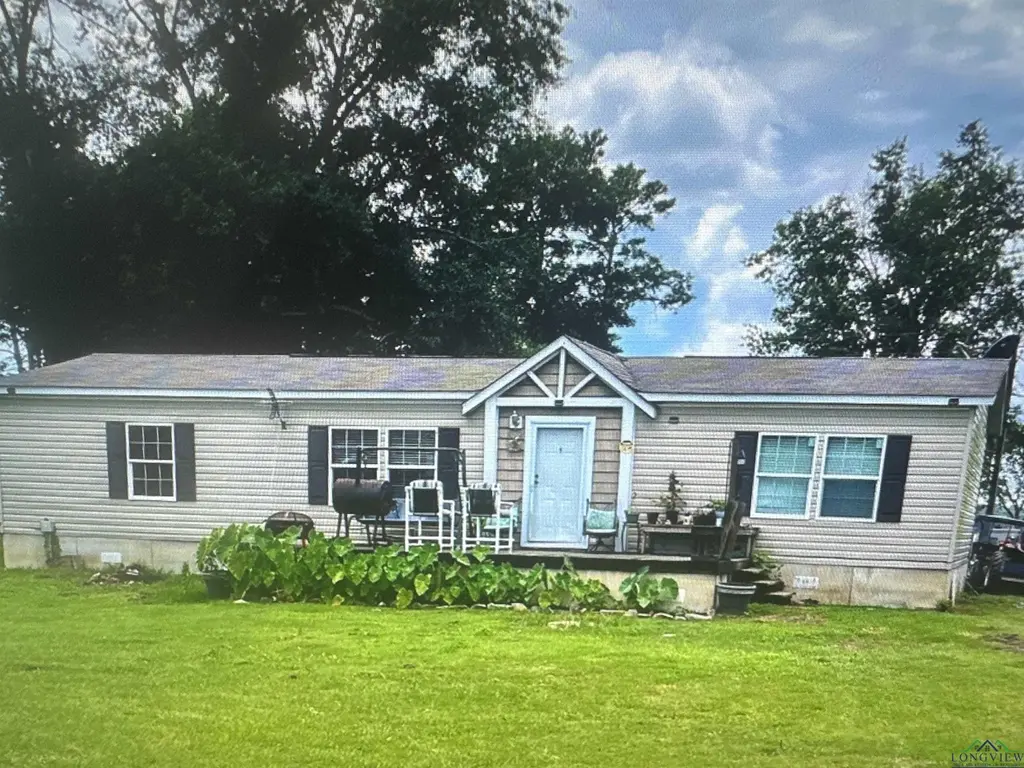
632 County Road 183 · Carthage, TX
Flood risk 1/10 · Minimal
- FEMA flood zone
- —
- Chance of flooding over 30 yrs
- 0.0%
- Est. flood insurance / yr
- —
Fire risk 1/10 · Minimal
- Est. fire insurance / yr
- $1,222 – $2,270
Heat risk 7/10 · Major
- Hot days now (above 110°F)
- 7 days/yr
- Hot days in 30 yrs
- 22 days/yr
Wind risk 8/10 · Major
- Chance of severe wind over 30 yrs
- 80.0%
Air-quality risk 1/10 · Minimal
- Unhealthy air days now
- 0 days/yr
- Unhealthy air days in 30 yrs
- 0 days/yr
Risk factors via First Street. Map © Google.
Why this score? — see what drove the D grade
The composite is a weighted blend of 9 inputs, each scored 0–100. Each bar is that input's sub-score; the figure is the points it added to the 100-point composite (weight × sub-score).
- ARV discount +15.0/15.0
- Cash flow +8.6/30.0
- Livability +3.6/5.0
- Schools +3.5/10.0
- Rent growth +2.5/5.0
- Condition / age +2.5/5.0
- DSCR +2.4/10.0
- 1% rule +2.2/10.0
- Appreciation +0.0/10.0
$169,900
🖨 Deal sheet (PDF) 📄 Offer letter ✓ Due diligence
Listing remarks MLS
CALLING ALL FISHERMAN!!! LAKE MURVAUL NORTH, 2017 MODEL HOME LOCATED ON AN INTERIOR LOT WITH FRONT AND BACK WATERVIEWS. .. INCLUDES A BOAT HOUSE ON JONES BRANCH WITH DEEP WATER AND AWESOME CRAPPIE FISHING. 20' x 25' INSULATED WORKSHOP WITH A/C & CONCRETE FLOOR.
Key facts
- Interior lot
- Boat house
- Deep water
Tags
Neighborhood map
What this means for you Summary
Snapshot
- This is a 3-bed/2.0-bath manufactured listed at $170k.
Deal economics
- At list price, monthly cash flow is $-146 ($-2k/yr) — negative.
- To cash-flow at today's rent, offer at most $144k (15.2% below list).
- To meet the 1% rule (rent ≥ 1% of price), the offer needs to be $122k (28.3% below list).
- Recommended offer: $122k (28.3% below list) — sets the bar for 1% rule.
Location & tenants
- Location reads 72/100 on livability (#258 in TX) — a middle-class / working-renter tenant base. Strengths: cost of living A+, housing A+, health & safety A+; Watch: employment D+, crime F, amenities F.
- Carthage ISD (town): math 41% / reading 41% proficiency, ranked #364 of 826 in TX (top 44%) — families likely to look elsewhere, expect single-tenant / working-renter base with shorter leases.
- Zoned schools: Carthage Pri (484 students, 67% FRL); Baker-Koonce Int (math 38% / reading 32%, grade F, #842 of 1,662 statewide, top 51%, 568 students, 58% FRL); Carthage H S (math 59% / reading 57%, grade C, #320 of 1,632 statewide, top 20%, 809 students, 54% FRL).
- Market conditions: 141 active listings in the ZIP; 6 units permitted in Panola County in 2024 (0 in 5+ unit buildings).
Forward outlook
- Local home prices are declining (-3.0%/yr); year-one equity from $1k of loan paydown is wiped out by about $5k of value loss. Plan a longer hold.
- Panola County population projected at -14% by 2050 — secular population decline; favor cash flow + early exit over multi-decade hold.
Negotiation context
- It's been on market 315 days — a 12% lower offer ($150k) is reasonable based on typical stale-listing flexibility.
- 2 sale attempts since 2y ago with the ask held roughly flat each time — persistent listings suggest the price (not the market) is what's stuck; bring a comps-based counter.
Risks & watch-outs
- Climate carrying-cost: severe wind risk, 80% chance of damaging wind over 30y; extreme-heat days projected 7→22/yr by 2055 (HVAC capex compounding) — expect insurance premiums to compound above CPI over the hold.
Questions for the listing agent
- What do current leases actually rent for vs. the listed asking? Can we see a recent rent roll and the last 12 months of T-12 income?
- It's been on market 315 days. Have you received any prior offers? Is the seller open to a 28% concession, seller financing, or rate buy-down credit?
- What does the HOA fee cover, when was the last increase, and are there any pending special assessments or reserve-fund shortfalls?
- Why hasn't it sold? Are there any deal-killer items the seller is aware of (foundation, flood, title, zoning, code violations)?
- Is there a deadline driving the sale (1031 exchange, divorce, estate, relocation)? That informs how much negotiation room exists.
- Schools are D-rated, which usually means shorter tenancies and higher turnover. Who's the typical renter profile here, and what's been the actual vacancy rate?
- Crime grade is F in this area — have there been break-ins, vandalism, or insurance claims at this property in the last 3 years? What carrier currently insures it and at what premium?
- The area grade is low — what's the realistic commute time and amenity access for the typical tenant pool here? Any planned neighborhood developments (good or bad) we should know about?
- What's the average days-on-market for RENTAL listings here right now (not sales)? A rising rental-DOM trend means longer vacancies and softer asking-rent achievability than the comps imply.
- What's the recent tenant-quality profile in this submarket — average credit score on applications, eviction rate, late-payment / NSF rate, and stable-employment percentage? A property-management company in the area should have these aggregated.
- How much new for-sale + rental construction is in the pipeline within 1–3 miles? Heavy new supply typically softens prices + rents 12–24 months out; constrained supply supports both.
Investment metrics
- 1% rule
- 0.72% ✗
- Cap rate
- 5.26%
- Cash-on-cash
- -3.68%
- DSCR
- 0.84
- GRM
- 11.6
CMA / ARV
- ARV (median comp)
- $273,424
- List price
- $169,900
- Delta
- -37.86%
- Verdict
- UNDERPRICED
- Comps
- 1 within 2.0 mi
Projected returns pro-forma
-3.0% appreciation · 3.0% rent growth · sell at horizon
- IRR
- -22.5%
- Equity multiple
- 0.23×
- Total profit
- $-36,842
- Equity at exit
- $25,333
- IRR
- -16.7%
- Equity multiple
- 0.07×
- Total profit
- $-44,132
- Equity at exit
- $14,690
Cash invested: $47,572 (down + closing). Projections, not guarantees.
Landlord ↔ Tenant lean methodology
- Overall (STATE)
- 87 Strongly Landlord-Friendly
- State Texas
- 87 Strongly Landlord-Friendly · R+5
- County
- — inherits STATE
- City
- — inherits STATE
ZIP-level market 75633
- Home prices YoY
- -27.3%
- Active inventory
- 141
- Price-to-rent
- 11.6×
Monthly cashflow live
- Estimated rent
- $1,219 medium interval (Pro) →
- Mortgage (P&I)
- −$891
- Tax from tax record
- −$134 /mo · $1,605/yr
- Insurance
- −$71
- HOA
- −$13
- Vacancy / Maint / Mgmt
- −$256
- Net cashflow
- $-146
Break-even live
Sensitivity live
| Price | -10% $-50 | -5% $-98 | +0% $-146 | +5% $-194 | +10% $-242 |
|---|---|---|---|---|---|
| Rent | -10% $-242 | -5% $-194 | +0% $-146 | +5% $-98 | +10% $-50 |
| Rate | -1.0pp $-60 | -0.5pp $-103 | base $-146 | +0.5pp $-190 | +1.0pp $-235 |
UW: 25.0% down · 7.5% · 30yr · 1.5% tax · 5.0% vac · 8.0% maint · 8.0% mgmt
Financing live
Cash to close
- Down payment
- $42,475
- Closing costs
- $5,097
- Reserves months
- —
- Total cash needed
- —
Loan-product check · same deal, 3 products live
Conventional
25% down · 7.5% · 30yr
- Down + closing
- —
- Monthly P&I
- —
- Monthly cashflow
- —
- DSCR
- —
- Eligible?
- —
Personal DTI + credit; lowest rate.
DSCR
20% down · 8.5% · 30yr
- Down + closing
- —
- Monthly P&I
- —
- Monthly cashflow
- —
- DSCR
- —
- Eligible?
- —
No personal income docs; deal must DSCR.
Hard money
10% down · 12.0% · 12mo
- Down + closing
- —
- Monthly P&I
- —
- Monthly cashflow
- —
- DSCR
- —
- Eligible?
- —
Short-term bridge; refi at stabilization.
HOA detail
- Monthly dues
- $13 · $156/yr
- Likely covers
- water
Listing history 15 events
-
2026-06-09days on market $169,900 Active 315 DOM
-
2026-06-08days on market $169,900 Active 314 DOM
-
2026-06-08days on market $169,900 Active 313 DOM
-
2026-06-07days on market $169,900 Active 312 DOM
-
2026-06-03days on market $169,900 Active 309 DOM
-
2026-06-02days on market $169,900 Active 308 DOM
-
2026-06-01days on market $169,900 Active 307 DOM
-
2026-05-31days on market $169,900 Active 306 DOM
-
2025-08-08price $169,900 267-char remark
Show marketing remark (267 chars)
CALLING ALL FISHERMAN!!! LAKE MURVAUL NORTH, 2017 MODEL HOME LOCATED ON AN INTERIOR LOT WITH FRONT AND BACK WATERVIEWS. .. INCLUDES A BOAT HOUSE ON JONES BRANCH WITH DEEP WATER AND AWESOME CRAPPIE FISHING. 20' x 25' INSULATED WORKSHOP WITH A/C & CONCRETE FLOOR.
-
2025-07-29$175,000 Active 267-char remark
Show marketing remark (267 chars)
CALLING ALL FISHERMAN!!! LAKE MURVAUL NORTH, 2017 MODEL HOME LOCATED ON AN INTERIOR LOT WITH FRONT AND BACK WATERVIEWS. .. INCLUDES A BOAT HOUSE ON JONES BRANCH WITH DEEP WATER AND AWESOME CRAPPIE FISHING. 20' x 25' INSULATED WORKSHOP WITH A/C & CONCRETE FLOOR.
-
2024-10-21price $190,000
-
2024-08-27price $215,000
-
2024-07-31$225,000 Active
-
1995-07-10soldstatus
-
1992-03-19soldstatus
ⓘ Source: listings_history table (triggers on properties + properties_extension) + one-shot
backfill from property_details.listing_events for pre-trigger history.
Tax reassessment forecast TX · Resets to sale price
- Current annual tax
- $1,605 · $134/mo
- Projected year-2 tax
- $3,109 · $259/mo
- Expected delta
- +$1,504/yr (+$125/mo · 93.7%)
ⓘ Screening estimate from a state-policy table — verify with the county assessor before closing.
Climate risk First Street
- Flood 1/10 Low 0% chance over 30 yrs
- Wildfire 1/10 Low
- Heat 7/10 Severe 7 d/yr ≥110°F today · 22 d/yr by 30 yrs out
- Wind 8/10 Severe 80% chance of damaging wind over 30 yrs
- Air quality 1/10 Low 0 unhealthy d/yr today · 0 by 30 yrs out
Nearby sold comps map
Loading sold comps map…
Walkable amenities ~0.75 mi
Loading nearby amenities…
Taxation est. · year 1
- Rental income
- $14,623
- − Mortgage interest
- −$9,517
- − Property taxes
- −$1,605
- − Insurance
- −$850
- − Repairs & maintenance
- −$1,170
- − Management
- −$1,170
- − HOA
- −$156
- − Depreciation
- −$4,943
- Taxable loss
- −$4,787
- Est. tax savings @ 24.0%
- +$1,149
- After-tax cash flow
- $-601/yr
For passive investors: Depreciation is non-cash, so a rental often shows a tax loss while cash-flowing — sheltering income. Rental losses are passive: they offset passive income freely, and up to $25,000/yr can offset ordinary (W-2) income if you actively participate and your MAGI is under $100k (phasing out to $0 by $150k); unused losses carry forward. On sale, claimed depreciation is recaptured at up to 25%, and gains may owe capital-gains tax (a 1031 exchange can defer both). Figures are a year-1 estimate at your 24.0% rate — not tax advice; consult a CPA.
Schools (NCES district)
- District
- Carthage ISD
- NCES district ID
- 4813110
- Math proficiency
- 41% ▼ -3.00%
- Reading proficiency
- 41% ▼ -3.00%
- Median HH income
- $48,546
- Composite
- 35.19/100
- National rank
- #4997
- State rank
- #364 of 826 in TX
Livability — Carthage
- Score
- 72/100
- State rank
- #258
- US rank
- #6081
Category grades
Schools grade is shown separately in the Schools card above.
Census & demographics
- Population (ZIP)
- 12,999
Population outlook (Panola County) Hauer SSP2
- Today (2025)
- 23,273 people
- By 2030
- 22,845 · -1.8%
- By 2040
- 21,652 · -7.0%
- By 2050
- 20,107 · -13.6%
- By 2075
- 15,709 · -32.5%
- By 2100
- 11,013 · -52.7%
Race, ethnicity, and origin ACS 2023
- Neighborhood character
- Predominantly White (68%)
- Race & ethnicity
- White 68% Two or more races 15% Hispanic / Latino 14% Black 11%
- Hispanic origin (detail)
- Mexican 12%
- Common ancestry
- Lithuanian 5% Serbian 2% Slovak 2%
- Foreign-born
- 6% · Canada, Vietnam
- Languages at home
- 87% English-only · Spanish 11% Vietnamese 1% French/Haitian/Cajun 1%
Political lean MEDSL · Panola
- 2024 margin
- Solid R (+66.4) · D 16.7% · R 83.1%
- 2008→2024 swing
- -17.5pp toward R · 2008: -48.9pp · 2024: -66.4pp
- All cycles
- 2024: R+66.4 2020: R+63.5 2016: R+63.5 2012: R+56.1 2008: R+48.9
Not yet ingested
- Civics
- —
Market trends
- HPI YoY
- ▼ -60.73%
- Current HPI
- 162.0275
- Rent YoY
- —
- Metro
- —
- State GDP YoY
- ▲ 3.95%
- F500 in state
- 110
Industry mix (Fortune 500 HQ in TX)
| Industry | F500 HQs | Revenue |
|---|---|---|
| Energy | 16 | $1,198B |
|
||
| Technology | 5 | $198B |
|
||
| Engineering / Construction | 4 | $72B |
|
||
| Energy Services | 3 | $60B |
|
||
| Utilities | 3 | $41B |
|
||
| Healthcare | 2 | $330B |
|
||
Price history
-24.5% since first listed7 events — show timeline
- 2025-08-08 Price Changed $169,900 LAAR
- 2025-07-29 Listed $175,000 LAAR
- 2024-10-21 Price Changed $190,000 LAAR
- 2024-08-27 Price Changed $215,000 LAAR
- 2024-07-31 Listed $225,000 LAAR
- 1995-07-10 Sold (Public Records) — Public Records
- 1992-03-19 Sold (Public Records) — Public Records
Property tax history
+12.7%/yrLatest (2025): $1,605 · +9.4% YoY. Source: county tax records.
Cash-flow waterfall
monthlySold comps — $/sqft
last 12 mo · ≤1 miLoading sold comps…