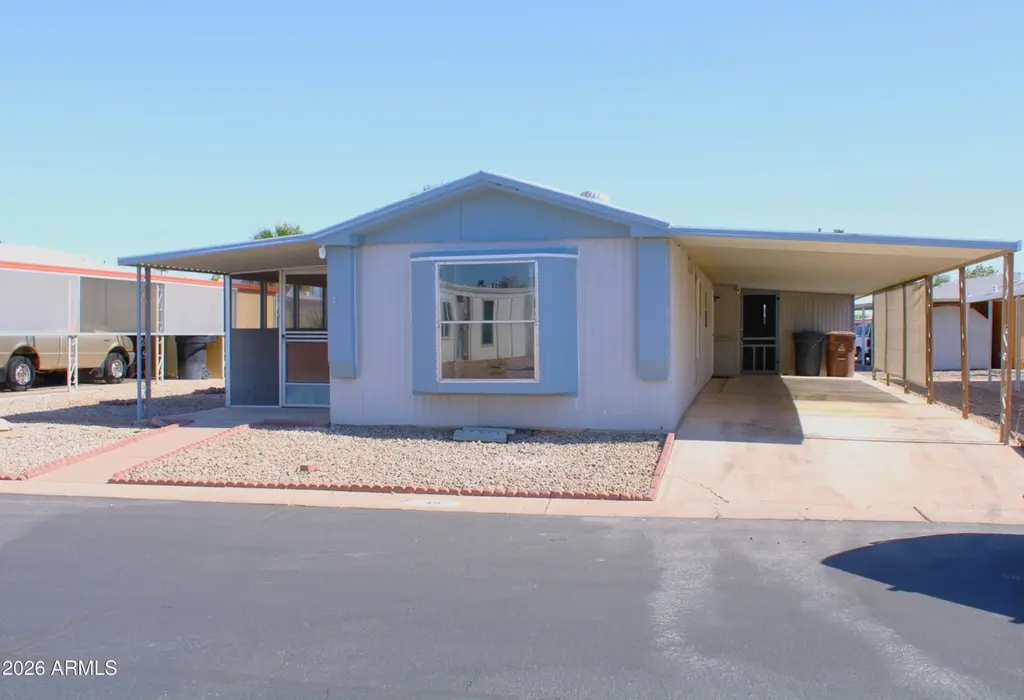
11000 N 91st Ave #49 · Peoria, AZ
Flood risk 1/10 · Minimal
- FEMA flood zone
- X (shaded)
- Chance of flooding over 30 yrs
- 0.0%
- Est. flood insurance / yr
- $507 – $1,088
Fire risk 1/10 · Minimal
- Est. fire insurance / yr
- $610 – $1,132
Heat risk 9/10 · Severe
- Hot days now (above 113°F)
- 7 days/yr
- Hot days in 30 yrs
- 17 days/yr
Wind risk 1/10 · Minimal
- Chance of severe wind over 30 yrs
- —
Air-quality risk 2/10 · Minimal
- Unhealthy air days now
- 1 days/yr
- Unhealthy air days in 30 yrs
- 1 days/yr
Risk factors via First Street. Map © Google.
Why this score? — see what drove the C+ grade
The composite is a weighted blend of 9 inputs, each scored 0–100. Each bar is that input's sub-score; the figure is the points it added to the 100-point composite (weight × sub-score).
- Cash flow +30.0/30.0
- 1% rule +10.0/10.0
- DSCR +10.0/10.0
- Livability +3.8/5.0
- Condition / age +3.8/5.0
- Schools +3.5/10.0
- Rent growth +2.7/5.0
- ARV discount +0.0/15.0
- Appreciation +0.0/10.0
$64,900
🖨 Deal sheet 📄 Offer letter ✓ Due diligence
Listing remarks
Wow! Affordable living in the heart of Peoria! This beautifully updated 2-bedroom, 2-bath home is located in a family-friendly community and priced under $65,000, with one of the lowest monthly land lease fees in the Valley at just $550 per month. Step inside and enjoy a bright, open floor plan featuring fresh interior paint, brand-new luxury vinyl plank (LVP) flooring throughout the main living areas, and new carpet in both bedrooms. The updated kitchen showcases white shaker cabinetry with upgraded brushed nickel hardware and a full suite of new stainless-steel appliances. Enjoy added peace of mind with a newer A/C unit and a seller-provided home warranty that includes A/C coverage for on
Key facts
- Home warranty
- Newer a/c unit
- Updated kitchen
Tags
Property features AI
Finance
- HOA & community: Land lease (monthly fee); Land lease amount $550 per month; Association covers water, sewer and trash; Community pool; Near bus stop
Exterior
- Parking: 2 covered parking spaces; Tandem garage with separate storage area; 2 carport spaces
- Utilities: City water; Public sewer
- Home design: Manufactured/Mobile home; Leasehold property
- Construction: Vinyl siding; Wood frame construction; Painted exterior; Built-up roof
- Exterior features: Screened-in patio(s); Shed(s); Gravel/stone front yard; Gravel/stone backyard; Partial block fencing
Interior
- Kitchen: Built-in microwave; Refrigerator; Kitchen island; Pantry; Eat-in kitchen
- Bedrooms: 2 possible bedrooms
- Flooring: Carpet; Laminate; Tile
- Bathrooms: 2 full bathrooms
- Heating & cooling: Central air; Ceiling fans; Electric heating; Floor furnace; Wall furnace
- Interior features: High-speed internet; Eat-in kitchen; Vaulted ceilings; Kitchen island; Pantry; Master bedroom with 3/4 bath; Dual-pane windows
- Laundry & utility: Washer/dryer hookup (washer/dryer not included)
Neighborhood map
What this means for you Summary
Snapshot
- This is a 2-bed/2.0-bath manufactured listed at $65k. Condition is rated good.
Deal economics
- At list price, monthly cash flow is $810 ($10k/yr) — positive.
- The deal already cash-flows at list — no discount required.
- Meets the 1% rule at list price ($2k rent vs $65k).
- Recommended offer: $64k (1.5% below list) — sets the bar for market timing.
- Cap rate 21.3% vs local median 3.3% in Peoria — top-decile yield for the area; either an underpriced asset or a hidden risk that comps aren't pricing in. Stress-test before assuming the spread holds.
Location & tenants
- Location reads 76/100 on livability (#14 in AZ, #3,603 nationally) — a middle-class / working-renter tenant base. Strengths: housing A+, commute A, employment A; Watch: cost of living C-, amenities D, health & safety F.
- Peoria Unified School District (4237) (suburban): math 36% / reading 42% proficiency, ranked #64 of 249 in AZ (top 26%) — families likely to look elsewhere, expect single-tenant / working-renter base with shorter leases.
- Zoned schools: Cheyenne Elementary School (math 26% / reading 31%, grade F, #580 of 1,109 statewide, top 53%, 598 students, 72% FRL); Peoria High School (math 18% / reading 22%, grade F, #225 of 381 statewide, top 60%, 1,566 students, 54% FRL) — zoned schools average 63% FRL vs 35% district-wide (28 pts higher); higher-poverty schools than district average — tighter screening recommended.
- Zoned-school proficiency averages 24% at this address vs 39% district-wide (-15 pts) — the specific schools serving this property underperform the Peoria Unified School District (4237) average; the district grade overstates school quality for this exact location.
- Market conditions: Rents flat; 333 active listings in the ZIP; 21 comparable units currently listed for rent nearby; rentals leasing fast (median 6d on market — plan ~1-2 weeks tenant-placement turnaround); 36,011 units permitted in Maricopa County in 2024 (12,801 in 5+ unit buildings).
Forward outlook
- Local home prices are declining (-3.0%/yr); year-one equity from $449 of loan paydown is wiped out by about $2k of value loss. Plan a longer hold.
- Maricopa County population projected at +38% by 2050 — long-run rental-demand tailwind backs the buy-and-hold thesis.
- At projected returns (-3.0% appreciation + 0.6% rent growth), your $18k cash investment doubles in ~3 years — after that, you're playing with house money.
Negotiation context
- It's been on market 18 days — a 2% lower offer ($64k) is reasonable based on typical stale-listing flexibility.
Risks & watch-outs
- Climate carrying-cost: extreme-heat days projected 7→17/yr by 2055 (HVAC capex compounding) — expect insurance premiums to compound above CPI over the hold.
Questions for the listing agent
- Is there a deadline driving the sale (1031 exchange, divorce, estate, relocation)? That informs how much negotiation room exists.
- Schools are B-rated — typically a magnet for longer-tenancy family renters. What's the average tenant stay here, and is there a school-zone premium baked into asking?
- What's the average days-on-market for RENTAL listings here right now (not sales)? A rising rental-DOM trend means longer vacancies and softer asking-rent achievability than the comps imply.
- What's the recent tenant-quality profile in this submarket — average credit score on applications, eviction rate, late-payment / NSF rate, and stable-employment percentage? A property-management company in the area should have these aggregated.
- How much new for-sale + rental construction is in the pipeline within 1–3 miles? Heavy new supply typically softens prices + rents 12–24 months out; constrained supply supports both.
Investment metrics
- 1% rule
- 2.45% ✓
- Cap rate
- 21.27%
- Cash-on-cash
- 53.48%
- DSCR
- 3.38
- GRM
- 3.4
CMA / ARV
- ARV (on-the-fly)
- $48,384
- Comps found
- 12
Show comp detail 12 sales within ~0.75 mi
| Address | Dist | Beds/Ba | Sqft | Sold | Price | $/sf | Match |
|---|---|---|---|---|---|---|---|
| 10810 N 91st Ave #45 | 0.12mi | 3/2.0 (+1) | 896 (0%) | 3mo | $80,000 | $89 | 87 |
| 11411 N 91st Ave #215 | 0.30mi | 2/2.0 | 966 (+8%) | 4mo | $12,000 | $12 | 70 |
| 11000 N 91st Ave #84 | 0.05mi | 3/1.0 (+1) | 980 (+9%) | 4mo | $60,000 | $61 | 69 |
| 10951 N 91st Ave #177 | 0.40mi | 2/1.5 | 924 (+3%) | 6mo | $37,500 | $41 | 69 |
| 10951 N 91st Ave #223 | 0.16mi | 2/2.0 | 1,024 (+14%) | 0mo | $69,900 | $68 | 68 |
| 11411 N 91st Ave #131 | 0.30mi | 2/2.0 | 980 (+9%) | 4mo | $46,000 | $47 | 67 |
| 11411 N 91st Ave #48 | 0.30mi | 2/2.0 | 980 (+9%) | 8mo | $14,000 | $14 | 64 |
| 11411 N 91st Ave #28 | 0.30mi | 2/1.0 | 812 (-9%) | 4mo | $27,750 | $34 | 63 |
| 10951 N 91st Ave #216 | 0.40mi | 2/2.0 | 980 (+9%) | 6mo | $82,000 | $84 | 61 |
| 11411 N 91st Ave #235 | 0.30mi | 2/2.0 | 1,024 (+14%) | 6mo | $85,000 | $83 | 58 |
| 10701 N 99th Ave #178 | 0.70mi | 2/1.0 | 840 (-6%) | 0mo | $15,000 | $18 | 53 |
| 10701 N 99th Ave #136 | 0.70mi | 2/2.0 | 1,020 (+14%) | 6mo | $55,000 | $54 | 40 |
Match score weights: distance 35% · size 25% · config 20% · recency 20%. Top-matched comps best support the ARV.
Projected returns pro-forma
-3.0% appreciation · 0.62% rent growth · sell at horizon
- IRR
- 48.9%
- Equity multiple
- 3.06×
- Total profit
- $37,362
- Equity at exit
- $9,677
- IRR
- 53.4%
- Equity multiple
- 5.65×
- Total profit
- $84,473
- Equity at exit
- $5,611
Cash invested: $18,172 (down + closing). Projections, not guarantees.
Landlord ↔ Tenant lean methodology
- Overall (STATE)
- 87 Strongly Landlord-Friendly
- State Arizona
- 87 Strongly Landlord-Friendly · R+3
- County
- — inherits STATE
- City
- — inherits STATE
ZIP-level market 85345
- Home prices YoY
- -19.8%
- Rents YoY
- 0.6%
- Active inventory
- 333
- Price-to-rent
- 3.4×
Monthly cashflow live
- Estimated rent
- $1,593 high interval (Pro) →
- Mortgage (P&I)
- −$340
- Tax est. 1.5%
- −$81 /mo · $974/yr
- Insurance
- −$27
- HOA
- −$0
- Vacancy / Maint / Mgmt
- −$335
- Net cashflow
- $810
Break-even live
UW: 25.0% down · 7.5% · 30yr · 1.5% tax · 5.0% vac · 8.0% maint · 8.0% mgmt
Financing live
Cash to close
- Down payment
- $16,225
- Closing costs
- $1,947
- Reserves months
- —
- Total cash needed
- —
Loan-product check · same deal, 3 products live
Conventional
25% down · 7.5% · 30yr
- Down + closing
- —
- Monthly P&I
- —
- Monthly cashflow
- —
- DSCR
- —
- Eligible?
- —
Personal DTI + credit; lowest rate.
DSCR
20% down · 8.5% · 30yr
- Down + closing
- —
- Monthly P&I
- —
- Monthly cashflow
- —
- DSCR
- —
- Eligible?
- —
No personal income docs; deal must DSCR.
Hard money
10% down · 12.0% · 12mo
- Down + closing
- —
- Monthly P&I
- —
- Monthly cashflow
- —
- DSCR
- —
- Eligible?
- —
Short-term bridge; refi at stabilization.
Rent comps 21 comps
| Address | Beds | Baths | Sqft | Rent | $/sqft | DOM | Units | Dist |
|---|---|---|---|---|---|---|---|---|
| 11411 N 91st Ave Unit 213 Peoria, AZ | 2.0 | 2.0 | 858 | $1,399 | $1.63 | 24d | 1 | 0.27mi |
| 8821 W Sahuaro Dr Peoria, AZ | 3.0 | 2.0 | 1074 | $1,595 | $1.49 | 3d | 1 | 0.49mi |
| 8821 W Sahuaro Dr Peoria, AZ | 3.0 | 2.0 | 1074 | $1,595 | $1.49 | 24d | 1 | 0.49mi |
| 8757 W Peoria Ave Peoria, AZ | 2.0 | 1.0 | 564 | $1,539 | $2.73 | 3d | 14 | 0.61mi |
| 10701 N 99th Ave Unit 230 Peoria, AZ | 2.0 | 2.0 | 784 | $1,099 | $1.40 | 20d | 1 | 0.70mi |
| 8650 W Peoria Ave Peoria, AZ | 1.0–2.0 | 1.0–2.0 | 836 | $1,492 | $1.78 | 2d | 19 | 0.72mi |
| 8560 W Peoria Ave Peoria, AZ | 2.0 | 1.0 | 888 | $1,450 | $1.63 | 1d | 8 | 0.79mi |
| 10860 N 85th Ave Peoria, AZ | 1.0–2.0 | 1.0 | 630 | $1,350 | $2.14 | 3d | 1 | 0.81mi |
| 10860 N 85th Ave Peoria, AZ | 2.0 | 1.0 | 780 | $1,225 | $1.57 | 44d | 1 | 0.81mi |
| 10860 N 85th Ave Unit 87 Peoria, AZ | 2.0 | 1.0 | 780 | $1,149 | $1.47 | 5d | 1 | 0.81mi |
| 10104 N 96th Dr Unit A Peoria, AZ | 2.0 | 2.0 | 1072 | $1,750 | $1.63 | 24d | 1 | 0.85mi |
| 10110 N 97th Dr Unit A Peoria, AZ | 2.0 | 1.5 | 1025 | $1,500 | $1.46 | 24d | 1 | 0.93mi |
| 10822 N Balboa Dr Sun City, AZ | 2.0 | 1.0 | 942 | $3,000 | $3.18 | 24d | 1 | 1.02mi |
| 12751 N Plaza Del Rio Blvd Peoria, AZ | 1.0–2.0 | 1.0–2.0 | 1007 | $1,890 | $1.88 | 1d | 10 | 1.06mi |
| 11429 N 83rd Ave #2 Peoria, AZ | 1.0 | 1.0 | 750 | $1,100 | $1.47 | 24d | 1 | 1.16mi |
| 8280 W Madison St Peoria, AZ | 2.0 | 2.0 | 800 | $1,400 | $1.75 | 44d | 1 | 1.23mi |
| 8940 W Olive Ave Peoria, AZ | 2.0 | 2.0 | 897 | $1,400 | $1.56 | 17d | 1 | 1.26mi |
| 9680 W Olive Ave Peoria, AZ | 1.0–3.0 | 1.0–2.0 | 850 | $1,540 | $1.81 | 2d | 9 | 1.31mi |
| 8165 W Whitney Dr Peoria, AZ | 1.0–2.0 | 1.0–2.0 | 911 | $2,223 | $2.44 | 1d | 229 | 1.42mi |
| 13310 N Plaza del Rio Blvd Peoria, AZ | 1.0–3.0 | 1.0–2.0 | 981 | $1,556 | $1.59 | 2d | 13 | 1.47mi |
| 9625 W Olive Ave Peoria, AZ | 1.0–3.0 | 1.0–3.0 | 1485 | $2,136 | $1.44 | 5d | 7 | 1.49mi |
Listing history 14 events
-
2026-06-18days on market $64,900 Active 18 DOM
-
2026-06-17days on market $64,900 Active 17 DOM
-
2026-06-16days on market $64,900 Active 16 DOM
-
2026-06-15days on market $64,900 Active 15 DOM
-
2026-06-13days on market $64,900 Active 13 DOM
-
2026-06-13days on market $64,900 Active 12 DOM
-
2026-06-09days on market $64,900 Active 9 DOM
-
2026-06-08days on market $64,900 Active 8 DOM
-
2026-06-07days on market $64,900 Active 7 DOM
-
2026-06-04days on market $64,900 Active 4 DOM
-
2026-06-03days on market $64,900 Active 3 DOM
-
2026-06-02days on market $64,900 Active 2 DOM
-
2026-06-01remarks 699-char remark
-
2026-06-01$64,900 Active 1 DOM
ⓘ Source: listings_history table (triggers on properties + properties_extension) + one-shot
backfill from property_details.listing_events for pre-trigger history.
Climate risk First Street
- Flood 1/10 Low FEMA zone X (shaded) · 0% chance over 30 yrs
- Wildfire 1/10 Low
- Heat 9/10 Extreme 7 d/yr ≥113°F today · 17 d/yr by 30 yrs out
- Wind 1/10 Low
- Air quality 2/10 Low 1 unhealthy d/yr today · 1 by 30 yrs out
Nearby sold comps map
Loading sold comps map…
Walkable amenities ~0.75 mi
Loading nearby amenities…
Taxation est. · year 1
- Rental income
- $19,115
- − Mortgage interest
- −$3,635
- − Property taxes
- −$974
- − Insurance
- −$324
- − Repairs & maintenance
- −$1,529
- − Management
- −$1,529
- − Depreciation
- −$1,888
- Taxable income
- $9,235
- Est. tax owed @ 24.0%
- −$2,216
- After-tax cash flow
- $7,502/yr
For passive investors: Depreciation is non-cash, so a rental often shows a tax loss while cash-flowing — sheltering income. Rental losses are passive: they offset passive income freely, and up to $25,000/yr can offset ordinary (W-2) income if you actively participate and your MAGI is under $100k (phasing out to $0 by $150k); unused losses carry forward. On sale, claimed depreciation is recaptured at up to 25%, and gains may owe capital-gains tax (a 1031 exchange can defer both). Figures are a year-1 estimate at your 24.0% rate — not tax advice; consult a CPA.
Condition & rehab AI · 12 photos
This well-maintained, updated 2-bedroom, 2-bath home in Peoria offers a bright, open floor plan with new flooring and appliances, making it a great investment opportunity.
Value-add opportunities
- Both Paint exterior — Enhances curb appeal and resale value
- Both Replace carpet in bedrooms — Improves comfort and adds value
Renovation cost estimate screening
Value-add ROI direction
- Both Paint exterior — Enhances curb appeal and resale value ↑
- Both Replace carpet in bedrooms — Improves comfort and adds value ↑
ⓘ Cost ranges are severity-bucket heuristics (US national rule-of-thumb). Get contractor quotes + a written scope before underwriting a rehab budget.
Schools (NCES district)
- District
- Peoria Unified School District (4237)
- NCES district ID
- 0406250
- Math proficiency
- 36% ▼ -14.00%
- Reading proficiency
- 42% ▼ -8.00%
- Median HH income
- $60,171
- Composite
- 34.62/100
- National rank
- #5152
- State rank
- #64 of 249 in AZ
Livability — Peoria
- Score
- 76/100
- State rank
- #14
- US rank
- #3603
Category grades
Schools grade is shown separately in the Schools card above.
Census & demographics
- Census place
- Peoria, AZ
- County
- Maricopa County · 4,537,380 people
- City population
- 206,687
- Metro
- Phoenix-Mesa-Chandler, AZ
- Population (ZIP)
- 60,918
- Household income
- $67,380
- Rent vs Own
- Severe rent burden
- 1879.0
Population outlook (Maricopa County) Hauer SSP2
- Today (2025)
- 4,979,203 people
- By 2030
- 5,378,229 · +8.0%
- By 2040
- 6,156,598 · +23.6%
- By 2050
- 6,872,376 · +38.0%
- By 2075
- 8,401,270 · +68.7%
- By 2100
- 9,247,439 · +85.7%
Race, ethnicity, and origin ACS 2023
- Neighborhood character
- Diverse neighborhood (Simpson 0.62)
- Race & ethnicity
- White 51% Hispanic / Latino 34% Two or more races 14% Black 5% Asian 4% Native American 2%
- Hispanic origin (detail)
- Mexican 29%
- Common ancestry
- Romanian 2% Italian 2% Slovak 1%
- Foreign-born
- 13% · Canada, Vietnam
- Languages at home
- 76% English-only · Spanish 18% Other Indo-European 1% Vietnamese 1%
Political lean MEDSL · Maricopa
- 2024 margin
- Toss-up / Even · D 47.7% · R 51.2% · Other 1.1%
- 2008→2024 swing
- +7.1pp toward D · 2008: -10.6pp · 2024: -3.5pp
- All cycles
- 2024: R+3.5 2020: D+2.2 2016: R+3.5 2012: R+12.0 2008: R+10.6
Not yet ingested
- Civics
- —
Market trends
- HPI YoY
- ▼ -80.77%
- Current HPI
- 328.1069
- Rent YoY
- ▲ 0.62%
- Metro
- Phoenix-Mesa-Chandler, AZ
- State GDP YoY
- ▲ 4.54%
- F500 in state
- 20
Industry mix (Fortune 500 HQ in AZ)
| Industry | F500 HQs | Revenue |
|---|---|---|
| Technology | 2 | $13B |
|
||
| Mining / Metals | 1 | $23B |
|
||
| Environmental Services | 1 | $16B |
|
||
| Metals / Steel | 1 | $14B |
|
||
| Technology Distribution | 1 | $9B |
|
||
| Homebuilding | 1 | $8B |
|
||
Price history
1 event — show timeline
- 2026-05-30 Listed $64,900 ARMLS
Cash-flow waterfall
monthlySold comps — $/sqft
last 12 mo · ≤1 miLoading sold comps…