1271 N Arkansas Ter · Hernando, FL
Flood risk 1/10 · Minimal
- FEMA flood zone
- X (unshaded)
- Chance of flooding over 30 yrs
- 0.0%
- Est. flood insurance / yr
- $507 – $1,088
Fire risk 5/10 · Moderate
- Est. fire insurance / yr
- $947 – $1,759
Heat risk 9/10 · Severe
- Hot days now (above 108°F)
- 7 days/yr
- Hot days in 30 yrs
- 24 days/yr
Wind risk 9/10 · Severe
- Chance of severe wind over 30 yrs
- 99.0%
Air-quality risk 1/10 · Minimal
- Unhealthy air days now
- 0 days/yr
- Unhealthy air days in 30 yrs
- 0 days/yr
Risk factors via First Street. Map © Google.
Why this score? — see what drove the B+ grade
The composite is a weighted blend of 9 inputs, each scored 0–100. Each bar is that input's sub-score; the figure is the points it added to the 100-point composite (weight × sub-score).
- Cash flow +30.0/30.0
- ARV discount +15.0/15.0
- 1% rule +10.0/10.0
- DSCR +10.0/10.0
- Schools +4.1/10.0
- Livability +3.6/5.0
- Rent growth +2.5/5.0
- Condition / age +2.5/5.0
- Appreciation +0.0/10.0
$94,900
🖨 Deal sheet 📄 Offer letter ✓ Due diligence
Listing remarks MLS
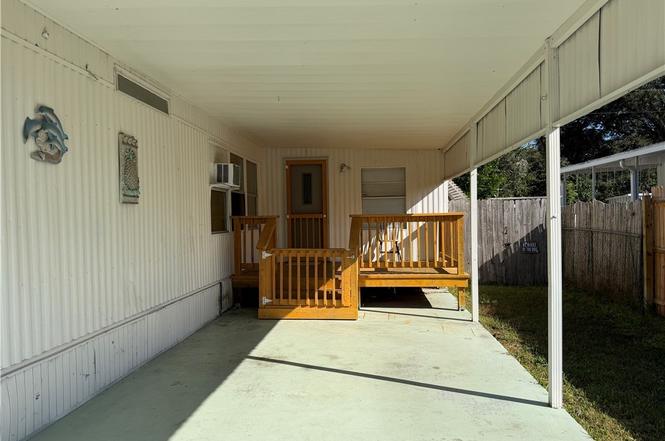
Remodeled 14x60 mobile home with 12x30 attached carport and 12x30 attached family room with wall A/C & heat. 7x12 Florida room on back and 6x24 open porch on front. Concrete driveway and sidewalks. Detached 8x12 shed. Split bedrooms, ceilings fans, blinds, eat-in kitchen, built in hutch, wood laminate floors, 2 bedrooms, 2 baths, shows nice!
Key facts
- 6,304 sq ft lot
- Parking
- Built 1981
Property features AI
Exterior
- Parking: Attached carport; Driveway; Concrete parking; 1 parking space total
- Utilities: Private well water; Septic tank sewer
- Home design: Manufactured single-wide home; Residential property
- Construction: Aluminum siding with frame construction; Metal roof; Built on crawl space
- Exterior features: Cleared, rectangular lot; County road frontage; No pool
Interior
- Kitchen: Electric oven; Refrigerator
- Flooring: Linoleum; Tile
- Bathrooms: 2 full bathrooms
- Heating & cooling: Central heating (electric); Central air; Electric heating; Wall/Window unit(s) for cooling
- Interior features: Electric oven; Refrigerator; Water heater; Crawl space
Neighborhood map
What this means for you Summary
Snapshot
- This is a 2-bed/2.0-bath manufactured listed at $95k.
Deal economics
- At list price, monthly cash flow is $779 ($9k/yr) — positive.
- The deal already cash-flows at list — no discount required.
- Meets the 1% rule at list price ($2k rent vs $95k).
- Recommended offer: $84k (12.0% below list) — sets the bar for market timing.
- Cap rate 16.1% vs local median 5.6% in Hernando — top-decile yield for the area; either an underpriced asset or a hidden risk that comps aren't pricing in. Stress-test before assuming the spread holds.
Location & tenants
- Location reads 71/100 on livability (#402 in FL) — a middle-class / working-renter tenant base. Strengths: cost of living A+, housing A+, health & safety A+; Watch: amenities F, commute F, employment D-.
- Citrus (rural): math 49% / reading 50% proficiency, ranked #44 of 73 in FL (top 60%) — families likely to look elsewhere, expect single-tenant / working-renter base with shorter leases.
- Zoned schools: Hernando Elementary School (math 47% / reading 51%, grade D, #1,134 of 2,144 statewide, top 54%, 813 students, 71% FRL); Inverness Middle School (math 52% / reading 48%, grade C, #254 of 571 statewide, top 45%, 1,017 students, 60% FRL); Citrus High School (math 34% / reading 51%, grade F, #264 of 667 statewide, top 41%, 1,503 students, 54% FRL) — zoned schools at 62% FRL track the district average.
- Market conditions: 444 active listings in the ZIP; 3 comparable units currently listed for rent nearby; rentals at typical pace (median 21d on market — plan ~3-4 weeks tenant-placement turnaround); 2,443 units permitted in Citrus County in 2024 (0 in 5+ unit buildings).
- This rent runs 38% of the median local income ($57k/yr) — at the standard rent-burdened threshold; future hikes will face affordability resistance.
Forward outlook
- Local home prices are declining (-3.0%/yr); year-one equity from $656 of loan paydown is wiped out by about $3k of value loss. Plan a longer hold.
- Citrus County population projected to shrink 10% by 2050 — rents likely to lag national; underwrite the cash flow, not the appreciation.
- At projected returns (-3.0% appreciation + 3.0% rent growth), your $27k cash investment doubles in ~4 years — after that, you're playing with house money.
Negotiation context
- It's been on market 221 days — a 12% lower offer ($84k) is reasonable based on typical stale-listing flexibility.
- 3 sale attempts since 11y ago; this cycle's ask has dropped $25k (21%) from the opening price — seller is motivated, your offer sets the floor, not the list.
- Current owner paid $46k; list at $95k implies a 107% gain — meaningful room to come down on a strong offer.
Risks & watch-outs
- Climate carrying-cost: severe wind risk, 99% chance of damaging wind over 30y; moderate wildfire risk; extreme-heat days projected 7→24/yr by 2055 (HVAC capex compounding) — expect insurance premiums to compound above CPI over the hold.
Questions for the listing agent
- It's been on market 221 days. Have you received any prior offers? Is the seller open to a 12% concession, seller financing, or rate buy-down credit?
- Why hasn't it sold? Are there any deal-killer items the seller is aware of (foundation, flood, title, zoning, code violations)?
- Is there a deadline driving the sale (1031 exchange, divorce, estate, relocation)? That informs how much negotiation room exists.
- What's the average days-on-market for RENTAL listings here right now (not sales)? A rising rental-DOM trend means longer vacancies and softer asking-rent achievability than the comps imply.
- What's the recent tenant-quality profile in this submarket — average credit score on applications, eviction rate, late-payment / NSF rate, and stable-employment percentage? A property-management company in the area should have these aggregated.
- How much new for-sale + rental construction is in the pipeline within 1–3 miles? Heavy new supply typically softens prices + rents 12–24 months out; constrained supply supports both.
Investment metrics
- 1% rule
- 1.91% ✓
- Cap rate
- 16.15%
- Cash-on-cash
- 35.19%
- DSCR
- 2.57
- GRM
- 4.4
CMA / ARV
- ARV (on-the-fly)
- $152,400
- Comps found
- 9
Show comp detail 9 sales within ~0.75 mi
| Address | Dist | Beds/Ba | Sqft | Sold | Price | $/sf | Match |
|---|---|---|---|---|---|---|---|
| 1422 N Reed Ter | 0.39mi | 2/2.0 | 1,196 (-0%) | 1mo | $175,000 | $146 | 80 |
| 4332 E Wyoming Ln | 0.15mi | 2/2.0 | 1,136 (-5%) | 12mo | $135,000 | $119 | 74 |
| 4250 E Nebraska Ln | 0.29mi | 3/2.0 (+1) | 1,188 (-1%) | 8mo | $165,000 | $139 | 74 |
| 4296 E Texas St | 0.10mi | 3/2.0 (+1) | 1,296 (+8%) | 18mo | $170,000 | $131 | 62 |
| 4380 E Louisiana Ln | 0.06mi | 2/2.0 | 1,056 (-12%) | 20mo | $164,000 | $155 | 61 |
| 1400 N Reed Ter | 0.38mi | 2/2.0 | 1,338 (+12%) | 14mo | $114,500 | $86 | 51 |
| 1571 N Little Carmen Ter | 0.49mi | 2/2.0 | 1,296 (+8%) | 22mo | $165,000 | $127 | 45 |
| 1377 N Reed Ter | 0.34mi | 3/2.0 (+1) | 1,344 (+12%) | 18mo | $160,000 | $119 | 44 |
| 1756 N Paul Dr | 0.65mi | 3/2.0 (+1) | 1,352 (+13%) | 2mo | $48,500 | $36 | 42 |
Match score weights: distance 35% · size 25% · config 20% · recency 20%. Top-matched comps best support the ARV.
Projected returns pro-forma
-3.0% appreciation · 3.0% rent growth · sell at horizon
- IRR
- 30.8%
- Equity multiple
- 2.29×
- Total profit
- $34,279
- Equity at exit
- $14,150
- IRR
- 38.0%
- Equity multiple
- 4.53×
- Total profit
- $93,858
- Equity at exit
- $8,205
Cash invested: $26,572 (down + closing). Projections, not guarantees.
Landlord ↔ Tenant lean methodology
- Overall (STATE)
- 87 Strongly Landlord-Friendly
- State Florida
- 87 Strongly Landlord-Friendly · R+3
- County
- — inherits STATE
- City
- — inherits STATE
ZIP-level market 34442
- Home prices YoY
- -21.9%
- Active inventory
- 444
- Price-to-rent
- 4.4×
Monthly cashflow live
- Estimated rent
- $1,810 medium interval (Pro) →
- Mortgage (P&I)
- −$498
- Tax from tax record
- −$114 /mo · $1,366/yr
- Insurance
- −$40
- HOA
- −$0
- Vacancy / Maint / Mgmt
- −$380
- Net cashflow
- $779
Break-even live
UW: 25.0% down · 7.5% · 30yr · 1.5% tax · 5.0% vac · 8.0% maint · 8.0% mgmt
Financing live
Cash to close
- Down payment
- $23,725
- Closing costs
- $2,847
- Reserves months
- —
- Total cash needed
- —
Loan-product check · same deal, 3 products live
Conventional
25% down · 7.5% · 30yr
- Down + closing
- —
- Monthly P&I
- —
- Monthly cashflow
- —
- DSCR
- —
- Eligible?
- —
Personal DTI + credit; lowest rate.
DSCR
20% down · 8.5% · 30yr
- Down + closing
- —
- Monthly P&I
- —
- Monthly cashflow
- —
- DSCR
- —
- Eligible?
- —
No personal income docs; deal must DSCR.
Hard money
10% down · 12.0% · 12mo
- Down + closing
- —
- Monthly P&I
- —
- Monthly cashflow
- —
- DSCR
- —
- Eligible?
- —
Short-term bridge; refi at stabilization.
Rent comps 3 comps
| Address | Beds | Baths | Sqft | Rent | $/sqft | DOM | Units | Dist |
|---|---|---|---|---|---|---|---|---|
| 815 E Rembrandt Way Unit 424 Inverness, FL | 3.0 | 2.0 | 1262 | $1,850 | $1.47 | 21d | 1 | 0.43mi |
| 543 N Rooks Ave Inverness, FL | 3.0 | 2.0 | 1296 | $1,900 | $1.47 | 21d | 1 | 1.38mi |
| 3880 E Byrd St Inverness, FL | 3.0 | 2.0 | 1380 | $1,600 | $1.16 | 21d | 1 | 1.40mi |
Listing history 22 events
-
2026-06-13remarks 388-char remark
-
2026-06-13pricestatusdays on market $94,900 Pending 221 DOM
-
2026-06-09days on market $99,900 Active 219 DOM
-
2026-06-08days on market $99,900 Active 218 DOM
-
2026-06-03days on market $99,900 Active 213 DOM
-
2026-06-02days on market $99,900 Active 212 DOM
-
2026-06-01days on market $99,900 Active 211 DOM
-
2026-05-31days on market $99,900 Active 210 DOM
-
2026-05-30days on market $99,900 Active 209 DOM
-
2026-04-17status Active
-
2026-04-17price $99,900
-
2026-03-22status Pending
-
2026-01-22price $109,900
-
2026-01-06price $117,900
-
2025-10-06$119,900 Active
-
2021-03-10soldstatus $45,900
-
2015-08-24soldstatus $29,000 349-char remark
Show marketing remark (349 chars)
Remodeled 14x60 mobile home with 12x30 attached carport and 12x30 attached family room with wall A/C & heat. 7x12 Florida room on back and 6x24 open porch on front. Concrete driveway and sidewalks. Detached 8x12 shed. Split bedrooms, ceilings fans, blinds, eat-in kitchen, built in hutch, wood laminate floors, 2 bedrooms, 2 baths, shows nice!
-
2015-07-27$32,500 349-char remark
Show marketing remark (349 chars)
Remodeled 14x60 mobile home with 12x30 attached carport and 12x30 attached family room with wall A/C & heat. 7x12 Florida room on back and 6x24 open porch on front. Concrete driveway and sidewalks. Detached 8x12 shed. Split bedrooms, ceilings fans, blinds, eat-in kitchen, built in hutch, wood laminate floors, 2 bedrooms, 2 baths, shows nice!
-
2009-07-30soldstatus $48,000
-
2008-01-23soldstatus $45,000
-
1998-04-01soldstatus $30,000
-
1987-10-01soldstatus $31,500
ⓘ Source: listings_history table (triggers on properties + properties_extension) + one-shot
backfill from property_details.listing_events for pre-trigger history.
Tax reassessment forecast FL · Resets to sale price
- Current annual tax
- $1,366 · $114/mo
- Projected year-2 tax
- $1,366 · $114/mo
- Expected delta
- $0/yr ($0/mo · 0.0%)
ⓘ Screening estimate from a state-policy table — verify with the county assessor before closing.
Climate risk First Street
- Flood 1/10 Low FEMA zone X (unshaded) · 0% chance over 30 yrs
- Wildfire 5/10 Major
- Heat 9/10 Extreme 7 d/yr ≥108°F today · 24 d/yr by 30 yrs out
- Wind 9/10 Extreme 99% chance of damaging wind over 30 yrs
- Air quality 1/10 Low 0 unhealthy d/yr today · 0 by 30 yrs out
Nearby sold comps map
Loading sold comps map…
Walkable amenities ~0.75 mi
Loading nearby amenities…
Taxation est. · year 1
- Rental income
- $21,726
- − Mortgage interest
- −$5,316
- − Property taxes
- −$1,366
- − Insurance
- −$474
- − Repairs & maintenance
- −$1,738
- − Management
- −$1,738
- − Depreciation
- −$2,761
- Taxable income
- $8,333
- Est. tax owed @ 24.0%
- −$2,000
- After-tax cash flow
- $7,351/yr
For passive investors: Depreciation is non-cash, so a rental often shows a tax loss while cash-flowing — sheltering income. Rental losses are passive: they offset passive income freely, and up to $25,000/yr can offset ordinary (W-2) income if you actively participate and your MAGI is under $100k (phasing out to $0 by $150k); unused losses carry forward. On sale, claimed depreciation is recaptured at up to 25%, and gains may owe capital-gains tax (a 1031 exchange can defer both). Figures are a year-1 estimate at your 24.0% rate — not tax advice; consult a CPA.
Schools (NCES district)
- District
- Citrus
- NCES district ID
- 1200270
- Math proficiency
- 49% ▼ -10.00%
- Reading proficiency
- 50% ▼ -6.00%
- Median HH income
- $38,618
- Composite
- 41.28/100
- National rank
- #3519
- State rank
- #44 of 73 in FL
Livability — Hernando
- Score
- 71/100
- State rank
- #402
- US rank
- #7137
Category grades
Schools grade is shown separately in the Schools card above.
Census & demographics
- County
- Citrus County · 111,314 people
- City population
- 17,281
- Metro
- Homosassa Springs, FL
- Population (ZIP)
- 17,281
- Household income
- $57,259
- Rent vs Own
- Severe rent burden
- 314.0
Population outlook (Citrus County) Hauer SSP2
- Today (2025)
- 138,622 people
- By 2030
- 136,886 · -1.3%
- By 2040
- 132,009 · -4.8%
- By 2050
- 125,196 · -9.7%
- By 2075
- 108,570 · -21.7%
- By 2100
- 84,454 · -39.1%
Race, ethnicity, and origin ACS 2023
- Neighborhood character
- Predominantly White (90%)
- Race & ethnicity
- White 90% Hispanic / Latino 4% Two or more races 3% Asian 2% Black 2%
- Common ancestry
- Romanian 4% Slovak 4% Lithuanian 3%
- Foreign-born
- 8% · Canada, China, South Korea
- Languages at home
- 93% English-only · Spanish 3% German/W. Germanic 2% Tagalog/Filipino 1%
Political lean MEDSL · Citrus
- 2024 margin
- Solid R (+45.9) · D 26.8% · R 72.6%
- 2008→2024 swing
- -29.8pp toward R · 2008: -16.1pp · 2024: -45.9pp
- All cycles
- 2024: R+45.9 2020: R+41.0 2016: R+39.7 2012: R+21.9 2008: R+16.1
Not yet ingested
- Civics
- —
Market trends
- HPI YoY
- ▼ -76.70%
- Current HPI
- 273.3262
- Rent YoY
- —
- Metro
- Homosassa Springs, FL
- State GDP YoY
- ▲ 3.28%
- F500 in state
- 36
Industry mix (Fortune 500 HQ in FL)
| Industry | F500 HQs | Revenue |
|---|---|---|
| Industrial Technology | 2 | $29B |
|
||
| Insurance | 2 | $17B |
|
||
| Retail | 1 | $60B |
|
||
| Technology Distribution | 1 | $58B |
|
||
| Homebuilding | 1 | $35B |
|
||
| Technology Manufacturing | 1 | $35B |
|
||
Price history
+217.1% since first listed13 events — show timeline
- 2026-04-17 Relisted — RACC
- 2026-04-17 Price Changed $99,900 RACC
- 2026-03-22 Pending — RACC
- 2026-01-22 Price Changed $109,900 RACC
- 2026-01-06 Price Changed $117,900 RACC
- 2025-10-06 Listed $119,900 RACC
- 2021-03-10 Sold (Public Records) $45,900 Public Records
- 2015-08-24 Sold (MLS) $29,000 RACC
- 2015-07-27 Listed $32,500 RACC
- 2009-07-30 Sold (Public Records) $48,000 Public Records
- 2008-01-23 Sold (Public Records) $45,000 Public Records
- 1998-04-01 Sold (Public Records) $30,000 Public Records
- 1987-10-01 Sold (Public Records) $31,500 Public Records
Property tax history
+11.3%/yrLatest (2025): $1,366 · +13.1% YoY. Source: county tax records.
Cash-flow waterfall
monthlySold comps — $/sqft
last 12 mo · ≤1 miLoading sold comps…