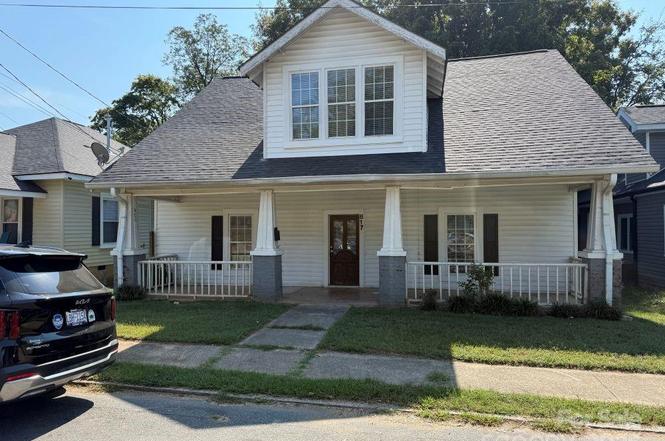
817 Jackson St S · Salisbury, NC
Flood risk 1/10 · Minimal
- FEMA flood zone
- X (unshaded)
- Chance of flooding over 30 yrs
- 0.0%
- Est. flood insurance / yr
- $507 – $1,088
Fire risk 1/10 · Minimal
- Est. fire insurance / yr
- $906 – $1,684
Heat risk 6/10 · Moderate
- Hot days now (above 104°F)
- 7 days/yr
- Hot days in 30 yrs
- 17 days/yr
Wind risk 4/10 · Minor
- Chance of severe wind over 30 yrs
- 12.0%
Air-quality risk 3/10 · Minor
- Unhealthy air days now
- 2 days/yr
- Unhealthy air days in 30 yrs
- 3 days/yr
Risk factors via First Street. Map © Google.
Why this score? — see what drove the B- grade
The composite is a weighted blend of 9 inputs, each scored 0–100. Each bar is that input's sub-score; the figure is the points it added to the 100-point composite (weight × sub-score).
- Cash flow +25.9/30.0
- ARV discount +15.0/15.0
- DSCR +8.7/10.0
- 1% rule +6.6/10.0
- Livability +3.2/5.0
- Schools +2.6/10.0
- Rent growth +2.5/5.0
- Condition / age +2.5/5.0
- Appreciation +0.0/10.0
$169,000
🖨 Deal sheet (PDF) 📄 Offer letter ✓ Due diligence
Listing remarks
OLDER 2 STORY HOUSE WITH LARGE ROOMS IN HISTORIC WEST SQUARE NEIGHBORHOOD OF SALISBURY. HOUSE. A GOOD OPPORTUNITY FOR THE NEXT OWNER TO PERSONALIZE TO THEIR TASTES.
Key facts
- 4,791 sq ft lot
- Built 1900
- Listed 269 days
Property features AI
Finance
- HOA & community: No HOA
Exterior
- Parking: On-street parking
- Utilities: City water; Public sewer
- Home design: Single family residence; Site-built construction; Two levels
- Construction: Vinyl exterior; Crawl space foundation
- Exterior features: Publicly maintained paved road access
Interior
- Kitchen: Electric cooktop; Refrigerator
- Bedrooms: Five bedrooms total (2 on the main level, 3 on the upper level)
- Bathrooms: Two full bathrooms (one main level, one upper level)
- Heating & cooling: Natural gas heating; Central air conditioning
- Interior features: Crawl space foundation; Fireplace
- Laundry & utility: Laundry located in a bathroom
Neighborhood map
What this means for you Summary
Snapshot
- This is a 5-bed/1.0-bath single-family listed at $169k.
Deal economics
- At list price, monthly cash flow is $416 ($5k/yr) — positive.
- The deal already cash-flows at list — no discount required.
- Meets the 1% rule at list price ($2k rent vs $169k).
- Recommended offer: $149k (12.0% below list) — sets the bar for market timing.
- Cap rate 9.2% vs local median 3.3% in Salisbury — top-decile yield for the area; either an underpriced asset or a hidden risk that comps aren't pricing in. Stress-test before assuming the spread holds.
Location & tenants
- Location reads 64/100 on livability (#365 in NC) — a middle-class / working-renter tenant base. Strengths: cost of living A+, housing A+, health & safety A+; Watch: crime F, amenities D-, commute F.
- Rowan-Salisbury Schools (rural): math 26% / reading 35% proficiency, ranked #142 of 178 in NC (top 80%) — families likely to look elsewhere, expect single-tenant / working-renter base with shorter leases.
- Zoned schools: Koontz Elementary (math 8% / reading 17%, grade F, #1,362 of 1,410 statewide, top 97%, 515 students, 94% FRL); Knox Middle (math 12% / reading 21%, grade F, #449 of 475 statewide, top 96%, 514 students, 95% FRL); Salisbury High (math 27% / reading 47%, grade F, #414 of 535 statewide, top 79%, 959 students, 66% FRL) — zoned schools average 85% FRL vs 54% district-wide (30 pts higher); higher-poverty schools than district average — tighter screening recommended.
- Market conditions: 291 active listings in the ZIP; 592 units permitted in Rowan County in 2024 (5 in 5+ unit buildings).
- This rent runs 45% of the median local income ($53k/yr) — at the standard rent-burdened threshold; future hikes will face affordability resistance.
Forward outlook
- Local home prices are declining (-3.0%/yr); year-one equity from $1k of loan paydown is wiped out by about $5k of value loss. Plan a longer hold.
- Rowan County population projected to shrink 6% by 2050 — rents likely to lag national; underwrite the cash flow, not the appreciation.
Negotiation context
- It's been on market 269 days — a 12% lower offer ($149k) is reasonable based on typical stale-listing flexibility.
- 2 sale attempts with the ask held roughly flat each time — persistent listings suggest the price (not the market) is what's stuck; bring a comps-based counter.
Risks & watch-outs
- Watch-outs: built in 1900 — expect roof / HVAC / electrical / plumbing capex.
- Climate carrying-cost: extreme-heat days projected 7→17/yr by 2055 (HVAC capex compounding) — expect insurance premiums to compound above CPI over the hold.
Questions for the listing agent
- It's been on market 269 days. Have you received any prior offers? Is the seller open to a 12% concession, seller financing, or rate buy-down credit?
- Built in 1900 — when were the roof, HVAC, electrical panel, plumbing, and water heater last replaced?
- Why hasn't it sold? Are there any deal-killer items the seller is aware of (foundation, flood, title, zoning, code violations)?
- Is there a deadline driving the sale (1031 exchange, divorce, estate, relocation)? That informs how much negotiation room exists.
- Schools are F-rated, which usually means shorter tenancies and higher turnover. Who's the typical renter profile here, and what's been the actual vacancy rate?
- Crime grade is F in this area — have there been break-ins, vandalism, or insurance claims at this property in the last 3 years? What carrier currently insures it and at what premium?
- What's the average days-on-market for RENTAL listings here right now (not sales)? A rising rental-DOM trend means longer vacancies and softer asking-rent achievability than the comps imply.
- What's the recent tenant-quality profile in this submarket — average credit score on applications, eviction rate, late-payment / NSF rate, and stable-employment percentage? A property-management company in the area should have these aggregated.
- How much new for-sale + rental construction is in the pipeline within 1–3 miles? Heavy new supply typically softens prices + rents 12–24 months out; constrained supply supports both.
Investment metrics
- 1% rule
- 1.16% ✓
- Cap rate
- 9.25%
- Cash-on-cash
- 10.56%
- DSCR
- 1.47
- GRM
- 7.2
CMA / ARV
- ARV (on-the-fly)
- $291,200
- Comps found
- 9
Show comp detail 9 sales within ~0.75 mi
| Address | Dist | Beds/Ba | Sqft | Sold | Price | $/sf | Match |
|---|---|---|---|---|---|---|---|
| 629 S Fulton St | 0.20mi | 4/2.0 (-1) | 2,078 (-0%) | 14mo | $300,000 | $144 | 70 |
| 528 Mitchell Ave | 0.66mi | 5/3.5 | 2,137 (+3%) | 3mo | $300,000 | $140 | 53 |
| 510 Wiley Ave | 0.59mi | 4/2.0 (-1) | 2,133 (+2%) | 12mo | $325,000 | $152 | 49 |
| 799 Gondola Ct | 0.71mi | 4/2.5 (-1) | 2,078 (-0%) | 13mo | $365,445 | $176 | 45 |
| 182 Ryan St | 0.48mi | 4/2.0 (-1) | 1,879 (-10%) | 12mo | $232,000 | $123 | 42 |
| 1175 Kildare Dr #3 | 0.70mi | 4/2.0 (-1) | 1,902 (-9%) | 6mo | $331,400 | $174 | 38 |
| 129 Maupin Ave | 0.50mi | 4/3.0 (-1) | 2,319 (+12%) | 14mo | $140,000 | $60 | 33 |
| 525 Mitchell Ave | 0.67mi | 4/2.0 (-1) | 2,254 (+8%) | 18mo | $260,000 | $115 | 31 |
| 401 Mitchell Ave | 0.56mi | 4/2.0 (-1) | 2,354 (+13%) | 22mo | $325,000 | $138 | 24 |
Match score weights: distance 35% · size 25% · config 20% · recency 20%. Top-matched comps best support the ARV.
Projected returns pro-forma
-3.0% appreciation · 3.0% rent growth · sell at horizon
- IRR
- -0.5%
- Equity multiple
- 0.98×
- Total profit
- $-856
- Equity at exit
- $25,198
- IRR
- 9.2%
- Equity multiple
- 1.71×
- Total profit
- $33,447
- Equity at exit
- $14,612
Cash invested: $47,320 (down + closing). Projections, not guarantees.
Landlord ↔ Tenant lean methodology
- Overall (STATE)
- 85 Strongly Landlord-Friendly
- State North Carolina
- 85 Strongly Landlord-Friendly · R+3
- County
- — inherits STATE
- City
- — inherits STATE
ZIP-level market 28144
- Active inventory
- 291
- Price-to-rent
- 7.2×
Monthly cashflow live
- Estimated rent
- $1,967 medium interval (Pro) →
- Mortgage (P&I)
- −$886
- Tax from tax record
- −$181 /mo · $2,175/yr
- Insurance
- −$70
- HOA
- −$0
- Vacancy / Maint / Mgmt
- −$413
- Net cashflow
- $416
Break-even live
Sensitivity live
| Price | -10% $512 | -5% $464 | +0% $416 | +5% $369 | +10% $321 |
|---|---|---|---|---|---|
| Rent | -10% $261 | -5% $339 | +0% $416 | +5% $494 | +10% $572 |
| Rate | -1.0pp $501 | -0.5pp $459 | base $416 | +0.5pp $373 | +1.0pp $328 |
UW: 25.0% down · 7.5% · 30yr · 1.5% tax · 5.0% vac · 8.0% maint · 8.0% mgmt
Financing live
Cash to close
- Down payment
- $42,250
- Closing costs
- $5,070
- Reserves months
- —
- Total cash needed
- —
Loan-product check · same deal, 3 products live
Conventional
25% down · 7.5% · 30yr
- Down + closing
- —
- Monthly P&I
- —
- Monthly cashflow
- —
- DSCR
- —
- Eligible?
- —
Personal DTI + credit; lowest rate.
DSCR
20% down · 8.5% · 30yr
- Down + closing
- —
- Monthly P&I
- —
- Monthly cashflow
- —
- DSCR
- —
- Eligible?
- —
No personal income docs; deal must DSCR.
Hard money
10% down · 12.0% · 12mo
- Down + closing
- —
- Monthly P&I
- —
- Monthly cashflow
- —
- DSCR
- —
- Eligible?
- —
Short-term bridge; refi at stabilization.
Listing history 18 events
-
2026-06-21days on market $169,000 Active 269 DOM
-
2026-06-18days on market $169,000 Active 266 DOM
-
2026-06-17days on market $169,000 Active 265 DOM
-
2026-06-16days on market $169,000 Active 264 DOM
-
2026-06-15days on market $169,000 Active 263 DOM
-
2026-06-13days on market $169,000 Active 261 DOM
-
2026-06-10days on market $169,000 Active 257 DOM
-
2026-06-08days on market $169,000 Active 256 DOM
-
2026-06-07days on market $169,000 Active 255 DOM
-
2026-06-04days on market $169,000 Active 252 DOM
-
2026-06-03days on market $169,000 Active 251 DOM
-
2026-06-02days on market $169,000 Active 250 DOM
-
2026-06-01days on market $169,000 Active 249 DOM
-
2026-05-31days on market $169,000 Active 248 DOM
-
2026-02-02price $169,000
-
2025-11-03status Active
-
2025-10-27historical Active Under Contract
-
2025-09-24$175,000 Active
ⓘ Source: listings_history table (triggers on properties + properties_extension) + one-shot
backfill from property_details.listing_events for pre-trigger history.
Tax reassessment forecast NC · Resets to sale price
- Current annual tax
- $2,175 · $181/mo
- Projected year-2 tax
- $2,175 · $181/mo
- Expected delta
- $0/yr ($0/mo · 0.0%)
ⓘ Screening estimate from a state-policy table — verify with the county assessor before closing.
Climate risk First Street
- Flood 1/10 Low FEMA zone X (unshaded) · 0% chance over 30 yrs
- Wildfire 1/10 Low
- Heat 6/10 Major 7 d/yr ≥104°F today · 17 d/yr by 30 yrs out
- Wind 4/10 Moderate 12% chance of damaging wind over 30 yrs
- Air quality 3/10 Moderate 2 unhealthy d/yr today · 3 by 30 yrs out
Nearby sold comps map
Loading sold comps map…
Walkable amenities ~0.75 mi
Loading nearby amenities…
Taxation est. · year 1
- Rental income
- $23,609
- − Mortgage interest
- −$9,467
- − Property taxes
- −$2,175
- − Insurance
- −$845
- − Repairs & maintenance
- −$1,889
- − Management
- −$1,889
- − Depreciation
- −$4,916
- Taxable income
- $2,429
- Est. tax owed @ 24.0%
- −$583
- After-tax cash flow
- $4,413/yr
For passive investors: Depreciation is non-cash, so a rental often shows a tax loss while cash-flowing — sheltering income. Rental losses are passive: they offset passive income freely, and up to $25,000/yr can offset ordinary (W-2) income if you actively participate and your MAGI is under $100k (phasing out to $0 by $150k); unused losses carry forward. On sale, claimed depreciation is recaptured at up to 25%, and gains may owe capital-gains tax (a 1031 exchange can defer both). Figures are a year-1 estimate at your 24.0% rate — not tax advice; consult a CPA.
Schools (NCES district)
- District
- Rowan-Salisbury Schools
- NCES district ID
- 3704050
- Math proficiency
- 26% ▲ 2.00%
- Reading proficiency
- 35% ▲ 1.00%
- Median HH income
- $43,953
- Composite
- 26.01/100
- National rank
- #7317
- State rank
- #142 of 178 in NC
Livability — Salisbury
- Score
- 64/100
- State rank
- #365
- US rank
- #14533
Category grades
Schools grade is shown separately in the Schools card above.
Census & demographics
- Census place
- Salisbury, NC
- County
- Rowan County · 103,630 people
- City population
- 85,081
- Metro
- Charlotte-Concord-Gastonia, NC-SC
- Population (ZIP)
- 27,977
- Household income
- $52,568
- Rent vs Own
- Severe rent burden
- 1438.0
Population outlook (Rowan County) Hauer SSP2
- Today (2025)
- 140,430 people
- By 2030
- 140,193 · -0.2%
- By 2040
- 137,617 · -2.0%
- By 2050
- 131,826 · -6.1%
- By 2075
- 115,123 · -18.0%
- By 2100
- 92,774 · -33.9%
Race, ethnicity, and origin ACS 2023
- Neighborhood character
- Diverse neighborhood (Simpson 0.63)
- Race & ethnicity
- White 49% Black 35% Hispanic / Latino 12% Two or more races 7%
- Hispanic origin (detail)
- Mexican 4% Puerto Rican 2%
- Common ancestry
- Serbian 3% Slovak 2% Lithuanian 1%
- Foreign-born
- 5% · Canada
- Languages at home
- 91% English-only · Spanish 7% Other Indo-European 1%
Political lean MEDSL · Rowan
- 2024 margin
- Solid R (+35.9) · D 31.6% · R 67.5%
- 2008→2024 swing
- -13.1pp toward R · 2008: -22.8pp · 2024: -35.9pp
- All cycles
- 2024: R+35.9 2020: R+35.7 2016: R+36.8 2012: R+26.0 2008: R+22.8
Not yet ingested
- Civics
- —
Market trends
- HPI YoY
- ▼ -217.00%
- Current HPI
- 276.1097
- Rent YoY
- —
- Metro
- Charlotte-Concord-Gastonia, NC-SC
- State GDP YoY
- ▲ 3.28%
- F500 in state
- 26
Industry mix (Fortune 500 HQ in NC)
| Industry | F500 HQs | Revenue |
|---|---|---|
| Financial Services | 2 | $213B |
|
||
| Retail | 2 | $95B |
|
||
| Industrial Conglomerate | 1 | $38B |
|
||
| Metals / Steel | 1 | $35B |
|
||
| Utilities | 1 | $30B |
|
||
| Industrial Machinery | 1 | $19B |
|
||
Price history
-3.4% since first listed4 events — show timeline
- 2026-02-02 Price Changed $169,000 CANOPYMLS as Distributed by MLS Grid
- 2025-11-03 Relisted — CANOPYMLS as Distributed by MLS Grid
- 2025-10-27 Contingent — CANOPYMLS as Distributed by MLS Grid
- 2025-09-24 Listed $175,000 CANOPYMLS as Distributed by MLS Grid
Property tax history
+4.5%/yrLatest (2025): $2,175 · +0.0% YoY. Source: county tax records.
Cash-flow waterfall
monthlySold comps — $/sqft
last 12 mo · ≤1 miLoading sold comps…