 Fourplex
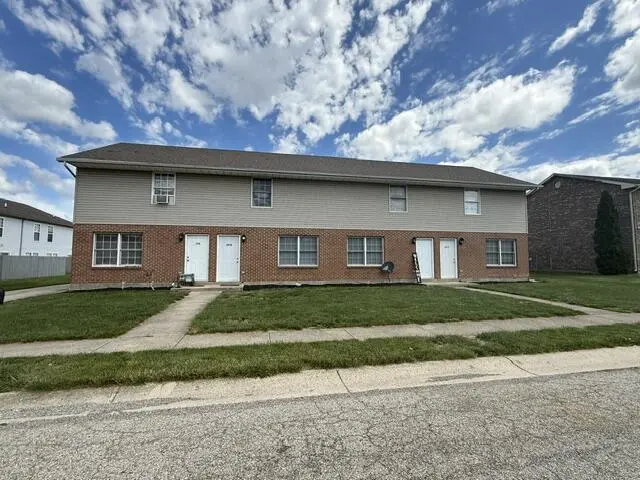
1014 Eleanor Ave · Piqua, OH
Flood risk 1/10 · Minimal
- FEMA flood zone
- X (unshaded)
- Chance of flooding over 30 yrs
- 0.0%
- Est. flood insurance / yr
- $507 – $1,088
Fire risk 1/10 · Minimal
- Est. fire insurance / yr
- $713 – $1,323
Heat risk 3/10 · Minor
- Hot days now (above 100°F)
- 7 days/yr
- Hot days in 30 yrs
- 18 days/yr
Wind risk 2/10 · Minimal
- Chance of severe wind over 30 yrs
- —
Air-quality risk 2/10 · Minimal
- Unhealthy air days now
- 1 days/yr
- Unhealthy air days in 30 yrs
- 2 days/yr
Risk factors via First Street. Map © Google.
Why this score? — see what drove the C grade
The composite is a weighted blend of 9 inputs, each scored 0–100. Each bar is that input's sub-score; the figure is the points it added to the 100-point composite (weight × sub-score).
- Cash flow +24.0/30.0
- DSCR +7.7/10.0
- ARV discount +7.5/15.0
- 1% rule +6.2/10.0
- Schools +4.0/10.0
- Condition / age +3.8/5.0
- Livability +3.1/5.0
- Rent growth +2.5/5.0
- Appreciation +0.0/10.0
$449,900
🖨 Deal sheet (PDF) 📄 Offer letter ✓ Due diligence
Multi-family units
County records classify this as Multi-Family (2-4 Unit). Listing-text estimate: 4 units. confirmed
Listing remarks
Excellent investment opportunity! This well maintained four unit. .. .3 bedroom apartments with numerous updates throughout. Improvements in 3 apartments include flooring, cabinets and heat pumps, newer appliances. Parking in the back of building. A great layout! Call today for your private showing.
Key facts
- 0.31 acre lot
- Built 1999
- Listed 5 days
Property features AI
Finance
- Financial info: 4 total dwelling units
Exterior
- Utilities: Public sewer
- Home design: Multi-family property; Built in 1999
- Construction: Brick and vinyl siding exterior; Slab foundation
- Exterior features: Patio; Public water supply
Interior
- Kitchen: Dishwasher; Range; Refrigerator; Garbage disposal
- Flooring: Laminate; Tile
- Bathrooms: 8 total bathrooms (4 full, 4 half)
- Heating & cooling: Heat pump for heating; Heat pump for cooling
- Interior features: Dishwasher; Disposal; Range; Refrigerator; Laminate flooring; Tile flooring; No basement
Neighborhood map
What this means for you Summary
Snapshot
- This is a 4 × 3-bed/1.5-bath units multifamily listed at $450k. Condition is rated good.
Deal economics
- At list price, monthly cash flow is $880 ($11k/yr) — positive. Per door: $220/mo.
- The deal already cash-flows at list — no discount required.
- Meets the 1% rule at list price ($5k rent vs $450k).
- Cap rate 8.6% vs local median 4.7% in Piqua — top-decile yield for the area; either an underpriced asset or a hidden risk that comps aren't pricing in. Stress-test before assuming the spread holds.
Location & tenants
- Location reads 62/100 on livability (#887 in OH) — a middle-class / working-renter tenant base. Strengths: cost of living A+, housing A+; Watch: employment D+, crime F, amenities F.
- Piqua City (rural): math 45% / reading 50% proficiency, ranked #482 of 656 in OH (top 74%) — families likely to look elsewhere, expect single-tenant / working-renter base with shorter leases.
- Zoned schools: Piqua High School (math 12% / reading 57%, grade F, #582 of 781 statewide, top 76%, 876 students, 52% FRL) — zoned schools at 52% FRL track the district average.
- Zoned-school proficiency averages 34% at this address vs 48% district-wide (-13 pts) — the specific schools serving this property underperform the Piqua City average; the district grade overstates school quality for this exact location.
- Market conditions: 139 active listings in the ZIP; 326 units permitted in Miami County in 2024 (0 in 5+ unit buildings).
- At $5,049/mo this rent would consume 88% of the median local household income ($69k/yr) (locally 748% of renters already pay >50% of income on rent) — very limited rent-growth headroom before tenants either downsize or default.
Forward outlook
- Local home prices are declining (-3.0%/yr); year-one equity from $3k of loan paydown is wiped out by about $13k of value loss. Plan a longer hold.
Negotiation context
- Only 5 days on market — expect competitive offers; lowballing is unlikely to land.
Questions for the listing agent
- Can we see the unit-by-unit rent roll, current vacancy, and any below-market leases? What's the average tenancy length?
- What capital expenditures (roof, boiler, parking lot, exteriors) have been made in the last 5 years, and what's planned in the next 2?
- Is there a deadline driving the sale (1031 exchange, divorce, estate, relocation)? That informs how much negotiation room exists.
- Crime grade is F in this area — have there been break-ins, vandalism, or insurance claims at this property in the last 3 years? What carrier currently insures it and at what premium?
- What's the average days-on-market for RENTAL listings here right now (not sales)? A rising rental-DOM trend means longer vacancies and softer asking-rent achievability than the comps imply.
- What's the recent tenant-quality profile in this submarket — average credit score on applications, eviction rate, late-payment / NSF rate, and stable-employment percentage? A property-management company in the area should have these aggregated.
- How much new apartment / multifamily construction is in the pipeline within 1–3 miles? Heavy new supply (>2% of stock underway) typically softens rents 12–24 months out; light construction supports rent growth.
Investment metrics
- 1% rule
- 1.12% ✓
- Cap rate
- 8.64%
- Cash-on-cash
- 8.38%
- DSCR
- 1.37
- GRM
- 7.4
CMA / ARV
No comps found within radius.
Projected returns pro-forma
-3.0% appreciation · 3.0% rent growth · sell at horizon
- IRR
- -3.6%
- Equity multiple
- 0.87×
- Total profit
- $-16,808
- Equity at exit
- $67,082
- IRR
- 6.2%
- Equity multiple
- 1.46×
- Total profit
- $57,807
- Equity at exit
- $38,899
Cash invested: $125,972 (down + closing). Projections, not guarantees.
Landlord ↔ Tenant lean methodology
- Overall (STATE)
- 73 Landlord-Friendly
- State Ohio
- 73 Landlord-Friendly · R+6
- County
- — inherits STATE
- City
- — inherits STATE
ZIP-level market 45356
- Active inventory
- 139
- Price-to-rent
- 29.7×
Monthly cashflow live
- Estimated rent
- $5,049 medium interval (Pro) →
- Mortgage (P&I)
- −$2,359
- Tax est. 1.5%
- −$562 /mo · $6,748/yr
- Insurance
- −$187
- HOA
- −$0
- Vacancy / Maint / Mgmt
- −$1,060
- Net cashflow
- $880
Break-even live
Sensitivity live
| Price | -10% $1,190 | -5% $1,035 | +0% $880 | +5% $724 | +10% $569 |
|---|---|---|---|---|---|
| Rent | -10% $481 | -5% $680 | +0% $880 | +5% $1,079 | +10% $1,278 |
| Rate | -1.0pp $1,106 | -0.5pp $994 | base $880 | +0.5pp $763 | +1.0pp $644 |
4-unit breakdown (identical units grouped — click to expand)
| Units | Beds | Baths | Est. rent |
|---|---|---|---|
| 4× units | 3 | 1.5 | $5,048 |
| #1 | 3 | 1.5 | $1,262 |
| #2 | 3 | 1.5 | $1,262 |
| #3 | 3 | 1.5 | $1,262 |
| #4 | 3 | 1.5 | $1,262 |
| Total (4 units) | $5,049 | ||
UW: 25.0% down · 7.5% · 30yr · 1.5% tax · 5.0% vac · 8.0% maint · 8.0% mgmt
Financing live
Cash to close
- Down payment
- $112,475
- Closing costs
- $13,497
- Reserves months
- —
- Total cash needed
- —
Loan-product check · same deal, 3 products live
Conventional
25% down · 7.5% · 30yr
- Down + closing
- —
- Monthly P&I
- —
- Monthly cashflow
- —
- DSCR
- —
- Eligible?
- —
Personal DTI + credit; lowest rate.
DSCR
20% down · 8.5% · 30yr
- Down + closing
- —
- Monthly P&I
- —
- Monthly cashflow
- —
- DSCR
- —
- Eligible?
- —
No personal income docs; deal must DSCR.
Hard money
10% down · 12.0% · 12mo
- Down + closing
- —
- Monthly P&I
- —
- Monthly cashflow
- —
- DSCR
- —
- Eligible?
- —
Short-term bridge; refi at stabilization.
Listing history 4 events
-
2026-06-21days on market $449,900 Active 5 DOM
-
2026-06-18days on market $449,900 Active 2 DOM
-
2026-06-17remarks 303-char remark
-
2026-06-17$449,900 Active 1 DOM
ⓘ Source: listings_history table (triggers on properties + properties_extension) + one-shot
backfill from property_details.listing_events for pre-trigger history.
Climate risk First Street
- Flood 1/10 Low FEMA zone X (unshaded) · 0% chance over 30 yrs
- Wildfire 1/10 Low
- Heat 3/10 Moderate 7 d/yr ≥100°F today · 18 d/yr by 30 yrs out
- Wind 2/10 Low
- Air quality 2/10 Low 1 unhealthy d/yr today · 2 by 30 yrs out
Nearby sold comps map
Loading sold comps map…
Walkable amenities ~0.75 mi
Loading nearby amenities…
Taxation est. · year 1
- Rental income
- $60,588
- − Mortgage interest
- −$25,201
- − Property taxes
- −$6,748
- − Insurance
- −$2,250
- − Repairs & maintenance
- −$4,847
- − Management
- −$4,847
- − Depreciation
- −$13,088
- Taxable income
- $3,607
- Est. tax owed @ 24.0%
- −$866
- After-tax cash flow
- $9,689/yr
For passive investors: Depreciation is non-cash, so a rental often shows a tax loss while cash-flowing — sheltering income. Rental losses are passive: they offset passive income freely, and up to $25,000/yr can offset ordinary (W-2) income if you actively participate and your MAGI is under $100k (phasing out to $0 by $150k); unused losses carry forward. On sale, claimed depreciation is recaptured at up to 25%, and gains may owe capital-gains tax (a 1031 exchange can defer both). Figures are a year-1 estimate at your 24.0% rate — not tax advice; consult a CPA.
Condition & rehab AI · 10 photos
This four-unit multi-family property is in good condition with recent updates and improvements. It offers a great investment opportunity with potential for further value enhancement through cosmetic updates and smart home features.
Value-add opportunities
- Both Painting the interior walls and updating the flooring in the kitchen and bathrooms. — Fresh paint and updated flooring can enhance the home's curb appeal and interior aesthetics, attracting more potential buyers or renters.
- Both Upgrading the kitchen appliances. — Modern appliances can improve the home's functionality and appeal to a broader range of potential buyers or renters.
- Both Updating the bathroom fixtures. — Fresh, modern fixtures can enhance the home's functionality and appeal to a broader range of potential buyers or renters.
- Both Landscaping improvements. — Enhanced landscaping can improve the home's curb appeal and attract more potential buyers or renters.
- Both Adding smart home features. — Smart home features can improve the home's functionality and appeal to a broader range of potential buyers or renters.
- Both Upgrading the HVAC system. — A more efficient HVAC system can improve the home's comfort and energy efficiency, attracting more potential buyers or renters.
Renovation cost estimate screening
Value-add ROI direction
- Both Painting the interior walls and updating the flooring in the kitchen and bathrooms. — Fresh paint and updated flooring can enhance the home's curb appeal and interior aesthetics, attracting more potential buyers or renters. ↑
- Both Upgrading the kitchen appliances. — Modern appliances can improve the home's functionality and appeal to a broader range of potential buyers or renters. ↑
- Both Updating the bathroom fixtures. — Fresh, modern fixtures can enhance the home's functionality and appeal to a broader range of potential buyers or renters. ↑
- Both Landscaping improvements. — Enhanced landscaping can improve the home's curb appeal and attract more potential buyers or renters. ↑
- Both Adding smart home features. — Smart home features can improve the home's functionality and appeal to a broader range of potential buyers or renters. ↑
- Both Upgrading the HVAC system. — A more efficient HVAC system can improve the home's comfort and energy efficiency, attracting more potential buyers or renters. ↑
ⓘ Cost ranges are severity-bucket heuristics (US national rule-of-thumb). Get contractor quotes + a written scope before underwriting a rehab budget.
Schools (NCES district)
- District
- Piqua City
- NCES district ID
- 3904464
- Math proficiency
- 45% ▼ -11.00%
- Reading proficiency
- 50% ▼ -7.00%
- Median HH income
- $41,751
- Composite
- 39.91/100
- National rank
- #3855
- State rank
- #482 of 656 in OH
Livability — Piqua
- Score
- 62/100
- State rank
- #887
- US rank
- #16830
Category grades
Schools grade is shown separately in the Schools card above.
Census & demographics
- Census place
- Piqua, OH
- County
- Miami County · 85,667 people
- City population
- 25,237
- Metro
- Dayton-Kettering, OH
- Population (ZIP)
- 25,237
- Household income
- $69,188
- Rent vs Own
- Severe rent burden
- 748.0
Population outlook (Miami County) Hauer SSP2
- Today (2025)
- 107,816 people
- By 2030
- 108,896 · +1.0%
- By 2040
- 109,581 · +1.6%
- By 2050
- 108,110 · +0.3%
- By 2075
- 101,523 · -5.8%
- By 2100
- 85,787 · -20.4%
Race, ethnicity, and origin ACS 2023
- Neighborhood character
- Predominantly White (92%)
- Race & ethnicity
- White 92% Two or more races 3% Black 2% Hispanic / Latino 1%
- Common ancestry
- Iranian 2% Italian 2% Lithuanian 2%
- Foreign-born
- 1%
- Languages at home
- 99% English-only · Spanish 1% Vietnamese 0%
Political lean MEDSL · Miami
- 2024 margin
- Solid R (+45.1) · D 27.0% · R 72.1%
- 2008→2024 swing
- -16.6pp toward R · 2008: -28.5pp · 2024: -45.1pp
- All cycles
- 2024: R+45.1 2020: R+44.3 2016: R+45.6 2012: R+35.6 2008: R+28.5
Not yet ingested
- Civics
- —
Market trends
- HPI YoY
- ▼ -137.96%
- Current HPI
- 251.435
- Rent YoY
- —
- Metro
- Dayton-Kettering, OH
- State GDP YoY
- ▲ 1.98%
- F500 in state
- 48
Industry mix (Fortune 500 HQ in OH)
| Industry | F500 HQs | Revenue |
|---|---|---|
| Insurance | 3 | $145B |
|
||
| Industrial Machinery | 3 | $49B |
|
||
| Financial Services | 3 | $24B |
|
||
| Consumer Goods | 2 | $93B |
|
||
| Aerospace / Defense | 2 | $47B |
|
||
| Utilities | 2 | $33B |
|
||
Price history
1 event — show timeline
- 2026-06-12 Listed $449,900 WRIST
Cash-flow waterfall
monthlySold comps — $/sqft
last 12 mo · ≤1 miLoading sold comps…