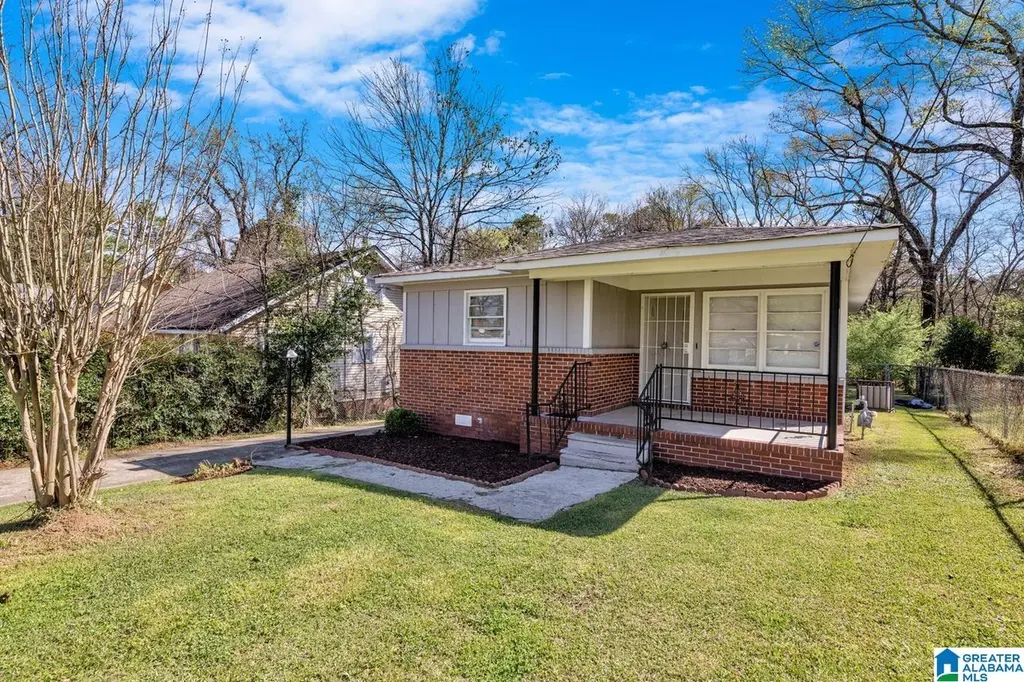
6737 Frankfort Ave · Birmingham, AL
Flood risk 1/10 · Minimal
- FEMA flood zone
- X (unshaded)
- Chance of flooding over 30 yrs
- 0.0%
- Est. flood insurance / yr
- $507 – $1,088
Fire risk 1/10 · Minimal
- Est. fire insurance / yr
- $916 – $1,700
Heat risk 6/10 · Moderate
- Hot days now (above 106°F)
- 7 days/yr
- Hot days in 30 yrs
- 19 days/yr
Wind risk 6/10 · Moderate
- Chance of severe wind over 30 yrs
- 27.0%
Air-quality risk 5/10 · Moderate
- Unhealthy air days now
- 8 days/yr
- Unhealthy air days in 30 yrs
- 10 days/yr
Risk factors via First Street. Map © Google.
Why this score? — see what drove the D grade
The composite is a weighted blend of 9 inputs, each scored 0–100. Each bar is that input's sub-score; the figure is the points it added to the 100-point composite (weight × sub-score).
- Cash flow +20.4/30.0
- DSCR +6.5/10.0
- 1% rule +5.3/10.0
- Livability +3.4/5.0
- Rent growth +2.5/5.0
- Condition / age +2.5/5.0
- Schools +0.9/10.0
- ARV discount +0.0/15.0
- Appreciation +0.0/10.0
$109,000
🖨 Deal sheet (PDF) 📄 Offer letter ✓ Due diligence
Listing remarks MLS
Updated with fresh paint and beautiful flooring throughout, this charming home is a perfect starter home or investment property. Brand new roof, as well as brand new appliances and recently rehabbed kitchen! Enjoy a convenient location near downtown amenities, restaurants, shopping, and everything you need. Great value with plenty of appeal. schedule your showing now!
Key facts
- Downtown amenities
- Fresh paint
- Beautiful flooring
Tags
Neighborhood map
What this means for you Summary
Snapshot
- This is a 3-bed/1.0-bath single-family listed at $109k.
Deal economics
- At list price, monthly cash flow is $142 ($2k/yr) — positive.
- The deal already cash-flows at list — no discount required.
- Meets the 1% rule at list price ($1k rent vs $109k).
- Recommended offer: $99k (9.0% below list) — sets the bar for market timing.
- Cap rate 7.9% vs local median 6.2% in Birmingham — meaningfully above typical; check what's discounted (condition, days-on-market, listing class) to confirm the premium yield is real.
Location & tenants
- Location reads 67/100 on livability (#78 in AL) — a middle-class / working-renter tenant base. Strengths: commute A+, cost of living A+, housing A+; Watch: amenities C-, schools F, crime F.
- Birmingham City (urban): math 4% / reading 20% proficiency, ranked #116 of 129 in AL (top 90%) — low school quality limits family demand, transient renter base, plan for 1-2y turnover; 82% free/reduced lunch — lower-income household profile, screen leases tightly.
- Market conditions: 80 active listings in the ZIP; 40 comparable units currently listed for rent nearby; rentals lingering (median 46d on market — plan ~5-8 weeks vacancy on turnover, expect pricing pressure); 55% of comp listings sitting > 30 days — soft ceiling on asking rent; lower-income renter base — watch delinquency; 2,114 units permitted in Jefferson County in 2024 (556 in 5+ unit buildings).
- This rent runs 37% of the median local income ($37k/yr) — at the standard rent-burdened threshold; future hikes will face affordability resistance.
Forward outlook
- Local home prices are declining (-3.0%/yr); year-one equity from $754 of loan paydown is wiped out by about $3k of value loss. Plan a longer hold.
- Jefferson County population projected to shrink 4% by 2050 — rents likely to lag national; underwrite the cash flow, not the appreciation.
Negotiation context
- It's been on market 101 days — a 9% lower offer ($99k) is reasonable based on typical stale-listing flexibility.
- 4 sale attempts since 11y ago; this cycle's ask has dropped $10k (8%) from the opening price — seller is motivated, your offer sets the floor, not the list.
- Current owner paid $75k; 46% above their basis — modest negotiation headroom, anchor on the comps not their cost.
Risks & watch-outs
- Climate carrying-cost: major wind risk, 27% chance of damaging wind over 30y; extreme-heat days projected 7→19/yr by 2055 (HVAC capex compounding) — expect insurance premiums to compound above CPI over the hold.
Questions for the listing agent
- It's been on market 101 days. Have you received any prior offers? Is the seller open to a 9% concession, seller financing, or rate buy-down credit?
- Built in 1960 — when were the roof, HVAC, electrical panel, plumbing, and water heater last replaced?
- Why hasn't it sold? Are there any deal-killer items the seller is aware of (foundation, flood, title, zoning, code violations)?
- Is there a deadline driving the sale (1031 exchange, divorce, estate, relocation)? That informs how much negotiation room exists.
- Schools are F-rated, which usually means shorter tenancies and higher turnover. Who's the typical renter profile here, and what's been the actual vacancy rate?
- Crime grade is F in this area — have there been break-ins, vandalism, or insurance claims at this property in the last 3 years? What carrier currently insures it and at what premium?
- The area grade is low — what's the realistic commute time and amenity access for the typical tenant pool here? Any planned neighborhood developments (good or bad) we should know about?
- What's the average days-on-market for RENTAL listings here right now (not sales)? A rising rental-DOM trend means longer vacancies and softer asking-rent achievability than the comps imply.
- What's the recent tenant-quality profile in this submarket — average credit score on applications, eviction rate, late-payment / NSF rate, and stable-employment percentage? A property-management company in the area should have these aggregated.
- How much new for-sale + rental construction is in the pipeline within 1–3 miles? Heavy new supply typically softens prices + rents 12–24 months out; constrained supply supports both.
Investment metrics
- 1% rule
- 1.03% ✓
- Cap rate
- 7.86%
- Cash-on-cash
- 5.59%
- DSCR
- 1.25
- GRM
- 8.1
CMA / ARV
- ARV (median comp)
- $73,327
- List price
- $109,000
- Delta
- 48.65%
- Verdict
- OVERPRICED
- Comps
- 20 within 1.0 mi
Show comp detail 12 sales within ~0.75 mi
| Address | Dist | Beds/Ba | Sqft | Sold | Price | $/sf | Match |
|---|---|---|---|---|---|---|---|
| 6821 65th St S | 0.26mi | 3/1.0 | 1,013 (-3%) | 7mo | $45,000 | $44 | 77 |
| 221 72nd St S | 0.51mi | 3/1.0 | 1,015 (-3%) | 2mo | $75,000 | $74 | 70 |
| 7213 Higdon Rd | 0.27mi | 3/1.5 | 1,008 (-4%) | 12mo | $60,000 | $60 | 70 |
| 6511 3rd Ave S | 0.43mi | 3/1.0 | 1,020 (-2%) | 10mo | $25,000 | $25 | 68 |
| 6817 Division Ave | 0.52mi | 3/1.0 | 1,104 (+6%) | 3mo | $93,000 | $84 | 64 |
| 6924 67th St S | 0.10mi | 2/1.0 (-1) | 916 (-12%) | 8mo | $15,000 | $16 | 63 |
| 6713 Harve Ave | 0.20mi | 2/1.0 (-1) | 936 (-10%) | 9mo | $35,000 | $37 | 61 |
| 900 Dublin Ave | 0.27mi | 3/1.0 | 1,190 (+14%) | 10mo | $60,000 | $50 | 56 |
| 6712 2nd Ave S | 0.41mi | 4/2.5 (+1) | 1,132 (+8%) | 2mo | $149,900 | $132 | 55 |
| 532 Athens Ct | 0.71mi | 3/1.0 | 1,139 (+9%) | 3mo | $95,000 | $83 | 49 |
| 6724 S 2nd Ave | 0.40mi | 4/2.0 (+1) | 1,188 (+14%) | 3mo | $113,000 | $95 | 47 |
| 7005 S 1st Ave | 0.50mi | 2/1.0 (-1) | 930 (-11%) | 12mo | $72,000 | $77 | 44 |
Match score weights: distance 35% · size 25% · config 20% · recency 20%. Top-matched comps best support the ARV.
Projected returns pro-forma
-3.0% appreciation · 3.0% rent growth · sell at horizon
- IRR
- -7.6%
- Equity multiple
- 0.72×
- Total profit
- $-8,599
- Equity at exit
- $16,252
- IRR
- 1.9%
- Equity multiple
- 1.14×
- Total profit
- $4,210
- Equity at exit
- $9,424
Cash invested: $30,520 (down + closing). Projections, not guarantees.
Landlord ↔ Tenant lean methodology
- Overall (STATE)
- 90 Strongly Landlord-Friendly
- State Alabama
- 90 Strongly Landlord-Friendly · R+15
- County
- — inherits STATE
- City
- — inherits STATE
ZIP-level market 35212
- Active inventory
- 80
- Price-to-rent
- 8.1×
Monthly cashflow live
- Estimated rent
- $1,119 high interval (Pro) →
- Mortgage (P&I)
- −$572
- Tax from tax record
- −$125 /mo · $1,498/yr
- Insurance
- −$45
- HOA
- −$0
- Lot rent
- −$0
- Vacancy / Maint / Mgmt
- −$235
- Net cashflow
- $142
Break-even live
Sensitivity live
| Price | -10% $204 | -5% $173 | +0% $142 | +5% $111 | +10% $80 |
|---|---|---|---|---|---|
| Rent | -10% $54 | -5% $98 | +0% $142 | +5% $186 | +10% $231 |
| Rate | -1.0pp $197 | -0.5pp $170 | base $142 | +0.5pp $114 | +1.0pp $85 |
UW: 25.0% down · 7.5% · 30yr · 1.5% tax · 5.0% vac · 8.0% maint · 8.0% mgmt
Financing live
Cash to close
- Down payment
- $27,250
- Closing costs
- $3,270
- Reserves months
- —
- Total cash needed
- —
Loan-product check · same deal, 3 products live
Conventional
25% down · 7.5% · 30yr
- Down + closing
- —
- Monthly P&I
- —
- Monthly cashflow
- —
- DSCR
- —
- Eligible?
- —
Personal DTI + credit; lowest rate.
DSCR
20% down · 8.5% · 30yr
- Down + closing
- —
- Monthly P&I
- —
- Monthly cashflow
- —
- DSCR
- —
- Eligible?
- —
No personal income docs; deal must DSCR.
Hard money
10% down · 12.0% · 12mo
- Down + closing
- —
- Monthly P&I
- —
- Monthly cashflow
- —
- DSCR
- —
- Eligible?
- —
Short-term bridge; refi at stabilization.
Rent comps 40 comps
| Address | Beds | Baths | Sqft | Rent | $/sqft | DOM | Units | Dist |
|---|---|---|---|---|---|---|---|---|
| 6732 Frankfort Ave Birmingham, AL | 3.0 | 1.0 | 924 | $995 | $1.08 | 46d | 1 | 0.03mi |
| 6936 66th St S Birmingham, AL | 3.0 | 1.0 | 880 | $1,050 | $1.19 | 46d | 1 | 0.15mi |
| 605 71st St S Birmingham, AL | 3.0 | 1.5 | 1024 | $1,303 | $1.27 | 4d | 1 | 0.30mi |
| 7025 4th Ave S Birmingham, AL | 3.0 | 1.0 | 1090 | $845 | $0.78 | 46d | 1 | 0.33mi |
| 417 Athens Ave Birmingham, AL | 3.0 | 1.5 | 978 | $1,250 | $1.28 | 26d | 1 | 0.40mi |
| 7005 2nd Ave S Birmingham, AL | 2.0 | 1.0 | 939 | $950 | $1.01 | 46d | 1 | 0.42mi |
| 201 70th St S Birmingham, AL | 2.0 | 1.0 | 989 | $950 | $0.96 | 46d | 1 | 0.43mi |
| 7129 3rd Ave S Birmingham, AL | 3.0 | 2.0 | 1264 | $1,095 | $0.87 | 5d | 1 | 0.47mi |
| 6820 Division Ave Birmingham, AL | 3.0 | 2.0 | 1122 | $1,050 | $0.94 | 26d | 1 | 0.56mi |
| 7119 1st Ave S Birmingham, AL | 2.0 | 1.0 | 720 | $1,000 | $1.39 | 46d | 1 | 0.57mi |
| 7017 Division Ave Birmingham, AL | 3.0 | 1.0 | 1100 | $1,050 | $0.95 | 46d | 1 | 0.58mi |
| 601 Dublin Ave Birmingham, AL | 4.0 | 1.5 | 1288 | $1,050 | $0.82 | 46d | 1 | 0.63mi |
| 516 Athens Ct Birmingham, AL | 2.0 | 1.0 | 738 | $1,123 | $1.52 | 4d | 1 | 0.66mi |
| 6309 3rd Ave S Birmingham, AL | 4.0 | 2.0 | 1228 | $1,495 | $1.22 | 4d | 1 | 0.66mi |
| 7213 Naples Ave Birmingham, AL | 3.0 | 1.5 | 925 | $1,100 | $1.19 | 46d | 1 | 0.67mi |
| 7213 Naples Ave Birmingham, AL | 3.0 | 1.5 | 937 | $1,100 | $1.17 | 14d | 1 | 0.67mi |
| 117 67th Pl N Birmingham, AL | 3.0 | 1.0 | 1202 | $800 | $0.67 | 18d | 1 | 0.68mi |
| 532 Athens Ct Birmingham, AL | 3.0 | 1.0 | 1138 | $1,125 | $0.99 | 46d | 1 | 0.70mi |
| 126 66th Pl N Birmingham, AL | 2.0 | 1.0 | 1038 | $1,200 | $1.16 | 17d | 1 | 0.73mi |
| 7330 1st Ave S Birmingham, AL | 3.0 | 1.0 | 1299 | $1,000 | $0.77 | 4d | 1 | 0.74mi |
| 7716 Sunrise Cir Birmingham, AL | 1.0–2.0 | 1.0 | 795 | $1,000 | $1.26 | 46d | 1 | 0.75mi |
| 7216 Paris Ave Birmingham, AL | 3.0 | 1.5 | 966 | $1,125 | $1.16 | 21d | 1 | 0.77mi |
| 224 69th Pl N Birmingham, AL | 3.0 | 1.0 | 894 | $975 | $1.09 | 46d | 1 | 0.79mi |
| 559 63rd St S Birmingham, AL | 3.0 | 1.0 | 930 | $1,000 | $1.08 | 5d | 1 | 0.80mi |
| 7313 Paris Ave Birmingham, AL | 3.0 | 2.0 | 1000 | $1,395 | $1.40 | 5d | 1 | 0.84mi |
| 7620 4th Ave S Birmingham, AL | 3.0 | 1.0 | 1144 | $1,025 | $0.90 | 46d | 1 | 0.86mi |
| 573 61st St S Birmingham, AL | 2.0 | 1.0 | 800 | $850 | $1.06 | 46d | 1 | 0.87mi |
| 7404 Paris Ave Birmingham, AL | 3.0 | 1.5 | 802 | $1,200 | $1.50 | 46d | 1 | 0.88mi |
| 630 77th St S Birmingham, AL | 2.0 | 2.0 | 1100 | $983 | $0.89 | 5d | 1 | 0.88mi |
| 6241 Crest Green Rd Birmingham, AL | 3.0 | 2.0 | 1380 | $1,210 | $0.88 | 26d | 1 | 0.95mi |
| 7728 Rugby Ave Birmingham, AL | 2.0 | 1.0 | 700 | $850 | $1.21 | 46d | 1 | 0.96mi |
| 7701 7th Ave S Birmingham, AL | 2.0 | 1.0 | 800 | $850 | $1.06 | 26d | 1 | 0.97mi |
| 7740 Rugby Ave Unit 2 Birmingham, AL | 2.0 | 1.0 | 800 | $1,000 | $1.25 | 46d | 1 | 0.99mi |
| 7740 Rugby Ave Unit b Birmingham, AL | 2.0 | 1.0 | 800 | $1,100 | $1.38 | 46d | 1 | 0.99mi |
| 7341 Rome Ave Birmingham, AL | 3.0 | 1.0 | 1000 | $1,275 | $1.27 | 5d | 1 | 0.99mi |
| 7341 Rome Ave Birmingham, AL | 3.0 | 1.0 | 1000 | $1,300 | $1.30 | 46d | 1 | 0.99mi |
| 6107 Crest Green Rd Birmingham, AL | 2.0 | 1.5 | 1273 | $995 | $0.78 | 46d | 1 | 1.01mi |
| 7721 1st Ave S Birmingham, AL | 3.0 | 1.0 | 956 | $949 | $0.99 | 26d | 1 | 1.03mi |
| 7728 1st Ave S Apt C Birmingham, AL | 2.0 | 1.0 | 950 | $950 | $1.00 | 46d | 1 | 1.06mi |
| 756 Vanderbilt St Birmingham, AL | 3.0 | 2.0 | 1096 | $1,000 | $0.91 | 46d | 1 | 1.07mi |
Listing history 30 events
-
2026-06-22days on market $109,000 Active 101 DOM
-
2026-06-21days on market $109,000 Active 100 DOM
-
2026-06-18days on market $109,000 Active 97 DOM
-
2026-06-17days on market $109,000 Active 96 DOM
-
2026-06-16days on market $109,000 Active 95 DOM
-
2026-06-15days on market $109,000 Active 94 DOM
-
2026-06-13days on market $109,000 Active 92 DOM
-
2026-06-10days on market $109,000 Active 89 DOM
-
2026-06-09days on market $109,000 Active 88 DOM
-
2026-06-08days on market $109,000 Active 87 DOM
-
2026-06-07days on market $109,000 Active 86 DOM
-
2026-06-03days on market $109,000 Active 82 DOM
-
2026-06-02days on market $109,000 Active 81 DOM
-
2026-06-01days on market $109,000 Active 80 DOM
-
2026-05-31days on market $109,000 Active 79 DOM
-
2026-04-30price $114,000 370-char remark
Show marketing remark (370 chars)
Updated with fresh paint and beautiful flooring throughout, this charming home is a perfect starter home or investment property. Brand new roof, as well as brand new appliances and recently rehabbed kitchen! Enjoy a convenient location near downtown amenities, restaurants, shopping, and everything you need. Great value with plenty of appeal. schedule your showing now!
-
2026-03-13$119,000 Active 370-char remark
Show marketing remark (370 chars)
Updated with fresh paint and beautiful flooring throughout, this charming home is a perfect starter home or investment property. Brand new roof, as well as brand new appliances and recently rehabbed kitchen! Enjoy a convenient location near downtown amenities, restaurants, shopping, and everything you need. Great value with plenty of appeal. schedule your showing now!
-
2024-08-28historical $1,075
-
2024-07-14$1,075
-
2021-01-12soldstatus $74,900
-
2021-01-08soldstatus $75,000 Sold 282-char remark
Show marketing remark (282 chars)
Freshly done houme with 3 bedrooms and one bathroom, front porch and back deck. Hardwood floor and tiles, updated bathroom and kitchen with granite counter, freshly painted throughout, fenced level backyard. A few blocks from Crestwood blvd in strong growing Woodlawn neighborhood.
-
2020-12-28historical Contingent 282-char remark
Show marketing remark (282 chars)
Freshly done houme with 3 bedrooms and one bathroom, front porch and back deck. Hardwood floor and tiles, updated bathroom and kitchen with granite counter, freshly painted throughout, fenced level backyard. A few blocks from Crestwood blvd in strong growing Woodlawn neighborhood.
-
2020-12-13$74,900 Active 282-char remark
Show marketing remark (282 chars)
Freshly done houme with 3 bedrooms and one bathroom, front porch and back deck. Hardwood floor and tiles, updated bathroom and kitchen with granite counter, freshly painted throughout, fenced level backyard. A few blocks from Crestwood blvd in strong growing Woodlawn neighborhood.
-
2016-02-12soldstatus $21,000 Sold
-
2016-01-28status Pending
-
2016-01-14price $29,900
-
2015-12-28price $32,900
-
2015-11-30$39,900 Active
-
2002-05-20soldstatus $57,400
-
1981-01-01soldstatus $27,324
ⓘ Source: listings_history table (triggers on properties + properties_extension) + one-shot
backfill from property_details.listing_events for pre-trigger history.
Tax reassessment forecast AL · Resets to sale price
- Current annual tax
- $1,498 · $125/mo
- Projected year-2 tax
- $1,498 · $125/mo
- Expected delta
- $0/yr ($0/mo · 0.0%)
ⓘ Screening estimate from a state-policy table — verify with the county assessor before closing.
Climate risk First Street
- Flood 1/10 Low FEMA zone X (unshaded) · 0% chance over 30 yrs
- Wildfire 1/10 Low
- Heat 6/10 Major 7 d/yr ≥106°F today · 19 d/yr by 30 yrs out
- Wind 6/10 Major 27% chance of damaging wind over 30 yrs
- Air quality 5/10 Major 8 unhealthy d/yr today · 10 by 30 yrs out
Nearby sold comps map
Loading sold comps map…
Walkable amenities ~0.75 mi
Loading nearby amenities…
Taxation est. · year 1
- Rental income
- $13,428
- − Mortgage interest
- −$6,106
- − Property taxes
- −$1,498
- − Insurance
- −$545
- − Repairs & maintenance
- −$1,074
- − Management
- −$1,074
- − Depreciation
- −$3,171
- Taxable loss
- −$40
- Est. tax savings @ 24.0%
- +$10
- After-tax cash flow
- $1,715/yr
For passive investors: Depreciation is non-cash, so a rental often shows a tax loss while cash-flowing — sheltering income. Rental losses are passive: they offset passive income freely, and up to $25,000/yr can offset ordinary (W-2) income if you actively participate and your MAGI is under $100k (phasing out to $0 by $150k); unused losses carry forward. On sale, claimed depreciation is recaptured at up to 25%, and gains may owe capital-gains tax (a 1031 exchange can defer both). Figures are a year-1 estimate at your 24.0% rate — not tax advice; consult a CPA.
Schools (NCES district)
- District
- Birmingham City
- NCES district ID
- 0100390
- Math proficiency
- 4% ▼ -17.00%
- Reading proficiency
- 20% ▼ -4.00%
- Median HH income
- $31,988
- Composite
- 9.49/100
- National rank
- #9850
- State rank
- #116 of 129 in AL
Livability — Birmingham
- Score
- 67/100
- State rank
- #78
- US rank
- #10412
Category grades
Schools grade is shown separately in the Schools card above.
Census & demographics
- Census place
- Birmingham, AL
- County
- Jefferson County · 527,445 people
- City population
- 210,422
- Metro
- Birmingham-Hoover, AL
- Population (ZIP)
- 10,160
- Household income
- $36,633
- Rent vs Own
- Severe rent burden
- 798.0
Population outlook (Jefferson County) Hauer SSP2
- Today (2025)
- 669,185 people
- By 2030
- 669,694 · +0.1%
- By 2040
- 661,388 · -1.2%
- By 2050
- 643,086 · -3.9%
- By 2075
- 577,267 · -13.7%
- By 2100
- 474,758 · -29.1%
Race, ethnicity, and origin ACS 2023
- Neighborhood character
- Predominantly Black (68%)
- Race & ethnicity
- Black 68% White 24% Hispanic / Latino 6% Two or more races 3% Asian 1%
- Hispanic origin (detail)
- Mexican 3%
- Common ancestry
- Italian 2% Slovak 2% Hispanic 1%
- Foreign-born
- 3% · Canada
- Languages at home
- 95% English-only · Spanish 3% French/Haitian/Cajun 1%
Political lean MEDSL · Jefferson
- 2024 margin
- D (+10.4) · D 54.6% · R 44.2% · Other 1.2%
- 2008→2024 swing
- +5.4pp toward D · 2008: 5.1pp · 2024: 10.4pp
- All cycles
- 2024: D+10.4 2020: D+13.2 2016: D+7.2 2012: D+6.0 2008: D+5.1
Not yet ingested
- Civics
- —
Market trends
- HPI YoY
- ▼ -190.24%
- Current HPI
- 120.1264
- Rent YoY
- —
- Metro
- Birmingham-Hoover, AL
- State GDP YoY
- ▲ 2.94%
- F500 in state
- 4
Industry mix (Fortune 500 HQ in AL)
| Industry | F500 HQs | Revenue |
|---|---|---|
| Financial Services | 1 | $8B |
|
||
| Healthcare | 1 | $5B |
|
||
Price history
+317.2% since first listed15 events — show timeline
- 2026-04-30 Price Changed $114,000 Greater Alabama MLS
- 2026-03-13 Listed $119,000 Greater Alabama MLS
- 2024-08-28 Rental Removed $1,075 APPFOLIO
- 2024-07-14 Listed for Rent $1,075 APPFOLIO
- 2021-01-12 Sold (Public Records) $74,900 Public Records
- 2021-01-08 Sold (MLS) $75,000 Greater Alabama MLS
- 2020-12-28 Contingent — Greater Alabama MLS
- 2020-12-13 Listed $74,900 Greater Alabama MLS
- 2016-02-12 Sold (MLS) $21,000 Greater Alabama MLS
- 2016-01-28 Pending — Greater Alabama MLS
- 2016-01-14 Price Changed $29,900 Greater Alabama MLS
- 2015-12-28 Price Changed $32,900 Greater Alabama MLS
- 2015-11-30 Listed $39,900 Greater Alabama MLS
- 2002-05-20 Sold (Public Records) $57,400 Public Records
- 1981-01-01 Sold (Public Records) $27,324 Public Records
Property tax history
+4.6%/yrLatest (2025): $1,498 · +0.0% YoY. Source: county tax records.
Cash-flow waterfall
monthlySold comps — $/sqft
last 12 mo · ≤1 miLoading sold comps…