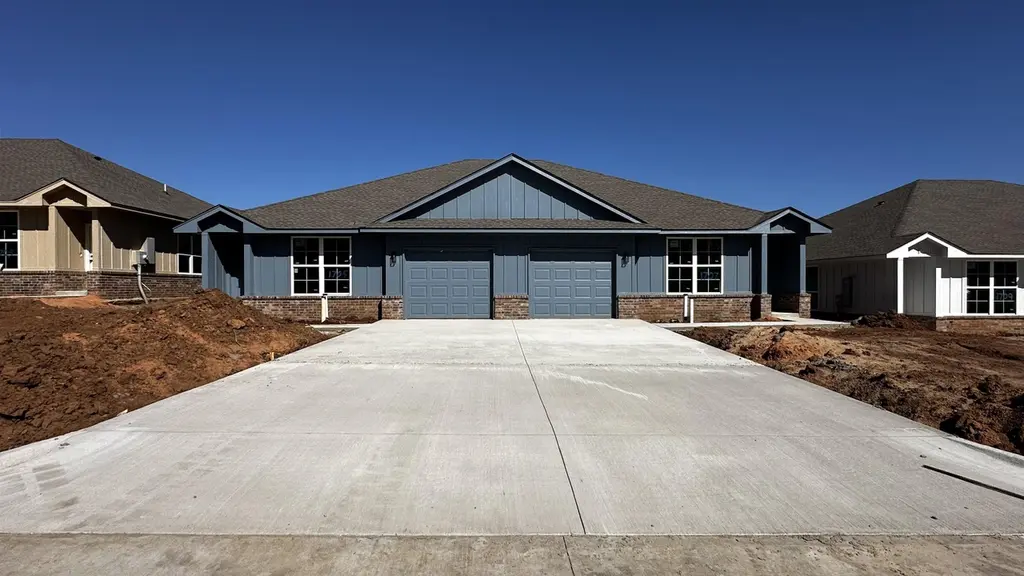
 🏗️ New Construction
1704 East Creek Dr · Enid, OK
Flood risk 1/10 · Minimal
- FEMA flood zone
- X (unshaded)
- Chance of flooding over 30 yrs
- 0.0%
- Est. flood insurance / yr
- $507 – $1,088
Fire risk 4/10 · Minor
- Est. fire insurance / yr
- $2,463 – $4,575
Heat risk 5/10 · Moderate
- Hot days now (above 108°F)
- 7 days/yr
- Hot days in 30 yrs
- 19 days/yr
Wind risk 2/10 · Minimal
- Chance of severe wind over 30 yrs
- 2.0%
Air-quality risk 2/10 · Minimal
- Unhealthy air days now
- 0 days/yr
- Unhealthy air days in 30 yrs
- 1 days/yr
Risk factors via First Street. Map © Google.
Why this score? — see what drove the D grade
The composite is a weighted blend of 9 inputs, each scored 0–100. Each bar is that input's sub-score; the figure is the points it added to the 100-point composite (weight × sub-score).
- Cash flow +15.0/30.0
- ARV discount +7.5/15.0
- 1% rule +5.0/10.0
- DSCR +5.0/10.0
- Rent growth +3.3/5.0
- Livability +3.2/5.0
- Condition / age +2.5/5.0
- Schools +1.8/10.0
- Appreciation +0.0/10.0
$1,550
🖨 Deal sheet (PDF) 📄 Offer letter ✓ Due diligence
Multi-family units
County records classify this as Multi-Family (2-4 Unit). Listing-text estimate: 1 unit. estimate disagrees with records
Listing remarks
New Construction Duplexes for rent. Rental price is $1650.00/month. Each side offers 1300 square feet units with 3 BR, 2BA, 1 GAR, with laundry hook up. Only minutes to VANCE AFB main gate.
Key facts
- 8,276 sq ft lot
- Built 2026
- Listed 47 days
Property features AI
Finance
- Other: Lot approximately 90' x 95' (0.19 acres); Zoned for multi-family; Located in South Creek Addition
Exterior
- Utilities: Public water; Public sewer
- Home design: Multi-family residential (duplex/triplex/fourplex); 1 story
- Construction: Frame construction; Slab foundation
- Exterior features: Composition roof
Interior
- Kitchen: Dishwasher; Range; Oven; Disposal
- Heating & cooling: Central heating (natural gas); Central air conditioning
- Interior features: Dishwasher; Range; Oven; Disposal
Neighborhood map
What this means for you Summary
Snapshot
- This is a 6-bed/?-bath multifamily listed at $2k.
Deal economics
- At list price, monthly cash flow is $2k ($20k/yr) — positive.
- The deal already cash-flows at list — no discount required.
- Meets the 1% rule at list price ($2k rent vs $2k).
- Recommended offer: $2k (3.0% below list) — sets the bar for market timing.
- Cap rate 1283.6% vs local median 5.0% in Enid — top-decile yield for the area; either an underpriced asset or a hidden risk that comps aren't pricing in. Stress-test before assuming the spread holds.
Location & tenants
- Location reads 63/100 on livability (#212 in OK) — a middle-class / working-renter tenant base. Strengths: cost of living A+, housing A+; Watch: employment C-, crime F, amenities F.
- Enid (town): math 19% / reading 22% proficiency, ranked #168 of 270 in OK (top 62%) — low school quality limits family demand, transient renter base, plan for 1-2y turnover; 64% free/reduced lunch — lower-income household profile, screen leases tightly.
- Zoned schools: Coolidge Es (math 22% / reading 17%, grade F, #479 of 845 statewide, top 63%, 381 students, 0% FRL); Longfellow Ms (math 8% / reading 12%, grade F, #277 of 345 statewide, top 83%, 503 students, 0% FRL); Enid Hs (math 14% / reading 26%, grade F, #236 of 447 statewide, top 61%, 2,252 students, 0% FRL) — zoned schools average 0% FRL vs 64% district-wide (64 pts lower); this property's tenant base skews higher-income than the district average.
- Market conditions: Rents rising (+3.2%/yr); 84 active listings in the ZIP; 19 units permitted in Garfield County in 2024 (0 in 5+ unit buildings).
- At $2,102/mo this rent would consume 50% of the median local household income ($51k/yr) (locally 576% of renters already pay >50% of income on rent) — very limited rent-growth headroom before tenants either downsize or default.
Forward outlook
- Local home prices are declining (-3.0%/yr); year-one equity from $10 of loan paydown is wiped out by about $46 of value loss. Plan a longer hold.
- Garfield County population projected at +27% by 2050 — long-run rental-demand tailwind backs the buy-and-hold thesis.
- At projected returns (-3.0% appreciation + 3.2% rent growth), your $434 cash investment doubles in ~1 year — after that, you're playing with house money.
Negotiation context
- It's been on market 48 days — a 3% lower offer ($2k) is reasonable based on typical stale-listing flexibility.
Risks & watch-outs
- Climate carrying-cost: extreme-heat days projected 7→19/yr by 2055 (HVAC capex compounding) — expect insurance premiums to compound above CPI over the hold.
Questions for the listing agent
- It's been on market 48 days. Have you received any prior offers? Is the seller open to a 3% concession, seller financing, or rate buy-down credit?
- Is there a deadline driving the sale (1031 exchange, divorce, estate, relocation)? That informs how much negotiation room exists.
- Schools are D-rated, which usually means shorter tenancies and higher turnover. Who's the typical renter profile here, and what's been the actual vacancy rate?
- Crime grade is F in this area — have there been break-ins, vandalism, or insurance claims at this property in the last 3 years? What carrier currently insures it and at what premium?
- The area grade is low — what's the realistic commute time and amenity access for the typical tenant pool here? Any planned neighborhood developments (good or bad) we should know about?
- What's the average days-on-market for RENTAL listings here right now (not sales)? A rising rental-DOM trend means longer vacancies and softer asking-rent achievability than the comps imply.
- What's the recent tenant-quality profile in this submarket — average credit score on applications, eviction rate, late-payment / NSF rate, and stable-employment percentage? A property-management company in the area should have these aggregated.
- How much new apartment / multifamily construction is in the pipeline within 1–3 miles? Heavy new supply (>2% of stock underway) typically softens rents 12–24 months out; light construction supports rent growth.
Investment metrics
- 1% rule
- 135.61% ✓
- Cap rate
- 1283.61%
- Cash-on-cash
- 4561.85%
- DSCR
- 203.98
- GRM
- 0.1
CMA / ARV
No comps found within radius.
Projected returns pro-forma
-3.0% appreciation · 3.16% rent growth · sell at horizon
- IRR
- —
- Equity multiple
- 243.40×
- Total profit
- $105,200
- Equity at exit
- $231
- IRR
- —
- Equity multiple
- 527.36×
- Total profit
- $228,439
- Equity at exit
- $134
Cash invested: $434 (down + closing). Projections, not guarantees.
Landlord ↔ Tenant lean methodology
- Overall (STATE)
- 83 Strongly Landlord-Friendly
- State Oklahoma
- 83 Strongly Landlord-Friendly · R+20
- County
- — inherits STATE
- City
- — inherits STATE
ZIP-level market 73701
- Home prices YoY
- -30.2%
- Rents YoY
- 3.2%
- Active inventory
- 84
- Price-to-rent
- 0.1×
Monthly cashflow live
- Estimated rent
- $2,102 medium interval (Pro) →
- Mortgage (P&I)
- −$8
- Tax est. 1.5%
- −$2 /mo · $23/yr
- Insurance
- −$1
- HOA
- −$0
- Vacancy / Maint / Mgmt
- −$441
- Net cashflow
- $1,650
Break-even live
Sensitivity live
| Price | -10% $1,651 | -5% $1,650 | +0% $1,650 | +5% $1,649 | +10% $1,649 |
|---|---|---|---|---|---|
| Rent | -10% $1,484 | -5% $1,567 | +0% $1,650 | +5% $1,733 | +10% $1,816 |
| Rate | -1.0pp $1,651 | -0.5pp $1,650 | base $1,650 | +0.5pp $1,649 | +1.0pp $1,649 |
2-unit breakdown (identical units grouped — click to expand)
| Units | Beds | Baths | Est. rent |
|---|---|---|---|
| 2× units | 3 | 2 | $2,102 |
| #1 | 3 | 2 | $1,051 |
| #2 | 3 | 2 | $1,051 |
| Total (2 units) | $2,102 | ||
UW: 25.0% down · 7.5% · 30yr · 1.5% tax · 5.0% vac · 8.0% maint · 8.0% mgmt
Financing live
Cash to close
- Down payment
- $388
- Closing costs
- $46
- Reserves months
- —
- Total cash needed
- —
Loan-product check · same deal, 3 products live
Conventional
25% down · 7.5% · 30yr
- Down + closing
- —
- Monthly P&I
- —
- Monthly cashflow
- —
- DSCR
- —
- Eligible?
- —
Personal DTI + credit; lowest rate.
DSCR
20% down · 8.5% · 30yr
- Down + closing
- —
- Monthly P&I
- —
- Monthly cashflow
- —
- DSCR
- —
- Eligible?
- —
No personal income docs; deal must DSCR.
Hard money
10% down · 12.0% · 12mo
- Down + closing
- —
- Monthly P&I
- —
- Monthly cashflow
- —
- DSCR
- —
- Eligible?
- —
Short-term bridge; refi at stabilization.
Listing history 16 events
-
2026-06-21days on market $1,550 Active 48 DOM
-
2026-06-19days on market $1,550 Active 46 DOM
-
2026-06-18days on market $1,550 Active 45 DOM
-
2026-06-17days on market $1,550 Active 44 DOM
-
2026-06-16days on market $1,550 Active 43 DOM
-
2026-06-15days on market $1,550 Active 42 DOM
-
2026-06-14days on market $1,550 Active 40 DOM
-
2026-06-12pricedays on market $1,550 Active 39 DOM
-
2026-06-09days on market $1,650 Active 36 DOM
-
2026-06-08days on market $1,650 Active 35 DOM
-
2026-06-07days on market $1,650 Active 34 DOM
-
2026-06-02days on market $1,650 Active 29 DOM
-
2026-06-01days on market $1,650 Active 28 DOM
-
2026-05-31days on market $1,650 Active 27 DOM
-
2026-05-30days on market $1,650 Active 26 DOM
-
2026-05-04$1,650 Active
ⓘ Source: listings_history table (triggers on properties + properties_extension) + one-shot
backfill from property_details.listing_events for pre-trigger history.
Climate risk First Street
- Flood 1/10 Low FEMA zone X (unshaded) · 0% chance over 30 yrs
- Wildfire 4/10 Moderate
- Heat 5/10 Major 7 d/yr ≥108°F today · 19 d/yr by 30 yrs out
- Wind 2/10 Low 2% chance of damaging wind over 30 yrs
- Air quality 2/10 Low 0 unhealthy d/yr today · 1 by 30 yrs out
Nearby sold comps map
Loading sold comps map…
Walkable amenities ~0.75 mi
Loading nearby amenities…
Taxation est. · year 1
- Rental income
- $25,224
- − Mortgage interest
- −$87
- − Property taxes
- −$23
- − Insurance
- −$8
- − Repairs & maintenance
- −$2,018
- − Management
- −$2,018
- − Depreciation
- −$45
- Taxable income
- $21,025
- Est. tax owed @ 24.0%
- −$5,046
- After-tax cash flow
- $14,752/yr
For passive investors: Depreciation is non-cash, so a rental often shows a tax loss while cash-flowing — sheltering income. Rental losses are passive: they offset passive income freely, and up to $25,000/yr can offset ordinary (W-2) income if you actively participate and your MAGI is under $100k (phasing out to $0 by $150k); unused losses carry forward. On sale, claimed depreciation is recaptured at up to 25%, and gains may owe capital-gains tax (a 1031 exchange can defer both). Figures are a year-1 estimate at your 24.0% rate — not tax advice; consult a CPA.
Schools (NCES district)
- District
- Enid
- NCES district ID
- 4010920
- Math proficiency
- 19% ▼ -11.00%
- Reading proficiency
- 22% ▼ -9.00%
- Median HH income
- $42,389
- Composite
- 17.59/100
- National rank
- #9040
- State rank
- #168 of 270 in OK
Livability — Enid
- Score
- 63/100
- State rank
- #212
- US rank
- #15472
Category grades
Schools grade is shown separately in the Schools card above.
Census & demographics
- Census place
- Enid, OK
- County
- Garfield County · 55,032 people
- City population
- 55,032
- Metro
- Enid, OK
- Population (ZIP)
- 24,476
- Household income
- $50,843
- Rent vs Own
- Severe rent burden
- 576.0
Population outlook (Garfield County) Hauer SSP2
- Today (2025)
- 69,026 people
- By 2030
- 72,171 · +4.6%
- By 2040
- 79,366 · +15.0%
- By 2050
- 87,847 · +27.3%
- By 2075
- 112,714 · +63.3%
- By 2100
- 135,682 · +96.6%
Race, ethnicity, and origin ACS 2023
- Neighborhood character
- Diverse neighborhood (Simpson 0.61)
- Race & ethnicity
- White 58% Hispanic / Latino 22% Two or more races 11% Pacific Islander 10% Native American 4% Black 2%
- Hispanic origin (detail)
- Mexican 21%
- Common ancestry
- Iranian 4% Lithuanian 2% Slovak 1%
- Foreign-born
- 10% · Canada
- Languages at home
- 79% English-only · Spanish 14% Other Asian/Pacific 6%
Political lean MEDSL · Garfield
- 2024 margin
- Solid R (+53.8) · D 22.2% · R 76.0% · Other 1.8%
- 2008→2024 swing
- -2.8pp toward R · 2008: -51.0pp · 2024: -53.8pp
- All cycles
- 2024: R+53.8 2020: R+53.7 2016: R+53.5 2012: R+52.5 2008: R+51.0
Not yet ingested
- Civics
- —
Market trends
- HPI YoY
- ▼ -73.42%
- Current HPI
- 169.408
- Rent YoY
- ▲ 3.16%
- Metro
- Enid, OK
- State GDP YoY
- ▲ 1.55%
- F500 in state
- 6
Industry mix (Fortune 500 HQ in OK)
| Industry | F500 HQs | Revenue |
|---|---|---|
| Energy | 3 | $48B |
|
||
Price history
1 event — show timeline
- 2026-05-04 Listed $1,650 NWOAR
Cash-flow waterfall
monthlySold comps — $/sqft
last 12 mo · ≤1 miLoading sold comps…