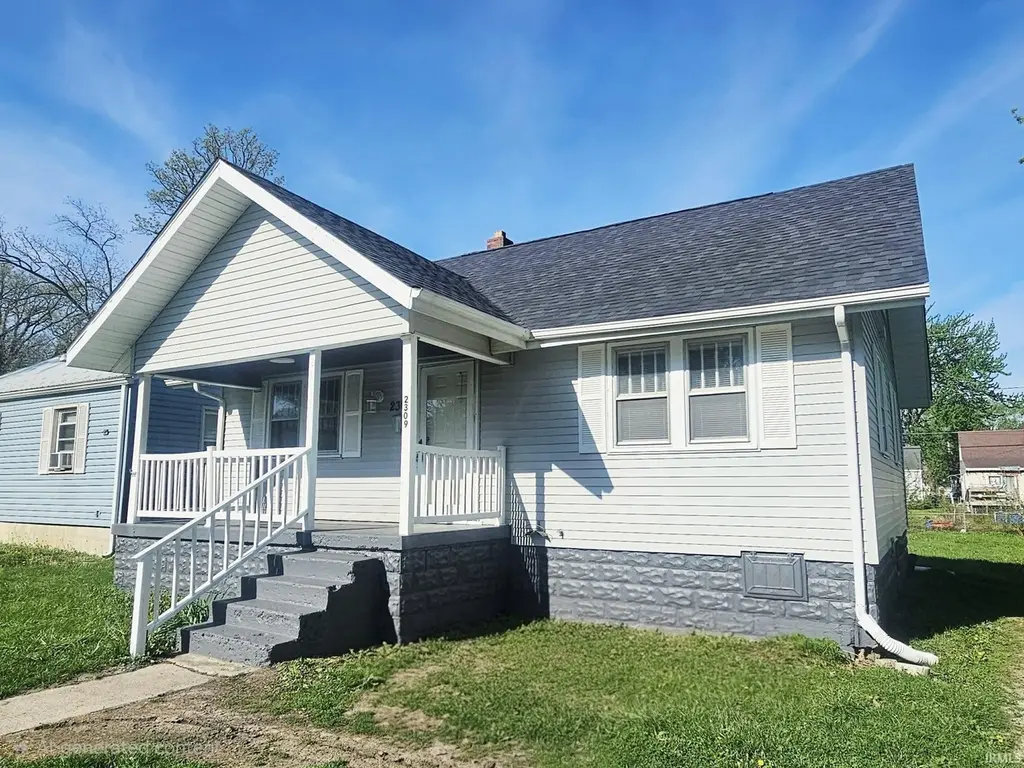
2309 S Grant St · Muncie, IN
Flood risk 1/10 · Minimal
- FEMA flood zone
- X (unshaded)
- Chance of flooding over 30 yrs
- 0.0%
- Est. flood insurance / yr
- $473 – $860
Fire risk 1/10 · Minimal
- Est. fire insurance / yr
- $717 – $1,331
Heat risk 3/10 · Minor
- Hot days now (above 101°F)
- 7 days/yr
- Hot days in 30 yrs
- 18 days/yr
Wind risk 2/10 · Minimal
- Chance of severe wind over 30 yrs
- 1.0%
Air-quality risk 3/10 · Minor
- Unhealthy air days now
- 2 days/yr
- Unhealthy air days in 30 yrs
- 3 days/yr
Risk factors via First Street. Map © Google.
Why this score? — see what drove the D+ grade
The composite is a weighted blend of 9 inputs, each scored 0–100. Each bar is that input's sub-score; the figure is the points it added to the 100-point composite (weight × sub-score).
- Cash flow +21.2/30.0
- DSCR +6.7/10.0
- 1% rule +4.9/10.0
- Rent growth +4.5/5.0
- Livability +4.0/5.0
- Condition / age +2.5/5.0
- Schools +1.7/10.0
- ARV discount +0.0/15.0
- Appreciation +0.0/10.0
$119,900
🖨 Deal sheet 📄 Offer letter ✓ Due diligence
Listing remarks
Move-in ready 3-bedroom home on a double lot featuring a 15x6 covered front porch and numerous updates. Kitchen features stainless steel appliances. New roof and water heater, with forced air furnace and central a/c. Spacious main-level utility/laundry room. Partially fenced in back yard. Owner is a licensed real estate broker and the listing agent. Taxes will be less with a homestead exemption.
Key facts
- Covered front porch
- Water heater
- Central a/c
Tags
Property features AI
Finance
- Other: Lot dimensions approximately 80 x 136 (about 0.25 acre)
Exterior
- Parking: Gravel parking
- Utilities: Public water; Public sewer
- Home design: Single-family, site-built home; Single-story
- Construction: Vinyl siding; Asphalt shingle roof
- Exterior features: Partial fencing including chain link and barbed wire; Shed(s) on the property; Level lot
Interior
- Kitchen: Dishwasher; Microwave; Refrigerator; Electric range
- Bedrooms: 6 total rooms (includes bedrooms and living spaces); Laundry located on the main level
- Flooring: Vinyl
- Bathrooms: 1 full bathroom (main level)
- Heating & cooling: Natural gas heating with forced air; Central air conditioning
- Interior features: Dishwasher; Microwave; Refrigerator; Electric Range; Vinyl flooring; Full basement
- Laundry & utility: Main-level laundry
Neighborhood map
What this means for you Summary
Snapshot
- This is a 2-bed/1.0-bath single-family listed at $120k.
Deal economics
- At list price, monthly cash flow is $173 ($2k/yr) — positive.
- The deal already cash-flows at list — no discount required.
- To meet the 1% rule (rent ≥ 1% of price), the offer needs to be $118k (1.4% below list).
- Recommended offer: $118k (1.4% below list) — sets the bar for 1% rule.
- Cap rate 8.0% vs local median 6.0% in Muncie — top-decile yield for the area; either an underpriced asset or a hidden risk that comps aren't pricing in. Stress-test before assuming the spread holds.
Location & tenants
- Location reads 80/100 on livability (#18 in IN, #1,654 nationally) — a professional / high-income tenant draw. Strengths: amenities A+, commute A+, cost of living A+; Watch: crime F, employment F.
- Muncie Community Schools (urban): math 18% / reading 25% proficiency, ranked #275 of 301 in IN (top 91%) — low school quality limits family demand, transient renter base, plan for 1-2y turnover; 68% free/reduced lunch — lower-income household profile, screen leases tightly.
- Zoned schools: Grissom Elementary School (math 8% / reading 8%, grade F, #949 of 994 statewide, top 97%, 450 students, 85% FRL); Southside Middle School (math 7% / reading 15%, grade F, #312 of 330 statewide, top 95%, 443 students, 85% FRL) — zoned schools average 85% FRL vs 68% district-wide (17 pts higher); higher-poverty schools than district average — tighter screening recommended.
- Zoned-school proficiency averages 9% at this address vs 22% district-wide (-12 pts) — the specific schools serving this property underperform the Muncie Community Schools average; the district grade overstates school quality for this exact location.
- Market conditions: Rents rising fast (+8.1%/yr); 202 active listings in the ZIP; 5 comparable units currently listed for rent nearby; rentals lingering (median 44d on market — plan ~5-8 weeks vacancy on turnover, expect pricing pressure); 100% of comp listings sitting > 30 days — soft ceiling on asking rent; 171 units permitted in Delaware County in 2024 (57 in 5+ unit buildings).
Forward outlook
- Local home prices are declining (-3.0%/yr); year-one equity from $829 of loan paydown is wiped out by about $4k of value loss. Plan a longer hold.
- Delaware County population projected at -11% by 2050 — secular population decline; favor cash flow + early exit over multi-decade hold.
- At projected returns (-3.0% appreciation + 8.0% rent growth), your $34k cash investment doubles in ~9 years — after that, you're playing with house money.
Negotiation context
- Only 6 days on market — expect competitive offers; lowballing is unlikely to land.
- 2 sale attempts since 11y ago with the ask held roughly flat each time — persistent listings suggest the price (not the market) is what's stuck; bring a comps-based counter.
Risks & watch-outs
- Watch-outs: built in 1927 — expect roof / HVAC / electrical / plumbing capex.
Questions for the listing agent
- Built in 1927 — when were the roof, HVAC, electrical panel, plumbing, and water heater last replaced?
- Is there a deadline driving the sale (1031 exchange, divorce, estate, relocation)? That informs how much negotiation room exists.
- Schools are D-rated, which usually means shorter tenancies and higher turnover. Who's the typical renter profile here, and what's been the actual vacancy rate?
- Crime grade is F in this area — have there been break-ins, vandalism, or insurance claims at this property in the last 3 years? What carrier currently insures it and at what premium?
- The area grade is low — what's the realistic commute time and amenity access for the typical tenant pool here? Any planned neighborhood developments (good or bad) we should know about?
- What's the average days-on-market for RENTAL listings here right now (not sales)? A rising rental-DOM trend means longer vacancies and softer asking-rent achievability than the comps imply.
- What's the recent tenant-quality profile in this submarket — average credit score on applications, eviction rate, late-payment / NSF rate, and stable-employment percentage? A property-management company in the area should have these aggregated.
- How much new for-sale + rental construction is in the pipeline within 1–3 miles? Heavy new supply typically softens prices + rents 12–24 months out; constrained supply supports both.
Investment metrics
- 1% rule
- 0.99% ✗
- Cap rate
- 8.02%
- Cash-on-cash
- 6.17%
- DSCR
- 1.27
- GRM
- 8.4
CMA / ARV
- ARV (on-the-fly)
- $101,616
- Comps found
- 12
Show comp detail 12 sales within ~0.75 mi
| Address | Dist | Beds/Ba | Sqft | Sold | Price | $/sf | Match |
|---|---|---|---|---|---|---|---|
| 2112 S Beacon St | 0.14mi | 2/1.0 | 1,632 (-7%) | 4mo | $95,000 | $58 | 79 |
| 1724 S Elm St | 0.60mi | 2/1.0 | 1,746 (-0%) | 9mo | $67,000 | $38 | 64 |
| 2815 S Hackley St | 0.39mi | 3/1.0 (+1) | 1,648 (-6%) | 13mo | $85,000 | $52 | 56 |
| 1901 E 14th St | 0.49mi | 3/2.0 (+1) | 1,621 (-8%) | 1mo | $167,000 | $103 | 55 |
| 2111 S Mulberry St | 0.63mi | 3/1.0 (+1) | 1,680 (-4%) | 8mo | $29,900 | $18 | 53 |
| 2001 S Jefferson St | 0.60mi | 3/2.0 (+1) | 1,804 (+3%) | 8mo | $165,000 | $91 | 52 |
| 202 E 13th St | 0.64mi | 3/1.5 (+1) | 1,890 (+8%) | 7mo | $124,900 | $66 | 44 |
| 1805 E 18th St | 0.47mi | 2/2.0 | 1,506 (-14%) | 9mo | $114,900 | $76 | 43 |
| 1614 E 24th St | 0.57mi | 2/1.0 | 1,985 (+13%) | 10mo | $51,000 | $26 | 43 |
| 1911 S Walnut St | 0.72mi | 2/1.0 | 2,004 (+14%) | 5mo | $84,900 | $42 | 38 |
| 1801 E 23rd St | 0.62mi | 2/1.0 | 1,496 (-15%) | 14mo | $68,000 | $45 | 35 |
| 3202 S Pershing St | 0.64mi | 3/2.0 (+1) | 1,575 (-10%) | 13mo | $150,000 | $95 | 34 |
Match score weights: distance 35% · size 25% · config 20% · recency 20%. Top-matched comps best support the ARV.
Projected returns pro-forma
-3.0% appreciation · 8.0% rent growth · sell at horizon
- IRR
- -1.7%
- Equity multiple
- 0.93×
- Total profit
- $-2,206
- Equity at exit
- $17,877
- IRR
- 12.5%
- Equity multiple
- 2.21×
- Total profit
- $40,591
- Equity at exit
- $10,367
Cash invested: $33,572 (down + closing). Projections, not guarantees.
Landlord ↔ Tenant lean methodology
- Overall (STATE)
- 90 Strongly Landlord-Friendly
- State Indiana
- 90 Strongly Landlord-Friendly · R+11
- County
- — inherits STATE
- City
- — inherits STATE
ZIP-level market 47304
- Home prices YoY
- -28.4%
- Rents YoY
- 8.1%
- Active inventory
- 202
- Price-to-rent
- 8.4×
Monthly cashflow live
- Estimated rent
- $1,183 high interval (Pro) →
- Mortgage (P&I)
- −$629
- Tax from tax record
- −$83 /mo · $996/yr
- Insurance
- −$50
- HOA
- −$0
- Vacancy / Maint / Mgmt
- −$248
- Net cashflow
- $173
Break-even live
UW: 25.0% down · 7.5% · 30yr · 1.5% tax · 5.0% vac · 8.0% maint · 8.0% mgmt
Financing live
Cash to close
- Down payment
- $29,975
- Closing costs
- $3,597
- Reserves months
- —
- Total cash needed
- —
Loan-product check · same deal, 3 products live
Conventional
25% down · 7.5% · 30yr
- Down + closing
- —
- Monthly P&I
- —
- Monthly cashflow
- —
- DSCR
- —
- Eligible?
- —
Personal DTI + credit; lowest rate.
DSCR
20% down · 8.5% · 30yr
- Down + closing
- —
- Monthly P&I
- —
- Monthly cashflow
- —
- DSCR
- —
- Eligible?
- —
No personal income docs; deal must DSCR.
Hard money
10% down · 12.0% · 12mo
- Down + closing
- —
- Monthly P&I
- —
- Monthly cashflow
- —
- DSCR
- —
- Eligible?
- —
Short-term bridge; refi at stabilization.
Rent comps 5 comps
| Address | Beds | Baths | Sqft | Rent | $/sqft | DOM | Units | Dist |
|---|---|---|---|---|---|---|---|---|
| 1521 E Kirby Ave Muncie, IN | 2.0–4.0 | 1.0–2.0 | 972 | $800 | $0.82 | 44d | 2 | 1.01mi |
| 605 W 10th St Muncie, IN | 3.0 | 1.0 | 1688 | $1,150 | $0.68 | 44d | 1 | 1.07mi |
| 623 W 9th St Muncie, IN | 3.0 | 1.0 | 1574 | $1,499 | $0.95 | 44d | 1 | 1.11mi |
| 412 W Howard St Muncie, IN | 3.0 | 1.0 | 1300 | $1,000 | $0.77 | 44d | 1 | 1.43mi |
| 4412 S Clubhouse Rd Muncie, IN | 3.0 | 2.0 | 1248 | $1,210 | $0.97 | 44d | 2 | 1.44mi |
Listing history 7 events
-
2026-06-03statusdays on market $119,900 Pending 6 DOM
-
2026-06-02days on market $119,900 Active 5 DOM
-
2026-06-01status $119,900 Active 4 DOM
-
2026-05-01status Pending
-
2026-04-26$119,900 Active
-
2015-09-03historical
-
2015-04-03$22,000
ⓘ Source: listings_history table (triggers on properties + properties_extension) + one-shot
backfill from property_details.listing_events for pre-trigger history.
Tax reassessment forecast IN · Partial reset (capped growth)
- Current annual tax
- $996 · $83/mo
- Projected year-2 tax
- $1,008 · $84/mo
- Expected delta
- +$12/yr (+$1/mo · 1.2%)
ⓘ Screening estimate from a state-policy table — verify with the county assessor before closing.
Climate risk First Street
- Flood 1/10 Low FEMA zone X (unshaded) · 0% chance over 30 yrs
- Wildfire 1/10 Low
- Heat 3/10 Moderate 7 d/yr ≥101°F today · 18 d/yr by 30 yrs out
- Wind 2/10 Low 100% chance of damaging wind over 30 yrs
- Air quality 3/10 Moderate 2 unhealthy d/yr today · 3 by 30 yrs out
Nearby sold comps map
Loading sold comps map…
Walkable amenities ~0.75 mi
Loading nearby amenities…
Taxation est. · year 1
- Rental income
- $14,193
- − Mortgage interest
- −$6,716
- − Property taxes
- −$996
- − Insurance
- −$600
- − Repairs & maintenance
- −$1,135
- − Management
- −$1,135
- − Depreciation
- −$3,488
- Taxable income
- $122
- Est. tax owed @ 24.0%
- −$29
- After-tax cash flow
- $2,042/yr
For passive investors: Depreciation is non-cash, so a rental often shows a tax loss while cash-flowing — sheltering income. Rental losses are passive: they offset passive income freely, and up to $25,000/yr can offset ordinary (W-2) income if you actively participate and your MAGI is under $100k (phasing out to $0 by $150k); unused losses carry forward. On sale, claimed depreciation is recaptured at up to 25%, and gains may owe capital-gains tax (a 1031 exchange can defer both). Figures are a year-1 estimate at your 24.0% rate — not tax advice; consult a CPA.
Schools (NCES district)
- District
- Muncie Community Schools
- NCES district ID
- 1807320
- Math proficiency
- 18% ▼ -9.00%
- Reading proficiency
- 25% ▼ -4.00%
- Median HH income
- $30,052
- Composite
- 17.22/100
- National rank
- #9099
- State rank
- #275 of 301 in IN
Livability — Muncie
- Score
- 80/100
- State rank
- #18
- US rank
- #1654
Category grades
Schools grade is shown separately in the Schools card above.
Census & demographics
- Census place
- Muncie, IN
- County
- Delaware County · 84,658 people
- City population
- 84,658
- Metro
- Muncie, IN
- Population (ZIP)
- 31,237
- Household income
- $63,215
- Rent vs Own
- Severe rent burden
- 1141.0
Population outlook (Delaware County) Hauer SSP2
- Today (2025)
- 113,036 people
- By 2030
- 111,313 · -1.5%
- By 2040
- 106,432 · -5.8%
- By 2050
- 100,747 · -10.9%
- By 2075
- 91,000 · -19.5%
- By 2100
- 80,687 · -28.6%
Race, ethnicity, and origin ACS 2023
- Neighborhood character
- Predominantly White (85%)
- Race & ethnicity
- White 85% Two or more races 5% Black 4% Asian 4% Hispanic / Latino 3%
- Common ancestry
- Lithuanian 2% Romanian 2% Slovak 1%
- Foreign-born
- 5% · Canada, Vietnam, China
- Languages at home
- 94% English-only · Spanish 2% Other Indo-European 1% Vietnamese 1%
Political lean MEDSL · Delaware
- 2024 margin
- R (+15.8) · D 41.2% · R 57.0% · Other 1.8%
- 2008→2024 swing
- -30.8pp toward R · 2008: 15.0pp · 2024: -15.8pp
- All cycles
- 2024: R+15.8 2020: R+13.2 2016: R+13.7 2012: D+3.1 2008: D+15.0
Not yet ingested
- Civics
- —
Market trends
- HPI YoY
- ▼ -78.53%
- Current HPI
- 197.5213
- Rent YoY
- ▲ 8.08%
- Metro
- Muncie, IN
- State GDP YoY
- ▲ 2.90%
- F500 in state
- 18
Industry mix (Fortune 500 HQ in IN)
| Industry | F500 HQs | Revenue |
|---|---|---|
| Industrial Machinery | 2 | $37B |
|
||
| Healthcare | 1 | $177B |
|
||
| Pharmaceuticals | 1 | $45B |
|
||
| Metals / Steel | 1 | $18B |
|
||
| Agriculture | 1 | $17B |
|
||
| Packaging | 1 | $12B |
|
||
Price history
+445.0% since first listed4 events — show timeline
- 2026-05-01 Pending — IRMLS
- 2026-04-26 Listed $119,900 IRMLS
- 2015-09-03 Listing Removed — MIBOR as Distributed by MLS Grid
- 2015-04-03 Listed $22,000 MIBOR as Distributed by MLS Grid
Property tax history
+4.4%/yrLatest (2024): $996 · +2.5% YoY. Source: county tax records.
Cash-flow waterfall
monthlySold comps — $/sqft
last 12 mo · ≤1 miLoading sold comps…