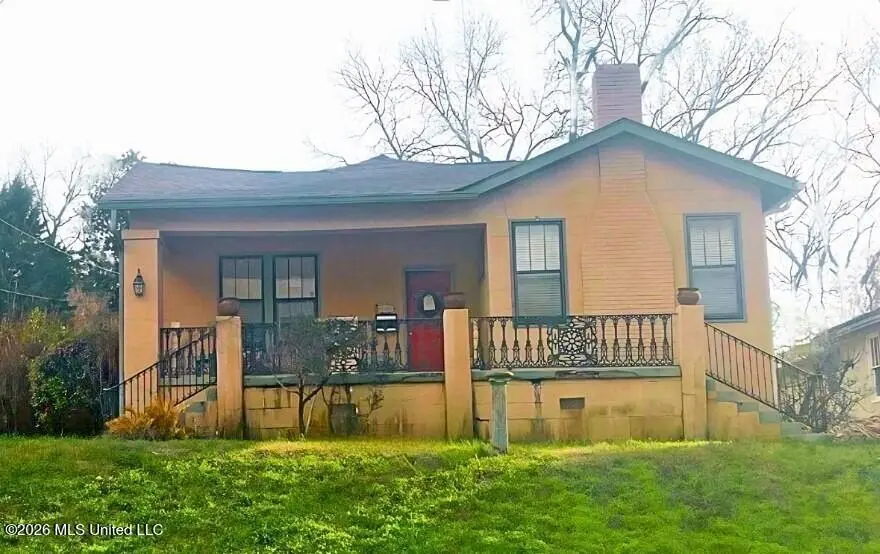
1022 Markham St · Vicksburg, MS
Flood risk 1/10 · Minimal
- FEMA flood zone
- X (unshaded)
- Chance of flooding over 30 yrs
- 0.0%
- Est. flood insurance / yr
- $507 – $1,088
Fire risk 1/10 · Minimal
- Est. fire insurance / yr
- $1,241 – $2,305
Heat risk 7/10 · Major
- Hot days now (above 110°F)
- 7 days/yr
- Hot days in 30 yrs
- 20 days/yr
Wind risk 8/10 · Major
- Chance of severe wind over 30 yrs
- 80.0%
Air-quality risk 1/10 · Minimal
- Unhealthy air days now
- 0 days/yr
- Unhealthy air days in 30 yrs
- 0 days/yr
Risk factors via First Street. Map © Google.
Why this score? — see what drove the B grade
The composite is a weighted blend of 9 inputs, each scored 0–100. Each bar is that input's sub-score; the figure is the points it added to the 100-point composite (weight × sub-score).
- Cash flow +30.0/30.0
- ARV discount +15.0/15.0
- DSCR +10.0/10.0
- 1% rule +9.3/10.0
- Livability +3.2/5.0
- Rent growth +2.5/5.0
- Condition / age +2.5/5.0
- Schools +2.0/10.0
- Appreciation +0.0/10.0
$92,500
🖨 Deal sheet 📄 Offer letter ✓ Due diligence
Listing remarks MLS
TURN OFF DRUMMOND ST. ONTO MARKHAM. HOUSE SITS ON LEFT. HOUSE IS VACANT; SHOW ANYTIME AND BRING ALL OFFERS. SOLD BY JUDY HARRELL BREITHAUPT REAL ESTAT E HOUSE HAS LARGE PORCH WITH SWING IN FRONT. HAS L ARGE COVERED PATIO IN BACK. ALSO HAS WIRED WORKSHO
Key facts
- 0.42 acre lot
- Built 1933
- Listed 11 days
Property features AI
Exterior
- Parking: Driveway
- Utilities: Public water; Public sewer; Electricity available; Water service available
- Home design: Single family residence (house); One level
- Construction: Brick and concrete construction; Conventional foundation; Shingle roof; Built (year source: public records)
- Exterior features: Front porch; Rear porch; Private yard; Back yard fencing
Interior
- Bathrooms: 2 full bathrooms
- Heating & cooling: Heating provided (fireplace(s)); Central air conditioning; Ceiling fans
- Interior features: Fireplace in the living room
Neighborhood map
What this means for you Summary
Snapshot
- This is a 3-bed/1.0-bath single-family listed at $92k.
Deal economics
- At list price, monthly cash flow is $469 ($6k/yr) — positive.
- The deal already cash-flows at list — no discount required.
- Meets the 1% rule at list price ($1k rent vs $92k).
- Cap rate 12.4% vs local median 4.5% in Vicksburg — top-decile yield for the area; either an underpriced asset or a hidden risk that comps aren't pricing in. Stress-test before assuming the spread holds.
Location & tenants
- Location reads 63/100 on livability (#166 in MS) — a middle-class / working-renter tenant base. Strengths: cost of living A+, housing A+; Watch: crime F, amenities F, commute F.
- Vicksburg Warren School District (rural): math 22% / reading 26% proficiency, ranked #82 of 130 in MS (top 63%) — low school quality limits family demand, transient renter base, plan for 1-2y turnover; 73% free/reduced lunch — lower-income household profile, screen leases tightly.
- Zoned schools: Dana Road Elementary (463 students, 100% FRL); Vicksburg Junior High School (math 14% / reading 19%, grade F, #126 of 179 statewide, top 71%, 405 students, 100% FRL); Vicksburg High School (math 8% / reading 17%, grade F, #160 of 197 statewide, top 83%, 871 students, 100% FRL) — zoned schools average 100% FRL vs 73% district-wide (27 pts higher); higher-poverty schools than district average — tighter screening recommended.
- Market conditions: 135 active listings in the ZIP; 1 comparable units currently listed for rent nearby; 12 units permitted in Warren County in 2024 (0 in 5+ unit buildings).
Forward outlook
- Local home prices are declining (-3.0%/yr); year-one equity from $640 of loan paydown is wiped out by about $3k of value loss. Plan a longer hold.
- Warren County population projected at -17% by 2050 — secular population decline; favor cash flow + early exit over multi-decade hold.
- At projected returns (-3.0% appreciation + 3.0% rent growth), your $26k cash investment doubles in ~6 years — after that, you're playing with house money.
Negotiation context
- Only 11 days on market — expect competitive offers; lowballing is unlikely to land.
- 2 sale attempts since 26y ago with the ask held roughly flat each time — persistent listings suggest the price (not the market) is what's stuck; bring a comps-based counter.
Risks & watch-outs
- Watch-outs: built in 1933 — expect roof / HVAC / electrical / plumbing capex.
- Climate carrying-cost: severe wind risk, 80% chance of damaging wind over 30y; extreme-heat days projected 7→20/yr by 2055 (HVAC capex compounding) — expect insurance premiums to compound above CPI over the hold.
Questions for the listing agent
- Built in 1933 — when were the roof, HVAC, electrical panel, plumbing, and water heater last replaced?
- Is there a deadline driving the sale (1031 exchange, divorce, estate, relocation)? That informs how much negotiation room exists.
- Schools are D-rated, which usually means shorter tenancies and higher turnover. Who's the typical renter profile here, and what's been the actual vacancy rate?
- Crime grade is F in this area — have there been break-ins, vandalism, or insurance claims at this property in the last 3 years? What carrier currently insures it and at what premium?
- What's the average days-on-market for RENTAL listings here right now (not sales)? A rising rental-DOM trend means longer vacancies and softer asking-rent achievability than the comps imply.
- What's the recent tenant-quality profile in this submarket — average credit score on applications, eviction rate, late-payment / NSF rate, and stable-employment percentage? A property-management company in the area should have these aggregated.
- How much new for-sale + rental construction is in the pipeline within 1–3 miles? Heavy new supply typically softens prices + rents 12–24 months out; constrained supply supports both.
Investment metrics
- 1% rule
- 1.43% ✓
- Cap rate
- 12.37%
- Cash-on-cash
- 21.72%
- DSCR
- 1.97
- GRM
- 5.8
CMA / ARV
- ARV (median comp)
- $150,423
- List price
- $92,500
- Delta
- -38.51%
- Verdict
- UNDERPRICED
- Comps
- 20 within 1.0 mi
Show comp detail 4 sales within ~0.75 mi
| Address | Dist | Beds/Ba | Sqft | Sold | Price | $/sf | Match |
|---|---|---|---|---|---|---|---|
| 721 National St | 0.26mi | 4/2.0 (+1) | 2,160 (+1%) | 16mo | $141,000 | $65 | 63 |
| 1455 Parkside Dr | 0.30mi | 3/2.0 | 2,000 (-6%) | 14mo | $99,500 | $50 | 60 |
| 1448 Parkside Drive Dr | 0.24mi | 4/3.0 (+1) | 2,246 (+5%) | 18mo | $275,000 | $122 | 52 |
| 119 John Allen St | 0.62mi | 3/2.0 | 2,060 (-4%) | 20mo | $135,000 | $66 | 45 |
Match score weights: distance 35% · size 25% · config 20% · recency 20%. Top-matched comps best support the ARV.
Projected returns pro-forma
-3.0% appreciation · 3.0% rent growth · sell at horizon
- IRR
- 14.3%
- Equity multiple
- 1.57×
- Total profit
- $14,847
- Equity at exit
- $13,792
- IRR
- 23.1%
- Equity multiple
- 2.98×
- Total profit
- $51,300
- Equity at exit
- $7,998
Cash invested: $25,900 (down + closing). Projections, not guarantees.
Landlord ↔ Tenant lean methodology
- Overall (STATE)
- 90 Strongly Landlord-Friendly
- State Mississippi
- 90 Strongly Landlord-Friendly · R+11
- County
- — inherits STATE
- City
- — inherits STATE
ZIP-level market 39180
- Home prices YoY
- -28.2%
- Active inventory
- 135
- Price-to-rent
- 5.8×
Monthly cashflow live
- Estimated rent
- $1,327 medium interval (Pro) →
- Mortgage (P&I)
- −$485
- Tax from tax record
- −$56 /mo · $669/yr
- Insurance
- −$39
- HOA
- −$0
- Vacancy / Maint / Mgmt
- −$279
- Net cashflow
- $469
Break-even live
UW: 25.0% down · 7.5% · 30yr · 1.5% tax · 5.0% vac · 8.0% maint · 8.0% mgmt
Financing live
Cash to close
- Down payment
- $23,125
- Closing costs
- $2,775
- Reserves months
- —
- Total cash needed
- —
Loan-product check · same deal, 3 products live
Conventional
25% down · 7.5% · 30yr
- Down + closing
- —
- Monthly P&I
- —
- Monthly cashflow
- —
- DSCR
- —
- Eligible?
- —
Personal DTI + credit; lowest rate.
DSCR
20% down · 8.5% · 30yr
- Down + closing
- —
- Monthly P&I
- —
- Monthly cashflow
- —
- DSCR
- —
- Eligible?
- —
No personal income docs; deal must DSCR.
Hard money
10% down · 12.0% · 12mo
- Down + closing
- —
- Monthly P&I
- —
- Monthly cashflow
- —
- DSCR
- —
- Eligible?
- —
Short-term bridge; refi at stabilization.
Rent comps 1 comps
| Address | Beds | Baths | Sqft | Rent | $/sqft | DOM | Units | Dist |
|---|---|---|---|---|---|---|---|---|
| 1711 Cherry St Vicksburg, MS | 2.0 | 1.0 | 1481 | $1,800 | $1.22 | 23d | 1 | 1.30mi |
Listing history 4 events
-
2026-05-15status Pending 580-char remark
-
2026-05-04$92,500 Active 580-char remark
-
2001-02-28soldstatus 252-char remark
Show marketing remark (252 chars)
TURN OFF DRUMMOND ST. ONTO MARKHAM. HOUSE SITS ON LEFT. HOUSE IS VACANT; SHOW ANYTIME AND BRING ALL OFFERS. SOLD BY JUDY HARRELL BREITHAUPT REAL ESTAT E HOUSE HAS LARGE PORCH WITH SWING IN FRONT. HAS L ARGE COVERED PATIO IN BACK. ALSO HAS WIRED WORKSHO
-
2000-09-27$99,000 252-char remark
Show marketing remark (252 chars)
TURN OFF DRUMMOND ST. ONTO MARKHAM. HOUSE SITS ON LEFT. HOUSE IS VACANT; SHOW ANYTIME AND BRING ALL OFFERS. SOLD BY JUDY HARRELL BREITHAUPT REAL ESTAT E HOUSE HAS LARGE PORCH WITH SWING IN FRONT. HAS L ARGE COVERED PATIO IN BACK. ALSO HAS WIRED WORKSHO
ⓘ Source: listings_history table (triggers on properties + properties_extension) + one-shot
backfill from property_details.listing_events for pre-trigger history.
Tax reassessment forecast MS · Resets to sale price
- Current annual tax
- $669 · $56/mo
- Projected year-2 tax
- $731 · $61/mo
- Expected delta
- +$62/yr (+$5/mo · 9.3%)
ⓘ Screening estimate from a state-policy table — verify with the county assessor before closing.
Climate risk First Street
- Flood 1/10 Low FEMA zone X (unshaded) · 0% chance over 30 yrs
- Wildfire 1/10 Low
- Heat 7/10 Severe 7 d/yr ≥110°F today · 20 d/yr by 30 yrs out
- Wind 8/10 Severe 80% chance of damaging wind over 30 yrs
- Air quality 1/10 Low 0 unhealthy d/yr today · 0 by 30 yrs out
Nearby sold comps map
Loading sold comps map…
Walkable amenities ~0.75 mi
Loading nearby amenities…
Taxation est. · year 1
- Rental income
- $15,920
- − Mortgage interest
- −$5,181
- − Property taxes
- −$669
- − Insurance
- −$462
- − Repairs & maintenance
- −$1,274
- − Management
- −$1,274
- − Depreciation
- −$2,691
- Taxable income
- $4,369
- Est. tax owed @ 24.0%
- −$1,049
- After-tax cash flow
- $4,576/yr
For passive investors: Depreciation is non-cash, so a rental often shows a tax loss while cash-flowing — sheltering income. Rental losses are passive: they offset passive income freely, and up to $25,000/yr can offset ordinary (W-2) income if you actively participate and your MAGI is under $100k (phasing out to $0 by $150k); unused losses carry forward. On sale, claimed depreciation is recaptured at up to 25%, and gains may owe capital-gains tax (a 1031 exchange can defer both). Figures are a year-1 estimate at your 24.0% rate — not tax advice; consult a CPA.
Schools (NCES district)
- District
- Vicksburg Warren School District
- NCES district ID
- 2804470
- Math proficiency
- 22% ▼ -11.00%
- Reading proficiency
- 26% ▼ -6.00%
- Median HH income
- $40,492
- Composite
- 20.31/100
- National rank
- #8612
- State rank
- #82 of 130 in MS
Livability — Vicksburg
- Score
- 63/100
- State rank
- #166
- US rank
- #16032
Category grades
Schools grade is shown separately in the Schools card above.
Census & demographics
- Census place
- Vicksburg, MS
- County
- Warren County · 28,479 people
- City population
- 28,479
- Metro
- Vicksburg, MS
- Population (ZIP)
- 28,479
- Household income
- $56,837
- Rent vs Own
- Severe rent burden
- 665.0
Population outlook (Warren County) Hauer SSP2
- Today (2025)
- 45,473 people
- By 2030
- 44,051 · -3.1%
- By 2040
- 40,884 · -10.1%
- By 2050
- 37,596 · -17.3%
- By 2075
- 30,162 · -33.7%
- By 2100
- 23,585 · -48.1%
Race, ethnicity, and origin ACS 2023
- Neighborhood character
- Majority Black (51%)
- Race & ethnicity
- Black 51% White 44% Two or more races 3% Hispanic / Latino 2%
- Common ancestry
- Slovak 2% Serbian 1% Lithuanian 1%
- Foreign-born
- 2% · Canada
- Languages at home
- 96% English-only · Spanish 2% Other Indo-European 1%
Political lean MEDSL · Warren
- 2024 margin
- Toss-up / Even · D 47.5% · R 51.4% · Other 1.1%
- 2008→2024 swing
- -0.9pp no change · 2008: -3.0pp · 2024: -4.0pp
- All cycles
- 2024: R+4.0 2020: D+0.4 2016: R+4.9 2012: D+2.6 2008: R+3.0
Not yet ingested
- Civics
- —
Market trends
- HPI YoY
- ▼ -60.49%
- Current HPI
- 154.033
- Rent YoY
- —
- Metro
- Vicksburg, MS
- State GDP YoY
- —
- F500 in state
- 0
Price history
-6.6% since first listed4 events — show timeline
- 2026-05-15 Pending — MLSU
- 2026-05-04 Listed $92,500 MLSU
- 2001-02-28 Sold (MLS) — VWCBR
- 2000-09-27 Listed $99,000 VWCBR
Property tax history
+2.2%/yrLatest (2025): $669 · +1.4% YoY. Source: county tax records.
Cash-flow waterfall
monthlySold comps — $/sqft
last 12 mo · ≤1 miLoading sold comps…