8968 Winter Gardens Blvd Spc 1 · Winter Gardens, CA
Flood risk 1/10 · Minimal
- FEMA flood zone
- X (unshaded)
- Chance of flooding over 30 yrs
- 0.0%
- Est. flood insurance / yr
- $507 – $1,088
Fire risk 1/10 · Minimal
- Est. fire insurance / yr
- $659 – $1,223
Heat risk 6/10 · Moderate
- Hot days now (above 98°F)
- 5 days/yr
- Hot days in 30 yrs
- 15 days/yr
Wind risk 1/10 · Minimal
- Chance of severe wind over 30 yrs
- —
Air-quality risk 4/10 · Minor
- Unhealthy air days now
- 6 days/yr
- Unhealthy air days in 30 yrs
- 7 days/yr
Risk factors via First Street. Map © Google.
Why this score? — see what drove the C- grade
The composite is a weighted blend of 9 inputs, each scored 0–100. Each bar is that input's sub-score; the figure is the points it added to the 100-point composite (weight × sub-score).
- Cash flow +20.7/30.0
- DSCR +6.6/10.0
- 1% rule +5.5/10.0
- ARV discount +5.4/15.0
- Schools +4.4/10.0
- Condition / age +3.8/5.0
- Rent growth +3.4/5.0
- Livability +3.1/5.0
- Appreciation +0.0/10.0
$320,000
🖨 Deal sheet (PDF) 📄 Offer letter ✓ Due diligence
Listing remarks
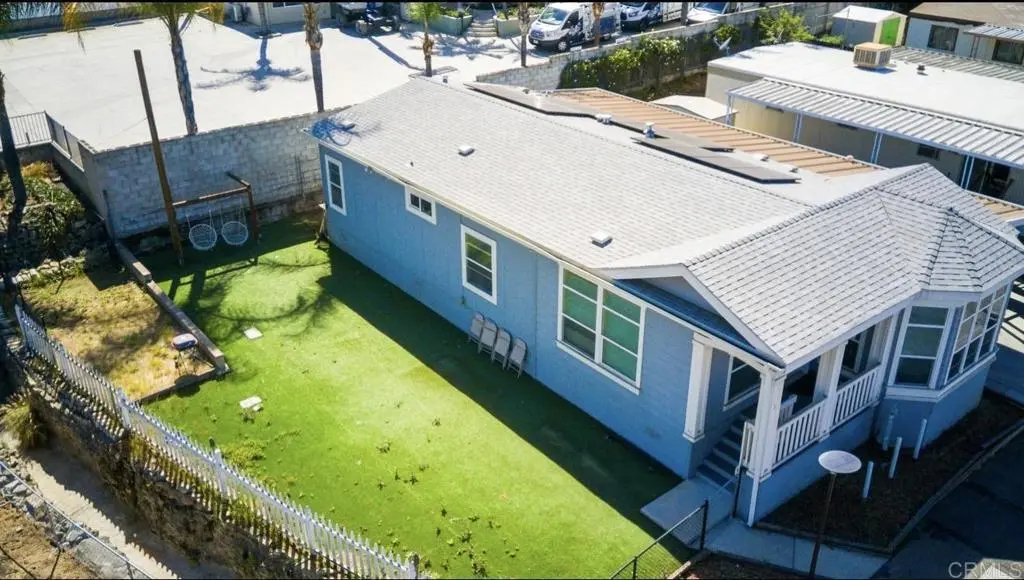
Welcome to your new Home! This charming, well maintained home is located in a quiet All Age community in Lakeside. The home is 3 BR, 2 BA with a large yard and lots of storage. Open floor plan, coved ceilings, recessed lighting and ceiling fans in every room. The spacious open kitchen has an eat-at island, lots of cabinets and counter space. The stainless steel appliances and the washer/dryer are included! The primary bedroom and bath feature a walk-in closet, dual sink vanity and a step-in shower. Solar is fully paid off, providing energy efficiency and savings. Enjoy the large fenced yard has synthetic grass with plenty of room to BBQ and entertain. Central AC and a matching shed. You'll
Key facts
- Open floor plan
- Walk-in closet
- Large yard
Tags
Property features AI
Finance
- Financial info: Land lease amount: $1,795 (land lease applies)
- HOA & community: Community sidewalks; Park managed by J&H Property Management
Exterior
- Parking: Accessible parking features
- Utilities: Water/sewer/power information not provided
- Home design: Single-story home; Mobile home remains on site; Entry on main level
- Construction: Asbestos shingle roof; Concrete and hardboard construction; Synthetic stucco; Drywall interior walls; Year built per assessor
- Exterior features: Porch; Open patio; Patio; Wrap-around patio; Shed; Fenced yard with wire, wood and privacy fencing; Solar panels
Interior
- Kitchen: Remodeled kitchen with quartz counters; Kitchen open to family room; Kitchen island; Butler’s pantry; Walk-in pantry; Gas oven; Built-in range; Gas range; Range/stove hood; Microwave; Refrigerator; Ice maker; Dishwasher; Garbage disposal; Trash compactor; Hot water circulator; Vented exhaust fan; Gas water heater
- Bedrooms: All bedrooms located on the main level
- Flooring: Vinyl flooring; Carpet; See remarks
- Bathrooms: Two full bathrooms; Master bath with double sinks; Double sinks in bath(s); Bathtub; Shower in tub; Privacy toilet door; Exhaust fan(s); Remodeled bathrooms
- Heating & cooling: High-efficiency heating; Central cooling
- Interior features: Dry bar; Ceiling fan(s); Pantry; Open floor plan; Storage space; Entry on main level; All bedrooms on main level; One story
- Laundry & utility: Inside laundry room; Washer included; Dryer included; Washer hookup; Gas dryer hookup; Individual laundry room
Neighborhood map
What this means for you Summary
Snapshot
- This is a 3-bed/2.0-bath manufactured listed at $320k. Condition is rated good.
Deal economics
- At list price, monthly cash flow is $435 ($5k/yr) — positive.
- The deal already cash-flows at list — no discount required.
- Meets the 1% rule at list price ($3k rent vs $320k).
- Recommended offer: $291k (9.0% below list) — sets the bar for market timing.
- Cap rate 7.9% vs local median 2.6% in Winter Gardens — top-decile yield for the area; either an underpriced asset or a hidden risk that comps aren't pricing in. Stress-test before assuming the spread holds.
Location & tenants
- Location reads 61/100 on livability (#515 in CA) — a middle-class / working-renter tenant base. Strengths: commute A+, employment A-, housing A-; Watch: schools C-, crime D-, amenities F.
- Lakeside Union Elementary (suburban): math 41% / reading 52% proficiency, ranked #480 of 1,400 in CA (top 34%) — families likely to look elsewhere, expect single-tenant / working-renter base with shorter leases.
- Market conditions: Rents rising (+3.6%/yr); 148 active listings in the ZIP; 5 comparable units currently listed for rent nearby; rentals leasing fast (median 3d on market — plan ~1-2 weeks tenant-placement turnaround); solid renter incomes; 11,759 units permitted in San Diego County in 2024 (7,244 in 5+ unit buildings).
- This rent runs 37% of the median local income ($108k/yr) — at the standard rent-burdened threshold; future hikes will face affordability resistance.
Forward outlook
- Local home prices are declining (-3.0%/yr); year-one equity from $2k of loan paydown is wiped out by about $10k of value loss. Plan a longer hold.
- San Diego County population projected at +20% by 2050 — long-run rental-demand tailwind backs the buy-and-hold thesis.
Negotiation context
- It's been on market 94 days — a 9% lower offer ($291k) is reasonable based on typical stale-listing flexibility.
Risks & watch-outs
- Climate carrying-cost: extreme-heat days projected 5→15/yr by 2055 (HVAC capex compounding) — expect insurance premiums to compound above CPI over the hold.
Questions for the listing agent
- It's been on market 94 days. Have you received any prior offers? Is the seller open to a 9% concession, seller financing, or rate buy-down credit?
- Why hasn't it sold? Are there any deal-killer items the seller is aware of (foundation, flood, title, zoning, code violations)?
- Is there a deadline driving the sale (1031 exchange, divorce, estate, relocation)? That informs how much negotiation room exists.
- Crime grade is D in this area — have there been break-ins, vandalism, or insurance claims at this property in the last 3 years? What carrier currently insures it and at what premium?
- What's the average days-on-market for RENTAL listings here right now (not sales)? A rising rental-DOM trend means longer vacancies and softer asking-rent achievability than the comps imply.
- What's the recent tenant-quality profile in this submarket — average credit score on applications, eviction rate, late-payment / NSF rate, and stable-employment percentage? A property-management company in the area should have these aggregated.
- How much new for-sale + rental construction is in the pipeline within 1–3 miles? Heavy new supply typically softens prices + rents 12–24 months out; constrained supply supports both.
Investment metrics
- 1% rule
- 1.05% ✓
- Cap rate
- 7.92%
- Cash-on-cash
- 5.83%
- DSCR
- 1.26
- GRM
- 8.0
CMA / ARV
- ARV (on-the-fly)
- $305,856
- Comps found
- 7
Show comp detail 7 sales within ~0.75 mi
| Address | Dist | Beds/Ba | Sqft | Sold | Price | $/sf | Match |
|---|---|---|---|---|---|---|---|
| 8661 Wintergardens Blvd #74 | 0.46mi | 3/2.0 | 1,538 (-4%) | 0mo | $295,000 | $192 | 72 |
| 9100 Single Oak Dr #103 | 0.43mi | 3/2.0 | 1,440 (-10%) | 13mo | $309,000 | $215 | 53 |
| 9100 Single Oak Dr #110 | 0.43mi | 2/2.0 (-1) | 1,392 (-13%) | 2mo | $230,000 | $165 | 53 |
| 9100 Single Oak Dr #69 | 0.45mi | 2/2.0 (-1) | 1,440 (-10%) | 10mo | $195,000 | $135 | 50 |
| 9100 Single Oak Dr Spc 10 | 0.43mi | 2/2.0 (-1) | 1,774 (+11%) | 11mo | $285,000 | $161 | 47 |
| 9100 Single Oak Dr #74 | 0.43mi | 3/2.0 | 1,368 (-14%) | 12mo | $304,000 | $222 | 46 |
| 11747 Walnut Rd | 0.61mi | 3/2.0 | 1,795 (+13%) | 21mo | $715,000 | $398 | 33 |
Match score weights: distance 35% · size 25% · config 20% · recency 20%. Top-matched comps best support the ARV.
Projected returns pro-forma
-3.0% appreciation · 3.56% rent growth · sell at horizon
- IRR
- -6.6%
- Equity multiple
- 0.75×
- Total profit
- $-22,199
- Equity at exit
- $47,713
- IRR
- 3.7%
- Equity multiple
- 1.27×
- Total profit
- $24,430
- Equity at exit
- $27,668
Cash invested: $89,600 (down + closing). Projections, not guarantees.
Landlord ↔ Tenant lean methodology
- Overall (STATE)
- 18 Strongly Tenant-Friendly
- State California
- 18 Strongly Tenant-Friendly · D+13
- County
- — inherits STATE
- City
- — inherits STATE
ZIP-level market 92040
- Rents YoY
- 3.6%
- Active inventory
- 148
- Price-to-rent
- 8.0×
Monthly cashflow live
- Estimated rent
- $3,350 high interval (Pro) →
- Mortgage (P&I)
- −$1,678
- Tax est. 1.5%
- −$400 /mo · $4,800/yr
- Insurance
- −$133
- HOA
- −$0
- Vacancy / Maint / Mgmt
- −$703
- Net cashflow
- $435
Break-even live
Sensitivity live
| Price | -10% $656 | -5% $546 | +0% $435 | +5% $324 | +10% $214 |
|---|---|---|---|---|---|
| Rent | -10% $170 | -5% $303 | +0% $435 | +5% $567 | +10% $700 |
| Rate | -1.0pp $596 | -0.5pp $516 | base $435 | +0.5pp $352 | +1.0pp $268 |
UW: 25.0% down · 7.5% · 30yr · 1.5% tax · 5.0% vac · 8.0% maint · 8.0% mgmt
Financing live
Cash to close
- Down payment
- $80,000
- Closing costs
- $9,600
- Reserves months
- —
- Total cash needed
- —
Loan-product check · same deal, 3 products live
Conventional
25% down · 7.5% · 30yr
- Down + closing
- —
- Monthly P&I
- —
- Monthly cashflow
- —
- DSCR
- —
- Eligible?
- —
Personal DTI + credit; lowest rate.
DSCR
20% down · 8.5% · 30yr
- Down + closing
- —
- Monthly P&I
- —
- Monthly cashflow
- —
- DSCR
- —
- Eligible?
- —
No personal income docs; deal must DSCR.
Hard money
10% down · 12.0% · 12mo
- Down + closing
- —
- Monthly P&I
- —
- Monthly cashflow
- —
- DSCR
- —
- Eligible?
- —
Short-term bridge; refi at stabilization.
Rent comps 5 comps
| Address | Beds | Baths | Sqft | Rent | $/sqft | DOM | Units | Dist |
|---|---|---|---|---|---|---|---|---|
| 9205 Emerald Grove Ave Lakeside, CA | 3.0 | 2.0 | 1652 | $3,650 | $2.21 | 3d | 1 | 0.40mi |
| 9830 Summersun Ln Lakeside, CA | 2.0–3.0 | 1.5–2.5 | 1325 | $2,700 | $2.04 | 2d | 1 | 1.11mi |
| 9094 Los Coches Rd Lakeside, CA | 3.0 | 2.5 | 1200 | $4,000 | $3.33 | 0d | 1 | 1.17mi |
| 9092 Los Coches Rd Lakeside, CA | 3.0 | 2.5 | 1300 | $4,000 | $3.08 | 3d | 1 | 1.17mi |
| 8031 Winter Gardens Blvd El Cajon, CA | 3.0 | 2.0 | 1124 | $2,995 | $2.66 | 0d | 1 | 1.18mi |
Listing history 15 events
-
2026-06-21days on market $320,000 Active 94 DOM
-
2026-06-18days on market $320,000 Active 91 DOM
-
2026-06-17days on market $320,000 Active 90 DOM
-
2026-06-16days on market $320,000 Active 89 DOM
-
2026-06-15days on market $320,000 Active 88 DOM
-
2026-06-13days on market $320,000 Active 86 DOM
-
2026-06-09days on market $320,000 Active 82 DOM
-
2026-06-08days on market $320,000 Active 81 DOM
-
2026-06-07days on market $320,000 Active 80 DOM
-
2026-06-04days on market $320,000 Active 77 DOM
-
2026-06-03days on market $320,000 Active 76 DOM
-
2026-06-02days on market $320,000 Active 75 DOM
-
2026-06-01days on market $320,000 Active 74 DOM
-
2026-05-31days on market $320,000 Active 73 DOM
-
2026-03-19$330,000 Active
ⓘ Source: listings_history table (triggers on properties + properties_extension) + one-shot
backfill from property_details.listing_events for pre-trigger history.
Climate risk First Street
- Flood 1/10 Low FEMA zone X (unshaded) · 0% chance over 30 yrs
- Wildfire 1/10 Low
- Heat 6/10 Major 5 d/yr ≥98°F today · 15 d/yr by 30 yrs out
- Wind 1/10 Low
- Air quality 4/10 Moderate 6 unhealthy d/yr today · 7 by 30 yrs out
Nearby sold comps map
Loading sold comps map…
Walkable amenities ~0.75 mi
Loading nearby amenities…
Taxation est. · year 1
- Rental income
- $40,200
- − Mortgage interest
- −$17,925
- − Property taxes
- −$4,800
- − Insurance
- −$1,600
- − Repairs & maintenance
- −$3,216
- − Management
- −$3,216
- − Depreciation
- −$9,309
- Taxable income
- $134
- Est. tax owed @ 24.0%
- −$32
- After-tax cash flow
- $5,188/yr
For passive investors: Depreciation is non-cash, so a rental often shows a tax loss while cash-flowing — sheltering income. Rental losses are passive: they offset passive income freely, and up to $25,000/yr can offset ordinary (W-2) income if you actively participate and your MAGI is under $100k (phasing out to $0 by $150k); unused losses carry forward. On sale, claimed depreciation is recaptured at up to 25%, and gains may owe capital-gains tax (a 1031 exchange can defer both). Figures are a year-1 estimate at your 24.0% rate — not tax advice; consult a CPA.
Condition & rehab AI · 13 photos
This well-maintained, modern home in a quiet community offers a good investment opportunity with minimal repairs needed.
Value-add opportunities
- Resale Paint exterior — Enhances curb appeal and value
- Rental Replace blinds — Improves light control and energy efficiency
Renovation cost estimate screening
Value-add ROI direction
- Resale Paint exterior — Enhances curb appeal and value ↑
- Rental Replace blinds — Improves light control and energy efficiency ↑
ⓘ Cost ranges are severity-bucket heuristics (US national rule-of-thumb). Get contractor quotes + a written scope before underwriting a rehab budget.
Schools (NCES district)
- District
- Lakeside Union Elementary
- NCES district ID
- 0620790
- Math proficiency
- 41% ▬ 0.00%
- Reading proficiency
- 52% ▼ -1.00%
- Median HH income
- $65,574
- Composite
- 43.51/100
- National rank
- #6453
- State rank
- #480 of 1400 in CA
Livability — Winter Gardens
- Score
- 61/100
- State rank
- #515
- US rank
- #17448
Category grades
Schools grade is shown separately in the Schools card above.
Census & demographics
- Census place
- Winter Gardens, CA
- County
- San Diego County · 3,178,799 people
- Metro
- San Diego-Chula Vista-Carlsbad, CA
- Population (ZIP)
- 46,216
- Household income
- $107,937
- Rent vs Own
- Severe rent burden
- 1147.0
Population outlook (San Diego County) Hauer SSP2
- Today (2025)
- 3,678,185 people
- By 2030
- 3,856,546 · +4.8%
- By 2040
- 4,171,407 · +13.4%
- By 2050
- 4,421,607 · +20.2%
- By 2075
- 4,831,599 · +31.4%
- By 2100
- 4,832,502 · +31.4%
Race, ethnicity, and origin ACS 2023
- Neighborhood character
- Predominantly White (69%)
- Race & ethnicity
- White 69% Hispanic / Latino 22% Two or more races 11% Black 2% Asian 2% Native American 1%
- Hispanic origin (detail)
- Mexican 19%
- Common ancestry
- Lithuanian 3% Italian 3% Slovak 2%
- Foreign-born
- 8% · Canada
- Languages at home
- 86% English-only · Spanish 10% Arabic 1% Other Indo-European 1%
Political lean MEDSL · San Diego
- 2024 margin
- D (+16.8) · D 56.9% · R 40.1% · Other 2.9%
- 2008→2024 swing
- +6.6pp toward D · 2008: 10.2pp · 2024: 16.8pp
- All cycles
- 2024: D+16.8 2020: D+22.8 2016: D+17.8 2012: D+5.1 2008: D+10.2
Not yet ingested
- Civics
- —
Market trends
- HPI YoY
- ▼ -622.09%
- Current HPI
- 344.8263
- Rent YoY
- ▲ 3.56%
- Metro
- San Diego-Chula Vista-Carlsbad, CA
- State GDP YoY
- ▲ 3.21%
- F500 in state
- 116
Industry mix (Fortune 500 HQ in CA)
| Industry | F500 HQs | Revenue |
|---|---|---|
| Technology | 27 | $1,492B |
|
||
| Financial Services | 3 | $174B |
|
||
| Retail | 3 | $44B |
|
||
| Insurance | 3 | $26B |
|
||
| Media / Entertainment | 2 | $115B |
|
||
| Pharmaceuticals / Biotech | 2 | $62B |
|
||
Price history
1 event — show timeline
- 2026-03-19 Listed $330,000 CRMLS
Cash-flow waterfall
monthlySold comps — $/sqft
last 12 mo · ≤1 miLoading sold comps…