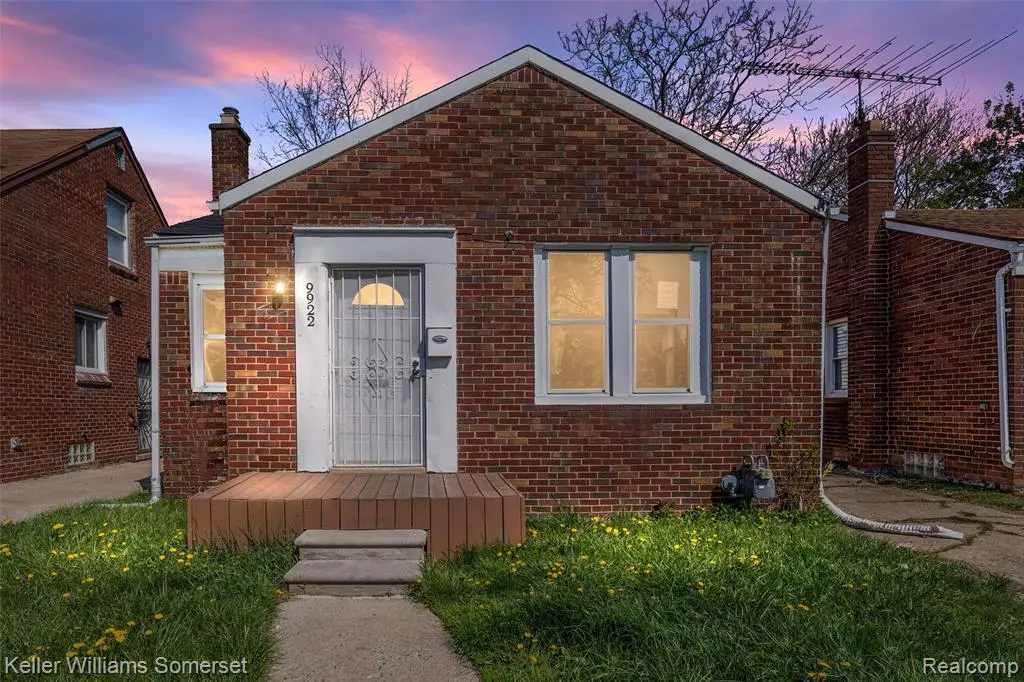
9922 Coyle St · Detroit, MI
Flood risk 1/10 · Minimal
- FEMA flood zone
- X (unshaded)
- Chance of flooding over 30 yrs
- 0.0%
- Est. flood insurance / yr
- $473 – $860
Fire risk 1/10 · Minimal
- Est. fire insurance / yr
- $784 – $1,456
Heat risk 3/10 · Minor
- Hot days now (above 98°F)
- 7 days/yr
- Hot days in 30 yrs
- 15 days/yr
Wind risk 2/10 · Minimal
- Chance of severe wind over 30 yrs
- —
Air-quality risk 3/10 · Minor
- Unhealthy air days now
- 2 days/yr
- Unhealthy air days in 30 yrs
- 5 days/yr
Risk factors via First Street. Map © Google.
Why this score? — see what drove the C+ grade
The composite is a weighted blend of 9 inputs, each scored 0–100. Each bar is that input's sub-score; the figure is the points it added to the 100-point composite (weight × sub-score).
- Cash flow +30.0/30.0
- 1% rule +10.0/10.0
- DSCR +10.0/10.0
- Rent growth +3.9/5.0
- Livability +3.7/5.0
- Condition / age +2.5/5.0
- Schools +1.3/10.0
- ARV discount +0.0/15.0
- Appreciation +0.0/10.0
$65,000
🖨 Deal sheet 📄 Offer letter ✓ Due diligence
Listing remarks MLS
Welcome to 9922 Coyle in Detroit, an excellent opportunity for homeowners and investors alike! This charming property offers a spacious layout with great natural light, providing a warm and inviting atmosphere throughout. Featuring well-sized bedrooms, a functional floor plan, and plenty of potential to make it your own, this home is perfect for those looking to add personal touches or generate rental income. Conveniently located near major roads, shopping, and local amenities, this property combines comfort, value, and accessibility. Don't miss your chance to own a good home in a growing area of Detroit!
Key facts
- 3,920 sq ft lot
- Garage
- Built 1944
Property features AI
Exterior
- Parking: Detached 1-car garage
- Utilities: Public water; Public sewer
- Home design: Single-family residence; One level; Ground-level entry with steps; Brick exterior
- Construction: Block foundation
- Exterior features: Paved road access; Lot approximately 0.09 acres (35 x 105.25)
Interior
- Bedrooms: Bedrooms included in 4-room count
- Bathrooms: 1 full bathroom
- Heating & cooling: Forced air heating; Natural gas heating; No cooling
- Interior features: Unfinished basement; Total of 4 rooms
Neighborhood map
What this means for you Summary
Snapshot
- This is a 2-bed/1.0-bath single-family listed at $65k.
Deal economics
- At list price, monthly cash flow is $537 ($6k/yr) — positive.
- The deal already cash-flows at list — no discount required.
- Meets the 1% rule at list price ($1k rent vs $65k).
- Recommended offer: $63k (3.0% below list) — sets the bar for market timing.
- Cap rate 16.2% vs local median 10.2% in Detroit — top-decile yield for the area; either an underpriced asset or a hidden risk that comps aren't pricing in. Stress-test before assuming the spread holds.
Location & tenants
- Location reads 73/100 on livability (#218 in MI) — a middle-class / working-renter tenant base. Strengths: amenities A+, commute A+, cost of living A+; Watch: schools F, crime F, employment F.
- Detroit Public Schools Community District (urban): math 10% / reading 24% proficiency, ranked #499 of 540 in MI (top 92%) — low school quality limits family demand, transient renter base, plan for 1-2y turnover; 90% free/reduced lunch — lower-income household profile, screen leases tightly.
- Market conditions: Rents rising fast (+5.6%/yr); 385 active listings in the ZIP; 40 comparable units currently listed for rent nearby; rentals lingering (median 44d on market — plan ~5-8 weeks vacancy on turnover, expect pricing pressure); 58% of comp listings sitting > 30 days — soft ceiling on asking rent; lower-income renter base — watch delinquency; 2,639 units permitted in Wayne County in 2024 (1,216 in 5+ unit buildings).
- This rent runs 41% of the median local income ($37k/yr) — at the standard rent-burdened threshold; future hikes will face affordability resistance.
Forward outlook
- Local home prices are declining (-3.0%/yr); year-one equity from $449 of loan paydown is wiped out by about $2k of value loss. Plan a longer hold.
- Wayne County population projected at -17% by 2050 — secular population decline; favor cash flow + early exit over multi-decade hold.
- At projected returns (-3.0% appreciation + 5.6% rent growth), your $18k cash investment doubles in ~4 years — after that, you're playing with house money.
Negotiation context
- It's been on market 49 days — a 3% lower offer ($63k) is reasonable based on typical stale-listing flexibility.
- 5 sale attempts since 18y ago; this cycle's ask has dropped $5k (7%) from the opening price — seller is motivated, your offer sets the floor, not the list.
Risks & watch-outs
- Watch-outs: built in 1944 — expect roof / HVAC / electrical / plumbing capex.
Questions for the listing agent
- It's been on market 49 days. Have you received any prior offers? Is the seller open to a 3% concession, seller financing, or rate buy-down credit?
- Built in 1944 — when were the roof, HVAC, electrical panel, plumbing, and water heater last replaced?
- Is there a deadline driving the sale (1031 exchange, divorce, estate, relocation)? That informs how much negotiation room exists.
- Schools are F-rated, which usually means shorter tenancies and higher turnover. Who's the typical renter profile here, and what's been the actual vacancy rate?
- Crime grade is F in this area — have there been break-ins, vandalism, or insurance claims at this property in the last 3 years? What carrier currently insures it and at what premium?
- What's the average days-on-market for RENTAL listings here right now (not sales)? A rising rental-DOM trend means longer vacancies and softer asking-rent achievability than the comps imply.
- What's the recent tenant-quality profile in this submarket — average credit score on applications, eviction rate, late-payment / NSF rate, and stable-employment percentage? A property-management company in the area should have these aggregated.
- How much new for-sale + rental construction is in the pipeline within 1–3 miles? Heavy new supply typically softens prices + rents 12–24 months out; constrained supply supports both.
Investment metrics
- 1% rule
- 1.92% ✓
- Cap rate
- 16.21%
- Cash-on-cash
- 35.42%
- DSCR
- 2.58
- GRM
- 4.3
CMA / ARV
- ARV (median comp)
- $54,496
- List price
- $65,000
- Delta
- 19.27%
- Verdict
- OVERPRICED
- Comps
- 20 within 1.0 mi
Show comp detail 12 sales within ~0.75 mi
| Address | Dist | Beds/Ba | Sqft | Sold | Price | $/sf | Match |
|---|---|---|---|---|---|---|---|
| 9590 Sussex St | 0.12mi | 2/1.0 | 800 (+3%) | 7mo | $30,000 | $38 | 84 |
| 10000 Montrose St | 0.35mi | 2/1.0 | 732 (-6%) | 4mo | $25,000 | $34 | 70 |
| 9997 Robson St | 0.08mi | 3/1.0 (+1) | 865 (+11%) | 3mo | $35,000 | $40 | 70 |
| 9962 Whitcomb St | 0.12mi | 2/1.0 | 859 (+10%) | 11mo | $77,500 | $90 | 68 |
| 11360 Prest St | 0.26mi | 3/1.0 (+1) | 842 (+8%) | 3mo | $55,000 | $65 | 67 |
| 9425 Marlowe St | 0.30mi | 2/1.0 | 712 (-8%) | 10mo | $47,500 | $67 | 63 |
| 11694 Forrer St | 0.57mi | 3/1.0 (+1) | 768 (-1%) | 6mo | $58,000 | $76 | 61 |
| 9176 Winthrop St | 0.50mi | 3/1.0 (+1) | 730 (-6%) | 2mo | $30,000 | $41 | 59 |
| 8896 Coyle St | 0.60mi | 3/1.0 (+1) | 768 (-1%) | 9mo | $45,000 | $59 | 57 |
| 9580 Mansfield St | 0.54mi | 2/1.0 | 890 (+14%) | 0mo | $23,000 | $26 | 50 |
| 10017 Mansfield St | 0.56mi | 2/1.0 | 862 (+11%) | 8mo | $45,000 | $52 | 49 |
| 9965 Asbury Park | 0.75mi | 3/1.0 (+1) | 824 (+6%) | 5mo | $60,000 | $73 | 46 |
Match score weights: distance 35% · size 25% · config 20% · recency 20%. Top-matched comps best support the ARV.
Projected returns pro-forma
-3.0% appreciation · 5.59% rent growth · sell at horizon
- IRR
- 33.9%
- Equity multiple
- 2.49×
- Total profit
- $27,035
- Equity at exit
- $9,692
- IRR
- 42.2%
- Equity multiple
- 5.51×
- Total profit
- $82,114
- Equity at exit
- $5,620
Cash invested: $18,200 (down + closing). Projections, not guarantees.
Landlord ↔ Tenant lean methodology
- Overall (STATE)
- 62 Landlord-Friendly
- State Michigan
- 62 Landlord-Friendly · EVEN
- County
- — inherits STATE
- City
- — inherits STATE
ZIP-level market 48227
- Rents YoY
- 5.6%
- Active inventory
- 385
- Price-to-rent
- 4.3×
Monthly cashflow live
- Estimated rent
- $1,249 high interval (Pro) →
- Mortgage (P&I)
- −$341
- Tax est. 1.5%
- −$81 /mo · $975/yr
- Insurance
- −$27
- HOA
- −$0
- Vacancy / Maint / Mgmt
- −$262
- Net cashflow
- $537
Break-even live
UW: 25.0% down · 7.5% · 30yr · 1.5% tax · 5.0% vac · 8.0% maint · 8.0% mgmt
Financing live
Cash to close
- Down payment
- $16,250
- Closing costs
- $1,950
- Reserves months
- —
- Total cash needed
- —
Loan-product check · same deal, 3 products live
Conventional
25% down · 7.5% · 30yr
- Down + closing
- —
- Monthly P&I
- —
- Monthly cashflow
- —
- DSCR
- —
- Eligible?
- —
Personal DTI + credit; lowest rate.
DSCR
20% down · 8.5% · 30yr
- Down + closing
- —
- Monthly P&I
- —
- Monthly cashflow
- —
- DSCR
- —
- Eligible?
- —
No personal income docs; deal must DSCR.
Hard money
10% down · 12.0% · 12mo
- Down + closing
- —
- Monthly P&I
- —
- Monthly cashflow
- —
- DSCR
- —
- Eligible?
- —
Short-term bridge; refi at stabilization.
Rent comps 40 comps
| Address | Beds | Baths | Sqft | Rent | $/sqft | DOM | Units | Dist |
|---|---|---|---|---|---|---|---|---|
| 9917 Sussex St Detroit, MI | 2.0 | 1.0 | 800 | $1,375 | $1.72 | 43d | 1 | 0.07mi |
| 10015 Robson St Detroit, MI | 3.0 | 2.0 | 1000 | $1,400 | $1.40 | 17d | 1 | 0.12mi |
| 9546 Sussex St Detroit, MI | 3.0 | 1.0 | 1000 | $1,400 | $1.40 | 43d | 1 | 0.13mi |
| 9386 Coyle St Detroit, MI | 3.0 | 1.0 | 1000 | $1,300 | $1.30 | 1d | 1 | 0.24mi |
| 14740 W Chicago Unit B Detroit, MI | 2.0 | 1.0 | 900 | $845 | $0.94 | 43d | 1 | 0.24mi |
| 9590 Marlowe St Detroit, MI | 2.0 | 1.0 | 877 | $1,430 | $1.63 | 43d | 1 | 0.25mi |
| 9601 Greenfield Rd Detroit, MI | 1.0 | 1.0 | 500 | $725 | $1.45 | 43d | 1 | 0.25mi |
| 11397 Whitcomb St Detroit, MI | 3.0 | 1.0 | 1070 | $1,400 | $1.31 | 16d | 1 | 0.29mi |
| 9973 Winthrop St Detroit, MI | 3.0 | 1.0 | 960 | $1,400 | $1.46 | 43d | 1 | 0.31mi |
| 11393 Prest St Detroit, MI | 3.0 | 1.0 | 900 | $1,550 | $1.72 | 16d | 1 | 0.31mi |
| 11345 Greenfield Rd Detroit, MI | 2.0 | 1.0 | 700 | $1,050 | $1.50 | 12d | 1 | 0.32mi |
| 9936 Montrose St Detroit, MI | 3.0 | 1.0 | 963 | $1,200 | $1.25 | 16d | 1 | 0.34mi |
| 11634 Sussex St Detroit, MI | 3.0 | 1.0 | 1091 | $1,326 | $1.22 | 24d | 1 | 0.37mi |
| 9222 Forrer St Detroit, MI | 3.0 | 1.0 | 947 | $1,450 | $1.53 | 16d | 1 | 0.50mi |
| 12039 Lauder St Detroit, MI | 3.0 | 1.5 | 1000 | $1,500 | $1.50 | 24d | 1 | 0.54mi |
| 9345 Rutherford St Unit 3 Detroit, MI | 2.0 | 1.0 | 850 | $1,050 | $1.24 | 24d | 1 | 0.57mi |
| 12121 Montrose St Detroit, MI | 3.0 | 1.0 | 874 | $1,373 | $1.57 | 21d | 1 | 0.70mi |
| 13717 Keal St Detroit, MI | 2.0 | 1.0 | 799 | $1,000 | $1.25 | 43d | 1 | 0.71mi |
| 8604 Whitcomb St Detroit, MI | 3.0 | 2.0 | 1033 | $1,300 | $1.26 | 43d | 1 | 0.74mi |
| 9340 Hartwell St Detroit, MI | 3.0 | 1.0 | 1000 | $1,364 | $1.36 | 43d | 1 | 0.90mi |
| 13310 Plymouth Rd Unit 1 Detroit, MI | 1.0 | 1.0 | 650 | $645 | $0.99 | 43d | 1 | 0.94mi |
| 13310 Plymouth Rd Unit 05 Detroit, MI | 1.0 | 1.0 | 650 | $595 | $0.92 | 43d | 1 | 0.94mi |
| 8212 Lauder St Detroit, MI | 3.0 | 1.0 | 1026 | $1,150 | $1.12 | 43d | 1 | 1.00mi |
| 12754 Marlowe St Detroit, MI | 3.0 | 2.0 | 1008 | $1,400 | $1.39 | 16d | 1 | 1.00mi |
| 8114 Marlowe St Unit home Detroit, MI | 3.0 | 1.0 | 985 | $1,350 | $1.37 | 43d | 1 | 1.09mi |
| 9108 Archdale St Detroit, MI | 3.0 | 1.0 | 1000 | $1,300 | $1.30 | 4d | 1 | 1.22mi |
| 13331 Strathmoor St Detroit, MI | 3.0 | 1.0 | 1084 | $1,100 | $1.01 | 16d | 1 | 1.27mi |
| 12775 Plymouth Rd Unit 16 Detroit, MI | 2.0 | 1.0 | 1009 | $825 | $0.82 | 43d | 1 | 1.28mi |
| 12775 Plymouth Rd Apt 23 Detroit, MI | 1.0 | 1.0 | 650 | $605 | $0.93 | 43d | 1 | 1.28mi |
| 12775 Plymouth Rd Apt 11 Detroit, MI | 1.0 | 1.0 | 725 | $635 | $0.88 | 43d | 1 | 1.28mi |
| 9419 Meyers Rd Detroit, MI | 1.0 | 1.0 | 720 | $894 | $1.24 | 43d | 1 | 1.28mi |
| 9415 Meyers Rd Detroit, MI | 1.0 | 1.0 | 720 | $897 | $1.25 | 43d | 1 | 1.28mi |
| 12711 Grandmont Ave Detroit, MI | 3.0 | 1.0 | 1000 | $1,400 | $1.40 | 17d | 1 | 1.28mi |
| 9558 Meyers Rd Detroit, MI | 3.0 | 1.0 | 950 | $1,150 | $1.21 | 43d | 1 | 1.30mi |
| 12611 Memorial St Unit 629203 Detroit, MI | 1.0 | 1.0 | 635 | $995 | $1.57 | 24d | 1 | 1.32mi |
| 12611 Memorial St Unit 629104 Detroit, MI | 1.0 | 1.0 | 700 | $995 | $1.42 | 43d | 1 | 1.32mi |
| 12840 Grandmont Ave Detroit, MI | 3.0 | 1.0 | 1100 | $1,200 | $1.09 | 43d | 1 | 1.34mi |
| 10002 Manor Unit 2 Detroit, MI | 3.0 | 1.0 | 1100 | $1,150 | $1.05 | 43d | 1 | 1.36mi |
| 10002 Manor Unit 1 Detroit, MI | 2.0 | 1.0 | 1000 | $1,050 | $1.05 | 43d | 1 | 1.36mi |
| 18450 W Chicago Detroit, MI | 1.0–2.0 | 1.0 | 687 | $1,117 | $1.62 | 1d | 15 | 1.46mi |
Listing history 25 events
-
2026-06-18days on market $65,000 Active 49 DOM
-
2026-06-17days on market $65,000 Active 48 DOM
-
2026-06-15days on market $65,000 Active 46 DOM
-
2026-06-13days on market $65,000 Active 44 DOM
-
2026-06-13days on market $65,000 Active 43 DOM
-
2026-06-09days on market $65,000 Active 40 DOM
-
2026-06-08days on market $65,000 Active 39 DOM
-
2026-06-07pricedays on market $65,000 Active 38 DOM
-
2026-06-04days on market $70,000 Active 35 DOM
-
2026-06-03days on market $70,000 Active 34 DOM
-
2026-06-02days on market $70,000 Active 33 DOM
-
2026-06-01days on market $70,000 Active 32 DOM
-
2026-05-31days on market $70,000 Active 31 DOM
-
2026-04-30$70,000 Active 612-char remark
Show marketing remark (612 chars)
Welcome to 9922 Coyle in Detroit, an excellent opportunity for homeowners and investors alike! This charming property offers a spacious layout with great natural light, providing a warm and inviting atmosphere throughout. Featuring well-sized bedrooms, a functional floor plan, and plenty of potential to make it your own, this home is perfect for those looking to add personal touches or generate rental income. Conveniently located near major roads, shopping, and local amenities, this property combines comfort, value, and accessibility. Don't miss your chance to own a good home in a growing area of Detroit!
-
2026-04-30$70,000 Active 618-char remark
Show marketing remark (612 chars)
Welcome to 9922 Coyle in Detroit, an excellent opportunity for homeowners and investors alike! This charming property offers a spacious layout with great natural light, providing a warm and inviting atmosphere throughout. Featuring well-sized bedrooms, a functional floor plan, and plenty of potential to make it your own, this home is perfect for those looking to add personal touches or generate rental income. Conveniently located near major roads, shopping, and local amenities, this property combines comfort, value, and accessibility. Don't miss your chance to own a good home in a growing area of Detroit!
-
2020-02-20soldstatus $146,250
-
2008-12-23soldstatus $600
Show marketing remark (248 chars)
Price reduced, nice brick ranch, security door, bank owned. $1000 BONUS TO SELLING AGENT ON ALL OFFERS THAT GO UNDER CONTRACT BETWEEN 12/15/07 AND 12/30/08. Buyer to obtain pre qualification from Wells Fargo Home Mortgage prior to submitted offer.
-
2008-12-08historical
-
2008-09-08$1,900
Show marketing remark (248 chars)
Price reduced, nice brick ranch, security door, bank owned. $1000 BONUS TO SELLING AGENT ON ALL OFFERS THAT GO UNDER CONTRACT BETWEEN 12/15/07 AND 12/30/08. Buyer to obtain pre qualification from Wells Fargo Home Mortgage prior to submitted offer.
-
2008-09-03historical
-
2008-03-05$1,900
-
2008-03-05$5,000
-
2006-08-16soldstatus $62,000
-
1995-03-02soldstatus $250,000
ⓘ Source: listings_history table (triggers on properties + properties_extension) + one-shot
backfill from property_details.listing_events for pre-trigger history.
Climate risk First Street
- Flood 1/10 Low FEMA zone X (unshaded) · 0% chance over 30 yrs
- Wildfire 1/10 Low
- Heat 3/10 Moderate 7 d/yr ≥98°F today · 15 d/yr by 30 yrs out
- Wind 2/10 Low
- Air quality 3/10 Moderate 2 unhealthy d/yr today · 5 by 30 yrs out
Nearby sold comps map
Loading sold comps map…
Walkable amenities ~0.75 mi
Loading nearby amenities…
Taxation est. · year 1
- Rental income
- $14,982
- − Mortgage interest
- −$3,641
- − Property taxes
- −$975
- − Insurance
- −$325
- − Repairs & maintenance
- −$1,199
- − Management
- −$1,199
- − Depreciation
- −$1,891
- Taxable income
- $5,753
- Est. tax owed @ 24.0%
- −$1,381
- After-tax cash flow
- $5,065/yr
For passive investors: Depreciation is non-cash, so a rental often shows a tax loss while cash-flowing — sheltering income. Rental losses are passive: they offset passive income freely, and up to $25,000/yr can offset ordinary (W-2) income if you actively participate and your MAGI is under $100k (phasing out to $0 by $150k); unused losses carry forward. On sale, claimed depreciation is recaptured at up to 25%, and gains may owe capital-gains tax (a 1031 exchange can defer both). Figures are a year-1 estimate at your 24.0% rate — not tax advice; consult a CPA.
Schools (NCES district)
- District
- Detroit Public Schools Community District
- NCES district ID
- 2601103
- Math proficiency
- 10% ▼ -2.00%
- Reading proficiency
- 24% ▲ 6.00%
- Median HH income
- $25,815
- Composite
- 13.06/100
- National rank
- #9564
- State rank
- #499 of 540 in MI
Livability — Detroit
- Score
- 73/100
- State rank
- #218
- US rank
- #5427
Category grades
Schools grade is shown separately in the Schools card above.
Census & demographics
- Census place
- Detroit, MI
- County
- Wayne County · 1,562,939 people
- City population
- 572,865
- Metro
- Detroit-Warren-Dearborn, MI
- Population (ZIP)
- 40,302
- Household income
- $36,527
- Rent vs Own
- Severe rent burden
- 2371.0
Population outlook (Wayne County) Hauer SSP2
- Today (2025)
- 1,675,273 people
- By 2030
- 1,620,300 · -3.3%
- By 2040
- 1,502,341 · -10.3%
- By 2050
- 1,384,039 · -17.4%
- By 2075
- 1,124,592 · -32.9%
- By 2100
- 881,193 · -47.4%
Race, ethnicity, and origin ACS 2023
- Neighborhood character
- Predominantly Black (95%)
- Race & ethnicity
- Black 95% Two or more races 3% White 1%
- Foreign-born
- 1%
- Languages at home
- 98% English-only · Spanish 1% French/Haitian/Cajun 1%
Political lean MEDSL · Wayne
- 2024 margin
- Strong D (+29.0) · D 62.7% · R 33.7% · Other 3.6%
- 2008→2024 swing
- -20.5pp toward R · 2008: 49.5pp · 2024: 29.0pp
- All cycles
- 2024: D+29.0 2020: D+38.1 2016: D+37.3 2012: D+46.9 2008: D+49.5
Not yet ingested
- Civics
- —
Market trends
- HPI YoY
- ▼ -125.00%
- Current HPI
- 186.4158
- Rent YoY
- ▲ 5.59%
- Metro
- Detroit-Warren-Dearborn, MI
- State GDP YoY
- ▲ 1.37%
- F500 in state
- 28
Industry mix (Fortune 500 HQ in MI)
| Industry | F500 HQs | Revenue |
|---|---|---|
| Automotive Parts | 3 | $48B |
|
||
| Automotive | 2 | $372B |
|
||
| Chemicals | 1 | $45B |
|
||
| Automotive Retail | 1 | $29B |
|
||
| Healthcare / Medical Devices | 1 | $23B |
|
||
| Automotive Technology | 1 | $20B |
|
||
Price history
-74.0% since first listed14 events — show timeline
- 2026-06-05 Price Changed $65,000 MiRealSource-MiMLS
- 2026-06-04 Price Changed $65,000 REALCOMP
- 2026-04-30 Listed $70,000 REALCOMP
- 2026-04-30 Listed $70,000 MiRealSource-MiMLS
- 2020-02-20 Sold (Public Records) $146,250 Public Records
- 2008-12-23 Sold (MLS) $600 MiRealSource-MiMLS
- 2008-12-23 Sold (MLS) $600 REALCOMP
- 2008-12-08 Listing Removed — MiRealSource-MiMLS
- 2008-09-08 Listed $1,900 REALCOMP
- 2008-09-03 Listing Removed — REALCOMP
- 2008-03-05 Listed $5,000 REALCOMP
- 2008-03-05 Listed $1,900 MiRealSource-MiMLS
- 2006-08-16 Sold (Public Records) $62,000 Public Records
- 1995-03-02 Sold (Public Records) $250,000 Public Records
Property tax history
+15.0%/yrLatest (2025): $5,734 · +60.7% YoY. Source: county tax records.
Cash-flow waterfall
monthlySold comps — $/sqft
last 12 mo · ≤1 miLoading sold comps…