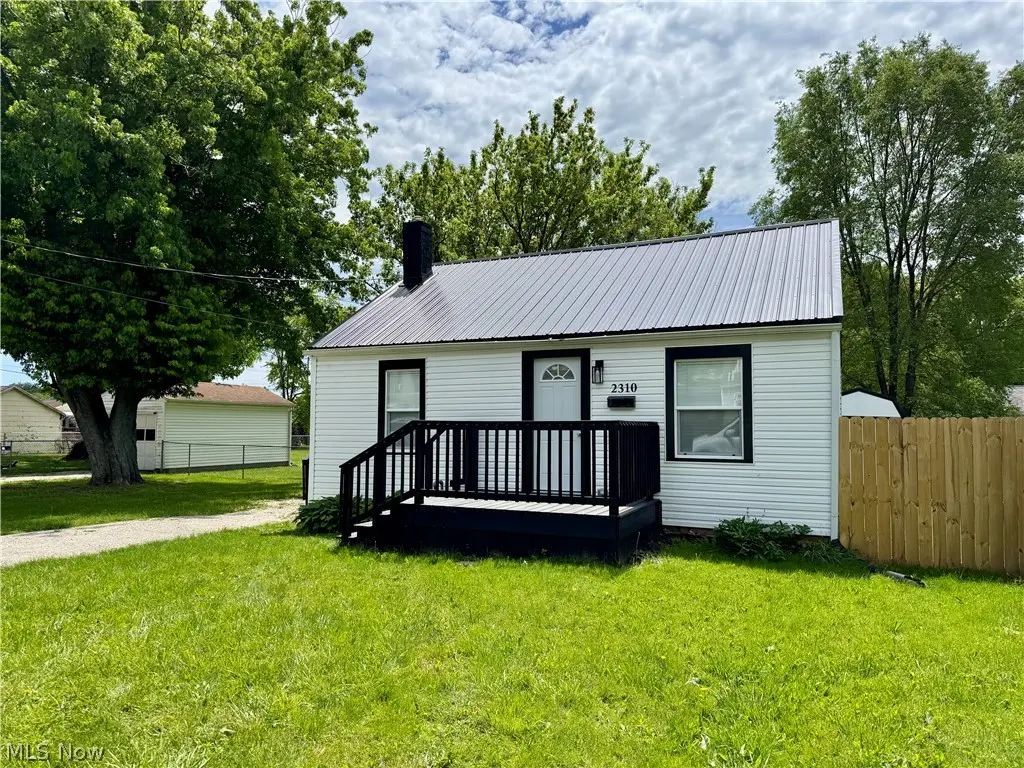
2310 Harmon St NE · Canton, OH
Flood risk 5/10 · Moderate
- FEMA flood zone
- X (unshaded)
- Chance of flooding over 30 yrs
- 0.51%
- Est. flood insurance / yr
- $473 – $860
Fire risk 1/10 · Minimal
- Est. fire insurance / yr
- $713 – $1,323
Heat risk 3/10 · Minor
- Hot days now (above 96°F)
- 7 days/yr
- Hot days in 30 yrs
- 17 days/yr
Wind risk 1/10 · Minimal
- Chance of severe wind over 30 yrs
- —
Air-quality risk 2/10 · Minimal
- Unhealthy air days now
- 1 days/yr
- Unhealthy air days in 30 yrs
- 2 days/yr
Risk factors via First Street. Map © Google.
Why this score? — see what drove the D- grade
The composite is a weighted blend of 9 inputs, each scored 0–100. Each bar is that input's sub-score; the figure is the points it added to the 100-point composite (weight × sub-score).
- Cash flow +13.6/30.0
- Schools +5.5/10.0
- DSCR +4.1/10.0
- Livability +3.6/5.0
- 1% rule +3.0/10.0
- ARV discount +2.9/15.0
- Condition / age +2.5/5.0
- Rent growth +2.4/5.0
- Appreciation +0.0/10.0
$124,900
🖨 Deal sheet (PDF) 📄 Offer letter ✓ Due diligence
Listing remarks
Beautifully updated 2-bedroom, 1-bath home located in the heart of Canton with convenient access to Route 62 and an abundance of nearby shopping and dining. This home has been completely renovated, including a professionally added and Plain Township-approved second floor. The main level features luxury vinyl plank flooring throughout and an open-concept living, dining, and kitchen area that’s perfect for entertaining. A fully remodeled bathroom and spacious first-floor bedroom complete the main level. Upstairs, you’ll find a large second bedroom with a walk-in closet. Step outside to enjoy the fully fenced backyard, ideal for relaxing summer evenings, along with a spacious 12&rs
Key facts
- Walk-in closet
- Updated home
- 4,229 sq ft lot
Tags
Property features AI
Exterior
- Parking: Driveway
- Utilities: Public water; Public sewer
- Home design: Single-story property; Faces north; Block foundation
- Construction: Vinyl siding; Asphalt/fiberglass roof
- Exterior features: Front porch; Backyard fencing; Shed(s); City lot; Property has a view; Updated/remodeled condition
Interior
- Kitchen: Kitchen on the main level
- Bedrooms: One bedroom on the main level; One bedroom on the second level
- Flooring: Carpet in one bedroom
- Bathrooms: One full bathroom on the main level
- Heating & cooling: Forced air heating (gas); Ceiling fan(s) provide cooling/air circulation
- Interior features: Ceiling fan(s); Full unfinished basement
- Laundry & utility: Laundry located in the basement
Neighborhood map
What this means for you Summary
Snapshot
- This is a 2-bed/1.0-bath single-family listed at $125k.
Deal economics
- At list price, monthly cash flow is $7 ($86/yr) — positive.
- The deal already cash-flows at list — no discount required.
- To meet the 1% rule (rent ≥ 1% of price), the offer needs to be $100k (20.3% below list).
- Recommended offer: $100k (20.3% below list) — sets the bar for 1% rule.
- Cap rate 6.4% vs local median 4.9% in Canton — meaningfully above typical; check what's discounted (condition, days-on-market, listing class) to confirm the premium yield is real.
Location & tenants
- Location reads 71/100 on livability (#441 in OH) — a middle-class / working-renter tenant base. Strengths: commute A+, cost of living A+, housing A; Watch: crime F, employment F.
- Plain Local (suburban): math 61% / reading 69% proficiency, ranked #216 of 656 in OH (top 33%) — acceptable for families but not a draw, mixed tenant base, ~2y average lease.
- Zoned schools: Frazer Elementary School (math 87% / reading 72%, grade A, #173 of 1,584 statewide, top 12%, 290 students, 51% FRL); Oakwood Middle School (math 58% / reading 66%, grade B+, #242 of 654 statewide, top 38%, 940 students, 43% FRL); Glenoak High School (math 29% / reading 69%, grade D, #422 of 781 statewide, top 54%, 2,067 students, 37% FRL) — zoned schools at 43% FRL track the district average.
- Market conditions: Rents soft (-0.2%/yr); 71 active listings in the ZIP; 7 comparable units currently listed for rent nearby; rentals at typical pace (median 16d on market — plan ~3-4 weeks tenant-placement turnaround); lower-income renter base — watch delinquency; 528 units permitted in Stark County in 2024 (84 in 5+ unit buildings).
Forward outlook
- Local home prices are declining (-3.0%/yr); year-one equity from $864 of loan paydown is wiped out by about $4k of value loss. Plan a longer hold.
- Stark County population projected to shrink 8% by 2050 — rents likely to lag national; underwrite the cash flow, not the appreciation.
Negotiation context
- It's been on market 31 days — a 3% lower offer ($121k) is reasonable based on typical stale-listing flexibility.
- 2 sale attempts since 2y ago with the ask held roughly flat each time — persistent listings suggest the price (not the market) is what's stuck; bring a comps-based counter.
- Current owner paid $17k; list at $125k implies a 635% gain — meaningful room to come down on a strong offer.
Risks & watch-outs
- Watch-outs: built in 1950 — expect roof / HVAC / electrical / plumbing capex.
- Climate carrying-cost: moderate flood risk — expect insurance premiums to compound above CPI over the hold.
Questions for the listing agent
- It's been on market 31 days. Have you received any prior offers? Is the seller open to a 20% concession, seller financing, or rate buy-down credit?
- Built in 1950 — when were the roof, HVAC, electrical panel, plumbing, and water heater last replaced?
- Is there a deadline driving the sale (1031 exchange, divorce, estate, relocation)? That informs how much negotiation room exists.
- Crime grade is F in this area — have there been break-ins, vandalism, or insurance claims at this property in the last 3 years? What carrier currently insures it and at what premium?
- The area grade is low — what's the realistic commute time and amenity access for the typical tenant pool here? Any planned neighborhood developments (good or bad) we should know about?
- What's the average days-on-market for RENTAL listings here right now (not sales)? A rising rental-DOM trend means longer vacancies and softer asking-rent achievability than the comps imply.
- What's the recent tenant-quality profile in this submarket — average credit score on applications, eviction rate, late-payment / NSF rate, and stable-employment percentage? A property-management company in the area should have these aggregated.
- How much new for-sale + rental construction is in the pipeline within 1–3 miles? Heavy new supply typically softens prices + rents 12–24 months out; constrained supply supports both.
Investment metrics
- 1% rule
- 0.80% ✗
- Cap rate
- 6.36%
- Cash-on-cash
- 0.25%
- DSCR
- 1.01
- GRM
- 10.5
CMA / ARV
- ARV (on-the-fly)
- $113,256
- Comps found
- 12
Show comp detail 12 sales within ~0.75 mi
| Address | Dist | Beds/Ba | Sqft | Sold | Price | $/sf | Match |
|---|---|---|---|---|---|---|---|
| 2333 23rd St NE | 0.19mi | 3/1.0 (+1) | 932 (-0%) | 9mo | $66,000 | $71 | 78 |
| 2220 Harrisburg Rd NE | 0.28mi | 2/1.0 | 908 (-3%) | 7mo | $124,000 | $137 | 76 |
| 2315 Maple Ave NE | 0.50mi | 2/1.0 | 924 (-1%) | 4mo | $102,500 | $111 | 72 |
| 2408 21st St NE | 0.33mi | 2/1.0 | 840 (-10%) | 2mo | $110,000 | $131 | 66 |
| 2656 22nd St NE | 0.49mi | 3/1.0 (+1) | 1,008 (+8%) | 1mo | $25,000 | $25 | 58 |
| 1607 20th St NE | 0.65mi | 3/1.0 (+1) | 908 (-3%) | 5mo | $126,000 | $139 | 56 |
| 1909 Gridley Ave NE | 0.55mi | 3/1.0 (+1) | 1,008 (+8%) | 7mo | $115,000 | $114 | 51 |
| 2735 19th St NE | 0.65mi | 3/1.0 (+1) | 1,008 (+8%) | 2mo | $84,000 | $83 | 50 |
| 2005 17th St NE | 0.63mi | 3/1.0 (+1) | 1,040 (+11%) | 1mo | $144,100 | $139 | 46 |
| 2715 19th St NE | 0.63mi | 3/1.0 (+1) | 1,008 (+8%) | 8mo | $107,500 | $107 | 46 |
| 1417 Colonial Blvd NE | 0.68mi | 2/1.0 | 832 (-11%) | 8mo | $110,000 | $132 | 43 |
| 2102 Endrow Ave NE | 0.75mi | 3/1.0 (+1) | 850 (-9%) | 2mo | $102,500 | $121 | 43 |
Match score weights: distance 35% · size 25% · config 20% · recency 20%. Top-matched comps best support the ARV.
Projected returns pro-forma
-3.0% appreciation · 0.0% rent growth · sell at horizon
- IRR
- -19.0%
- Equity multiple
- 0.35×
- Total profit
- $-22,736
- Equity at exit
- $18,623
- IRR
- -18.5%
- Equity multiple
- 0.12×
- Total profit
- $-30,635
- Equity at exit
- $10,799
Cash invested: $34,972 (down + closing). Projections, not guarantees.
Landlord ↔ Tenant lean methodology
- Overall (STATE)
- 73 Landlord-Friendly
- State Ohio
- 73 Landlord-Friendly · R+6
- County
- — inherits STATE
- City
- — inherits STATE
ZIP-level market 44705
- Rents YoY
- -0.2%
- Active inventory
- 71
- Price-to-rent
- 10.5×
Monthly cashflow live
- Estimated rent
- $996 high interval (Pro) →
- Mortgage (P&I)
- −$655
- Tax from tax record
- −$72 /mo · $869/yr
- Insurance
- −$52
- HOA
- −$0
- Vacancy / Maint / Mgmt
- −$209
- Net cashflow
- $7
Break-even live
Sensitivity live
| Price | -10% $78 | -5% $43 | +0% $7 | +5% $-28 | +10% $-64 |
|---|---|---|---|---|---|
| Rent | -10% $-71 | -5% $-32 | +0% $7 | +5% $47 | +10% $86 |
| Rate | -1.0pp $70 | -0.5pp $39 | base $7 | +0.5pp $-25 | +1.0pp $-58 |
UW: 25.0% down · 7.5% · 30yr · 1.5% tax · 5.0% vac · 8.0% maint · 8.0% mgmt
Financing live
Cash to close
- Down payment
- $31,225
- Closing costs
- $3,747
- Reserves months
- —
- Total cash needed
- —
Loan-product check · same deal, 3 products live
Conventional
25% down · 7.5% · 30yr
- Down + closing
- —
- Monthly P&I
- —
- Monthly cashflow
- —
- DSCR
- —
- Eligible?
- —
Personal DTI + credit; lowest rate.
DSCR
20% down · 8.5% · 30yr
- Down + closing
- —
- Monthly P&I
- —
- Monthly cashflow
- —
- DSCR
- —
- Eligible?
- —
No personal income docs; deal must DSCR.
Hard money
10% down · 12.0% · 12mo
- Down + closing
- —
- Monthly P&I
- —
- Monthly cashflow
- —
- DSCR
- —
- Eligible?
- —
Short-term bridge; refi at stabilization.
Rent comps 7 comps
| Address | Beds | Baths | Sqft | Rent | $/sqft | DOM | Units | Dist |
|---|---|---|---|---|---|---|---|---|
| 1908 Taft Ave NE Canton, OH | 2.0 | 1.0 | 633 | $925 | $1.46 | 45d | 1 | 0.38mi |
| 2103 Willowrow Ave NE Canton, OH | 3.0 | 1.0 | 850 | $1,000 | $1.18 | 15d | 1 | 0.76mi |
| 2321 Harmont Ave NE Canton, OH | 2.0 | 1.0 | 800 | $1,200 | $1.50 | 15d | 1 | 0.84mi |
| 1524 Parkhill Pl NE Canton, OH | 3.0 | 1.0 | 856 | $995 | $1.16 | 45d | 1 | 1.08mi |
| 1807 Spring Ave NE Canton, OH | 1.0–2.0 | 1.0 | 555 | $770 | $1.39 | 15d | 1 | 1.22mi |
| 1629 Spring Ave NE Unit Na Canton, OH | 2.0 | 1.0 | 1100 | $836 | $0.76 | 23d | 1 | 1.29mi |
| 123 17th St NW Canton, OH | 2.0 | 1.0–1.5 | 766 | $1,050 | $1.37 | 15d | 1 | 1.47mi |
Listing history 23 events
-
2026-06-18status $124,900 Pending 31 DOM
-
2026-06-18days on market $124,900 Active 31 DOM
-
2026-06-17days on market $124,900 Active 30 DOM
-
2026-06-16days on market $124,900 Active 29 DOM
-
2026-06-15days on market $124,900 Active 28 DOM
-
2026-06-14days on market $124,900 Active 26 DOM
-
2026-06-13days on market $124,900 Active 25 DOM
-
2026-06-10days on market $124,900 Active 23 DOM
-
2026-06-09days on market $124,900 Active 22 DOM
-
2026-06-08days on market $124,900 Active 21 DOM
-
2026-06-07days on market $124,900 Active 20 DOM
-
2026-06-05days on market $124,900 Active 17 DOM
-
2026-06-03days on market $124,900 Active 16 DOM
-
2026-06-02days on market $124,900 Active 15 DOM
-
2026-06-01days on market $124,900 Active 14 DOM
-
2026-05-31days on market $124,900 Active 13 DOM
-
2026-05-30days on market $124,900 Active 12 DOM
-
2026-05-18$124,900 Active
-
2024-12-31historical
-
2024-09-19price $119,900
-
2024-08-19$124,900 Active
-
1991-01-17soldstatus $17,000
-
1987-01-27soldstatus $11,700
ⓘ Source: listings_history table (triggers on properties + properties_extension) + one-shot
backfill from property_details.listing_events for pre-trigger history.
Tax reassessment forecast OH · Partial reset (capped growth)
- Current annual tax
- $869 · $72/mo
- Projected year-2 tax
- $1,409 · $117/mo
- Expected delta
- +$540/yr (+$45/mo · 62.1%)
ⓘ Screening estimate from a state-policy table — verify with the county assessor before closing.
Climate risk First Street
- Flood 5/10 Major FEMA zone X (unshaded) · 51% chance over 30 yrs
- Wildfire 1/10 Low
- Heat 3/10 Moderate 7 d/yr ≥96°F today · 17 d/yr by 30 yrs out
- Wind 1/10 Low
- Air quality 2/10 Low 1 unhealthy d/yr today · 2 by 30 yrs out
Nearby sold comps map
Loading sold comps map…
Walkable amenities ~0.75 mi
Loading nearby amenities…
Taxation est. · year 1
- Rental income
- $11,949
- − Mortgage interest
- −$6,996
- − Property taxes
- −$869
- − Insurance
- −$624
- − Repairs & maintenance
- −$956
- − Management
- −$956
- − Depreciation
- −$3,633
- Taxable loss
- −$2,086
- Est. tax savings @ 24.0%
- +$501
- After-tax cash flow
- $587/yr
For passive investors: Depreciation is non-cash, so a rental often shows a tax loss while cash-flowing — sheltering income. Rental losses are passive: they offset passive income freely, and up to $25,000/yr can offset ordinary (W-2) income if you actively participate and your MAGI is under $100k (phasing out to $0 by $150k); unused losses carry forward. On sale, claimed depreciation is recaptured at up to 25%, and gains may owe capital-gains tax (a 1031 exchange can defer both). Figures are a year-1 estimate at your 24.0% rate — not tax advice; consult a CPA.
Schools (NCES district)
- District
- Plain Local
- NCES district ID
- 3904993
- Math proficiency
- 61% ▼ -13.00%
- Reading proficiency
- 69% ▼ -5.00%
- Median HH income
- $48,337
- Composite
- 55.04/100
- National rank
- #1293
- State rank
- #216 of 656 in OH
Livability — Canton
- Score
- 71/100
- State rank
- #441
- US rank
- #7259
Category grades
Schools grade is shown separately in the Schools card above.
Census & demographics
- County
- Stark County · 272,865 people
- City population
- 103,614
- Metro
- Canton-Massillon, OH
- Population (ZIP)
- 16,872
- Household income
- $43,439
- Rent vs Own
- Severe rent burden
- 524.0
Population outlook (Stark County) Hauer SSP2
- Today (2025)
- 373,708 people
- By 2030
- 371,245 · -0.7%
- By 2040
- 361,331 · -3.3%
- By 2050
- 345,290 · -7.6%
- By 2075
- 302,669 · -19.0%
- By 2100
- 238,870 · -36.1%
Race, ethnicity, and origin ACS 2023
- Neighborhood character
- Diverse neighborhood (Simpson 0.60)
- Race & ethnicity
- White 58% Black 22% Two or more races 13% Hispanic / Latino 9%
- Hispanic origin (detail)
- Mexican 2% Puerto Rican 2%
- Common ancestry
- Italian 5% Romanian 4% Lithuanian 2%
- Foreign-born
- 3% · Canada
- Languages at home
- 97% English-only · Spanish 2% German/W. Germanic 1%
Political lean MEDSL · Stark
- 2024 margin
- Strong R (+21.9) · D 38.6% · R 60.5%
- 2008→2024 swing
- -27.4pp toward R · 2008: 5.5pp · 2024: -21.9pp
- All cycles
- 2024: R+21.9 2020: R+18.5 2016: R+17.4 2012: R+0.4 2008: D+5.5
Not yet ingested
- Civics
- —
Market trends
- HPI YoY
- ▼ -200.62%
- Current HPI
- 150.1531
- Rent YoY
- ▼ -0.23%
- Metro
- Canton-Massillon, OH
- State GDP YoY
- ▲ 1.98%
- F500 in state
- 48
Industry mix (Fortune 500 HQ in OH)
| Industry | F500 HQs | Revenue |
|---|---|---|
| Insurance | 3 | $145B |
|
||
| Industrial Machinery | 3 | $49B |
|
||
| Financial Services | 3 | $24B |
|
||
| Consumer Goods | 2 | $93B |
|
||
| Aerospace / Defense | 2 | $47B |
|
||
| Utilities | 2 | $33B |
|
||
Price history
+967.5% since first listed6 events — show timeline
- 2026-05-18 Listed $124,900 MLSNOW
- 2024-12-31 Listing Removed — MLSNOW
- 2024-09-19 Price Changed $119,900 MLSNOW
- 2024-08-19 Listed $124,900 MLSNOW
- 1991-01-17 Sold (Public Records) $17,000 Public Records
- 1987-01-27 Sold (Public Records) $11,700 Public Records
Property tax history
+13.3%/yrLatest (2024): $869 · +124.5% YoY. Source: county tax records.
Cash-flow waterfall
monthlySold comps — $/sqft
last 12 mo · ≤1 miLoading sold comps…