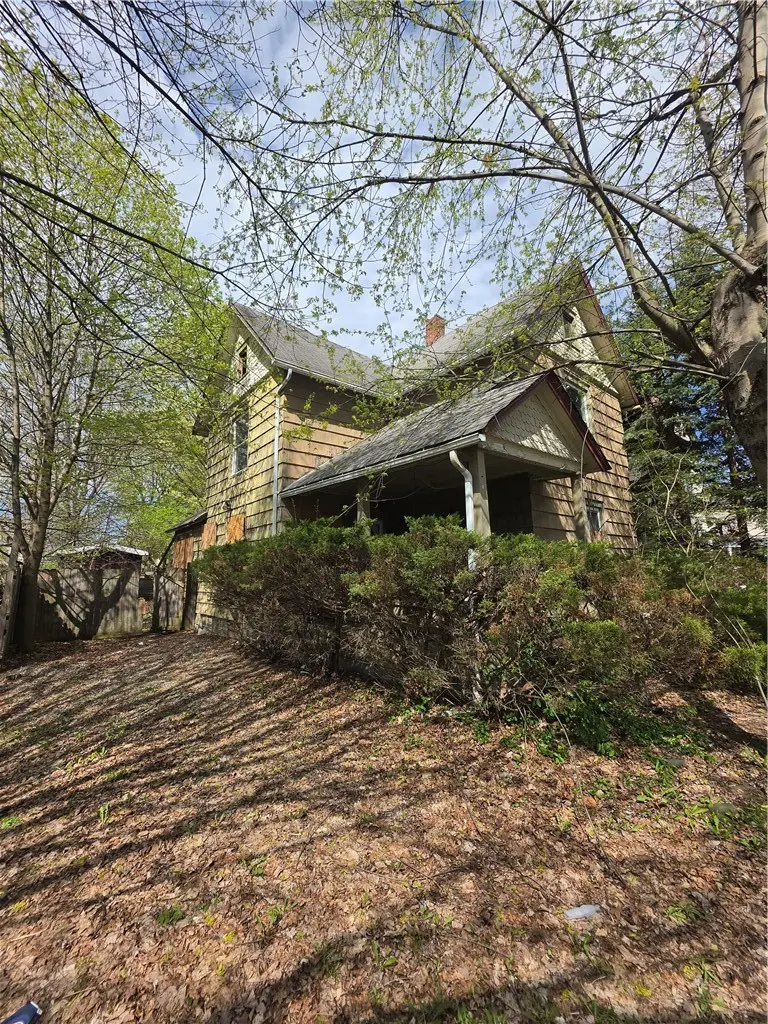
406 Jefferson St · Elmira, NY
Flood risk 5/10 · Moderate
- FEMA flood zone
- X
- Chance of flooding over 30 yrs
- 0.66%
- Est. flood insurance / yr
- $473 – $860
Fire risk 2/10 · Minimal
- Est. fire insurance / yr
- $691 – $1,283
Heat risk 3/10 · Minor
- Hot days now (above 97°F)
- 7 days/yr
- Hot days in 30 yrs
- 16 days/yr
Wind risk 2/10 · Minimal
- Chance of severe wind over 30 yrs
- 1.0%
Air-quality risk 1/10 · Minimal
- Unhealthy air days now
- 0 days/yr
- Unhealthy air days in 30 yrs
- 0 days/yr
Risk factors via First Street. Map © Google.
Why this score? — see what drove the B- grade
The composite is a weighted blend of 9 inputs, each scored 0–100. Each bar is that input's sub-score; the figure is the points it added to the 100-point composite (weight × sub-score).
- Cash flow +30.0/30.0
- 1% rule +10.0/10.0
- DSCR +10.0/10.0
- ARV discount +7.5/15.0
- Livability +3.1/5.0
- Rent growth +2.5/5.0
- Condition / age +2.5/5.0
- Schools +2.4/10.0
- Appreciation +0.0/10.0
$49,900
🖨 Deal sheet (PDF) 📄 Offer letter ✓ Due diligence
Listing remarks MLS
Looking for a project with potential? This 4-bedroom home is ready to be brought back to life and transformed into something truly special. With plenty of space to work with, it offers a great opportunity for investors or buyers ready to roll up their sleeves and make it their own. The home features washer and dryer hookups on the first floor, off-street parking, and a shed for extra storage. An additional lot is included, giving you even more room to expand, garden, or create your ideal outdoor space. With the right vision and a little TLC, this property could really shine!
Key facts
- Extra storage
- Additional lot
- Off-street parking
Tags
Neighborhood map
What this means for you Summary
Snapshot
- This is a 4-bed/1.0-bath single-family listed at $50k.
Deal economics
- At list price, monthly cash flow is $702 ($8k/yr) — positive.
- The deal already cash-flows at list — no discount required.
- Meets the 1% rule at list price ($1k rent vs $50k).
- Recommended offer: $48k (3.0% below list) — sets the bar for market timing.
- Cap rate 23.2% vs local median 10.1% in Elmira — top-decile yield for the area; either an underpriced asset or a hidden risk that comps aren't pricing in. Stress-test before assuming the spread holds.
Location & tenants
- Location reads 62/100 on livability (#832 in NY) — a middle-class / working-renter tenant base. Strengths: cost of living A+, housing A+, health & safety A+; Watch: schools F, crime F, amenities F.
- Elmira City School District (urban): math 23% / reading 35% proficiency, ranked #580 of 590 in NY (top 98%) — low school quality limits family demand, transient renter base, plan for 1-2y turnover.
- Market conditions: 101 active listings in the ZIP; 4 comparable units currently listed for rent nearby; rentals lingering (median 45d on market — plan ~5-8 weeks vacancy on turnover, expect pricing pressure); 100% of comp listings sitting > 30 days — soft ceiling on asking rent; 91 units permitted in Chemung County in 2024 (63 in 5+ unit buildings).
Forward outlook
- Local home prices are declining (-3.0%/yr); year-one equity from $345 of loan paydown is wiped out by about $1k of value loss. Plan a longer hold.
- Chemung County population projected at -17% by 2050 — secular population decline; favor cash flow + early exit over multi-decade hold.
- At projected returns (-3.0% appreciation + 3.0% rent growth), your $14k cash investment doubles in ~2 years — after that, you're playing with house money.
Negotiation context
- It's been on market 59 days — a 3% lower offer ($48k) is reasonable based on typical stale-listing flexibility.
- 2 sale attempts since 24y ago; this cycle's ask has dropped $15k (23%) from the opening price — seller is motivated, your offer sets the floor, not the list.
- Current owner paid $36k; 39% above their basis — modest negotiation headroom, anchor on the comps not their cost.
Risks & watch-outs
- Watch-outs: built in 1880 — expect roof / HVAC / electrical / plumbing capex.
- Climate carrying-cost: moderate flood risk — expect insurance premiums to compound above CPI over the hold.
Questions for the listing agent
- It's been on market 59 days. Have you received any prior offers? Is the seller open to a 3% concession, seller financing, or rate buy-down credit?
- Built in 1880 — when were the roof, HVAC, electrical panel, plumbing, and water heater last replaced?
- Is there a deadline driving the sale (1031 exchange, divorce, estate, relocation)? That informs how much negotiation room exists.
- Schools are F-rated, which usually means shorter tenancies and higher turnover. Who's the typical renter profile here, and what's been the actual vacancy rate?
- Crime grade is F in this area — have there been break-ins, vandalism, or insurance claims at this property in the last 3 years? What carrier currently insures it and at what premium?
- What's the average days-on-market for RENTAL listings here right now (not sales)? A rising rental-DOM trend means longer vacancies and softer asking-rent achievability than the comps imply.
- What's the recent tenant-quality profile in this submarket — average credit score on applications, eviction rate, late-payment / NSF rate, and stable-employment percentage? A property-management company in the area should have these aggregated.
- How much new for-sale + rental construction is in the pipeline within 1–3 miles? Heavy new supply typically softens prices + rents 12–24 months out; constrained supply supports both.
Investment metrics
- 1% rule
- 2.66% ✓
- Cap rate
- 23.18%
- Cash-on-cash
- 60.31%
- DSCR
- 3.68
- GRM
- 3.1
CMA / ARV
- ARV (median comp)
- $107,398
- List price
- $49,900
- Delta
- -53.54%
- Verdict
- UNDERPRICED
- Comps
- 20 within 1.0 mi
Show comp detail 12 sales within ~0.75 mi
| Address | Dist | Beds/Ba | Sqft | Sold | Price | $/sf | Match |
|---|---|---|---|---|---|---|---|
| 558 Coburn St | 0.15mi | 4/1.5 | 1,716 (+3%) | 0mo | $125,020 | $73 | 86 |
| 421 Jefferson St | 0.08mi | 3/1.5 (-1) | 1,688 (+1%) | 5mo | $85,106 | $50 | 84 |
| 507 Partridge St | 0.19mi | 3/1.5 (-1) | 1,592 (-5%) | 3mo | $106,500 | $67 | 74 |
| 478 Mount Zoar St | 0.07mi | 4/1.0 | 1,456 (-13%) | 2mo | $35,000 | $24 | 74 |
| 309 Broadway St | 0.21mi | 4/1.0 | 1,468 (-12%) | 3mo | $78,000 | $53 | 67 |
| 631 Pennsylvania Ave | 0.46mi | 4/1.0 | 1,787 (+7%) | 2mo | $67,000 | $37 | 66 |
| 551 Lyon St | 0.42mi | 3/1.0 (-1) | 1,586 (-5%) | 3mo | $158,000 | $100 | 65 |
| 413 West Hudson St | 0.32mi | 4/1.5 | 1,888 (+13%) | 1mo | $45,000 | $24 | 60 |
| 254 South Ave | 0.34mi | 3/1.5 (-1) | 1,828 (+9%) | 2mo | $109,000 | $60 | 60 |
| 777 Pennsylvania Ave | 0.70mi | 4/1.5 | 1,620 (-3%) | 6mo | $110,000 | $68 | 55 |
| 55 Hoffman St | 0.69mi | 5/1.5 (+1) | 1,785 (+7%) | 0mo | $115,000 | $64 | 49 |
| 714 Pennsylvania Ave | 0.58mi | 3/1.5 (-1) | 1,906 (+14%) | 2mo | $169,000 | $89 | 41 |
Match score weights: distance 35% · size 25% · config 20% · recency 20%. Top-matched comps best support the ARV.
Projected returns pro-forma
-3.0% appreciation · 3.0% rent growth · sell at horizon
- IRR
- 59.1%
- Equity multiple
- 3.62×
- Total profit
- $36,657
- Equity at exit
- $7,440
- IRR
- 63.8%
- Equity multiple
- 7.41×
- Total profit
- $89,590
- Equity at exit
- $4,314
Cash invested: $13,972 (down + closing). Projections, not guarantees.
Landlord ↔ Tenant lean methodology
- Overall (STATE)
- 15 Strongly Tenant-Friendly
- State New York
- 15 Strongly Tenant-Friendly · D+10
- County
- — inherits STATE
- City
- — inherits STATE
ZIP-level market 14904
- Home prices YoY
- -9.6%
- Active inventory
- 101
- Price-to-rent
- 3.1×
Monthly cashflow live
- Estimated rent
- $1,325 medium interval (Pro) →
- Mortgage (P&I)
- −$262
- Tax est. 1.5%
- −$62 /mo · $748/yr
- Insurance
- −$21
- HOA
- −$0
- Vacancy / Maint / Mgmt
- −$278
- Net cashflow
- $702
Break-even live
Sensitivity live
| Price | -10% $737 | -5% $719 | +0% $702 | +5% $685 | +10% $668 |
|---|---|---|---|---|---|
| Rent | -10% $597 | -5% $650 | +0% $702 | +5% $755 | +10% $807 |
| Rate | -1.0pp $727 | -0.5pp $715 | base $702 | +0.5pp $689 | +1.0pp $676 |
UW: 25.0% down · 7.5% · 30yr · 1.5% tax · 5.0% vac · 8.0% maint · 8.0% mgmt
Financing live
Cash to close
- Down payment
- $12,475
- Closing costs
- $1,497
- Reserves months
- —
- Total cash needed
- —
Loan-product check · same deal, 3 products live
Conventional
25% down · 7.5% · 30yr
- Down + closing
- —
- Monthly P&I
- —
- Monthly cashflow
- —
- DSCR
- —
- Eligible?
- —
Personal DTI + credit; lowest rate.
DSCR
20% down · 8.5% · 30yr
- Down + closing
- —
- Monthly P&I
- —
- Monthly cashflow
- —
- DSCR
- —
- Eligible?
- —
No personal income docs; deal must DSCR.
Hard money
10% down · 12.0% · 12mo
- Down + closing
- —
- Monthly P&I
- —
- Monthly cashflow
- —
- DSCR
- —
- Eligible?
- —
Short-term bridge; refi at stabilization.
Rent comps 4 comps
| Address | Beds | Baths | Sqft | Rent | $/sqft | DOM | Units | Dist |
|---|---|---|---|---|---|---|---|---|
| 363 W Water St #2 Elmira, NY | 3.0 | 1.0 | 1084 | $1,250 | $1.15 | 44d | 1 | 0.59mi |
| 514 W 1st St Unit A Elmira, NY | 4.0 | 1.0 | 1416 | $1,275 | $0.90 | 44d | 1 | 0.80mi |
| 106 W 2nd St Unit A Elmira, NY | 3.0 | 1.0 | 1395 | $1,400 | $1.00 | 44d | 1 | 0.98mi |
| 355 W Clinton St Unit 1 Elmira, NY | 3.0 | 1.5 | 1650 | $1,400 | $0.85 | 44d | 1 | 1.01mi |
Listing history 24 events
-
2026-06-19days on market $49,900 Active 59 DOM
-
2026-06-18days on market $49,900 Active 58 DOM
-
2026-06-17days on market $49,900 Active 57 DOM
-
2026-06-16days on market $49,900 Active 56 DOM
-
2026-06-15days on market $49,900 Active 55 DOM
-
2026-06-14days on market $49,900 Active 53 DOM
-
2026-06-12remarks 582-char remark
-
2026-06-12pricedays on market $49,900 Active 52 DOM
-
2026-06-09days on market $65,000 Active 49 DOM
-
2026-06-08days on market $65,000 Active 48 DOM
-
2026-06-07days on market $65,000 Active 47 DOM
-
2026-06-05days on market $65,000 Active 44 DOM
-
2026-06-03days on market $65,000 Active 43 DOM
-
2026-06-02days on market $65,000 Active 42 DOM
-
2026-06-01days on market $65,000 Active 41 DOM
-
2026-05-31days on market $65,000 Active 40 DOM
-
2026-05-30days on market $65,000 Active 39 DOM
-
2026-04-21$65,000 Active 581-char remark
Show marketing remark (581 chars)
Looking for a project with potential? This 4-bedroom home is ready to be brought back to life and transformed into something truly special. With plenty of space to work with, it offers a great opportunity for investors or buyers ready to roll up their sleeves and make it their own. The home features washer and dryer hookups on the first floor, off-street parking, and a shed for extra storage. An additional lot is included, giving you even more room to expand, garden, or create your ideal outdoor space. With the right vision and a little TLC, this property could really shine!
-
2016-03-10soldstatus $36,000
-
2002-08-23soldstatus $42,177
-
2002-08-23soldstatus $12,500
-
2002-07-31soldstatus $12,500 156-char remark
Show marketing remark (156 chars)
HOUSE IS TO BE SOLD IN 'AS IS' CONDITION- NO EXCEP TIONS. CONTRACT AVAILABLE AT LISTER. COMMISSION $2500 SPLIT 50/50, PLUS $1000 BONUS TO THE SELLING AGENT.
-
2002-06-07$13,500 156-char remark
Show marketing remark (156 chars)
HOUSE IS TO BE SOLD IN 'AS IS' CONDITION- NO EXCEP TIONS. CONTRACT AVAILABLE AT LISTER. COMMISSION $2500 SPLIT 50/50, PLUS $1000 BONUS TO THE SELLING AGENT.
-
2000-04-21soldstatus $45,000
ⓘ Source: listings_history table (triggers on properties + properties_extension) + one-shot
backfill from property_details.listing_events for pre-trigger history.
Climate risk First Street
- Flood 5/10 Major FEMA zone X · 66% chance over 30 yrs
- Wildfire 2/10 Low
- Heat 3/10 Moderate 7 d/yr ≥97°F today · 16 d/yr by 30 yrs out
- Wind 2/10 Low 100% chance of damaging wind over 30 yrs
- Air quality 1/10 Low 0 unhealthy d/yr today · 0 by 30 yrs out
Nearby sold comps map
Loading sold comps map…
Walkable amenities ~0.75 mi
Loading nearby amenities…
Taxation est. · year 1
- Rental income
- $15,904
- − Mortgage interest
- −$2,795
- − Property taxes
- −$748
- − Insurance
- −$250
- − Repairs & maintenance
- −$1,272
- − Management
- −$1,272
- − Depreciation
- −$1,452
- Taxable income
- $8,115
- Est. tax owed @ 24.0%
- −$1,948
- After-tax cash flow
- $6,479/yr
For passive investors: Depreciation is non-cash, so a rental often shows a tax loss while cash-flowing — sheltering income. Rental losses are passive: they offset passive income freely, and up to $25,000/yr can offset ordinary (W-2) income if you actively participate and your MAGI is under $100k (phasing out to $0 by $150k); unused losses carry forward. On sale, claimed depreciation is recaptured at up to 25%, and gains may owe capital-gains tax (a 1031 exchange can defer both). Figures are a year-1 estimate at your 24.0% rate — not tax advice; consult a CPA.
Schools (NCES district)
- District
- Elmira City School District
- NCES district ID
- 3610560
- Math proficiency
- 23% ▼ -7.00%
- Reading proficiency
- 35% ▲ 7.00%
- Median HH income
- $40,180
- Composite
- 24.39/100
- National rank
- #7688
- State rank
- #580 of 590 in NY
Livability — Elmira
- Score
- 62/100
- State rank
- #832
- US rank
- #16139
Category grades
Schools grade is shown separately in the Schools card above.
Census & demographics
- Census place
- Elmira, NY
- City population
- 14,276
- Population (ZIP)
- 14,276
Population outlook (Chemung County) Hauer SSP2
- Today (2025)
- 82,931 people
- By 2030
- 80,356 · -3.1%
- By 2040
- 74,745 · -9.9%
- By 2050
- 69,012 · -16.8%
- By 2075
- 55,689 · -32.8%
- By 2100
- 41,428 · -50.0%
Race, ethnicity, and origin ACS 2023
- Neighborhood character
- Predominantly White (83%)
- Race & ethnicity
- White 83% Two or more races 7% Black 7% Hispanic / Latino 5% Native American 1%
- Common ancestry
- Romanian 7% Lithuanian 3% Slovak 2%
- Foreign-born
- 2% · Canada, Jamaica, Dominican Republic
- Languages at home
- 97% English-only · Spanish 2%
Political lean MEDSL · Chemung
- 2024 margin
- R (+16.8) · D 41.6% · R 58.4%
- 2008→2024 swing
- -15.6pp toward R · 2008: -1.2pp · 2024: -16.8pp
- All cycles
- 2024: R+16.8 2020: R+13.4 2016: R+20.0 2012: R+2.9 2008: R+1.2
Not yet ingested
- Civics
- —
Market trends
- HPI YoY
- ▼ -23.33%
- Current HPI
- 220.688
- Rent YoY
- —
- Metro
- —
- State GDP YoY
- ▲ 2.60%
- F500 in state
- 92
Industry mix (Fortune 500 HQ in NY)
| Industry | F500 HQs | Revenue |
|---|---|---|
| Financial Services | 10 | $950B |
|
||
| Consumer Goods | 9 | $162B |
|
||
| Insurance | 4 | $225B |
|
||
| Telecommunications | 2 | $144B |
|
||
| Pharmaceuticals | 2 | $112B |
|
||
| Media / Entertainment | 2 | $69B |
|
||
Price history
+44.4% since first listed7 events — show timeline
- 2026-04-21 Listed $65,000 UNYREIS
- 2016-03-10 Sold (Public Records) $36,000 Public Records
- 2002-08-23 Sold (Public Records) $12,500 Public Records
- 2002-08-23 Sold (Public Records) $42,177 Public Records
- 2002-07-31 Sold (MLS) $12,500 UNYREIS
- 2002-06-07 Listed $13,500 UNYREIS
- 2000-04-21 Sold (Public Records) $45,000 Public Records
Property tax history
+19.4%/yrLatest (2025): $2,860 · -12.9% YoY. Source: county tax records.
Cash-flow waterfall
monthlySold comps — $/sqft
last 12 mo · ≤1 miLoading sold comps…