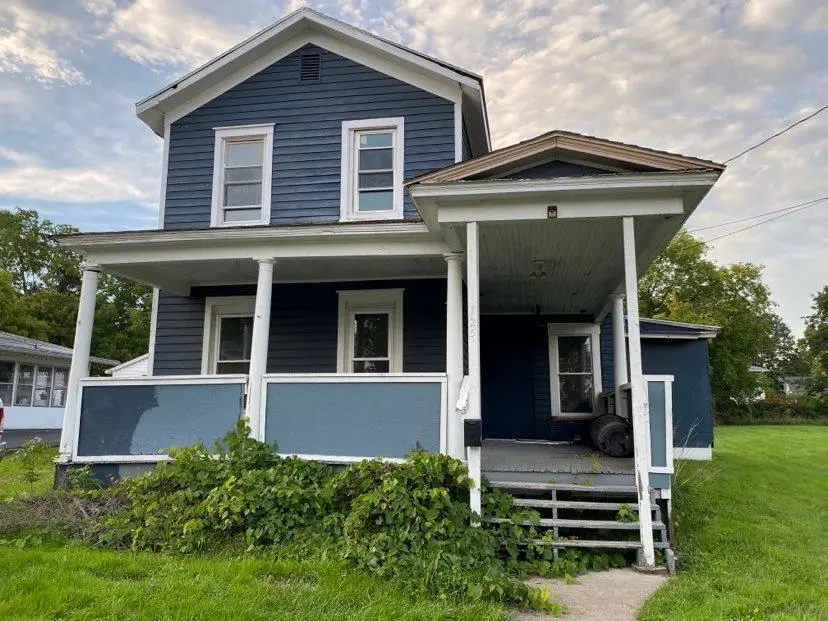
125 Providence St · Waverly, NY
Flood risk 1/10 · Minimal
- FEMA flood zone
- X (unshaded)
- Chance of flooding over 30 yrs
- 0.0%
- Est. flood insurance / yr
- $507 – $1,088
Fire risk 1/10 · Minimal
- Est. fire insurance / yr
- $691 – $1,283
Heat risk 3/10 · Minor
- Hot days now (above 96°F)
- 7 days/yr
- Hot days in 30 yrs
- 15 days/yr
Wind risk 2/10 · Minimal
- Chance of severe wind over 30 yrs
- 1.0%
Air-quality risk 2/10 · Minimal
- Unhealthy air days now
- 0 days/yr
- Unhealthy air days in 30 yrs
- 1 days/yr
Risk factors via First Street. Map © Google.
Why this score? — see what drove the C- grade
The composite is a weighted blend of 9 inputs, each scored 0–100. Each bar is that input's sub-score; the figure is the points it added to the 100-point composite (weight × sub-score).
- Cash flow +15.0/30.0
- ARV discount +7.5/15.0
- Appreciation +6.4/10.0
- 1% rule +5.0/10.0
- DSCR +5.0/10.0
- Schools +3.7/10.0
- Livability +3.4/5.0
- Rent growth +2.5/5.0
- Condition / age +2.5/5.0
$28,000
🖨 Deal sheet 📄 Offer letter ✓ Due diligence
Listing remarks MLS
Investment opportunity! This 4 bedroom home comes with a vacant lot. Over 1/2 acre in town. Endless possibilities. Some of the work has been done. Furnace works, new bilco doors. Sold as-is and priced to sell.
Key facts
- 0.3 acre lot
- Garage
- Built 1890
Neighborhood map
What this means for you Summary
Snapshot
- This is a 4-bed/1.5-bath single-family listed at $28k.
Deal economics
- At list price, monthly cash flow is $879 ($11k/yr) — positive.
- The deal already cash-flows at list — no discount required.
- Meets the 1% rule at list price ($1k rent vs $28k).
- Cap rate 44.0% vs local median 4.6% in Waverly — top-decile yield for the area; either an underpriced asset or a hidden risk that comps aren't pricing in. Stress-test before assuming the spread holds.
Location & tenants
- Location reads 67/100 on livability (#569 in NY) — a middle-class / working-renter tenant base. Strengths: cost of living A+, housing A+, health & safety A; Watch: amenities F, commute F, employment F.
- Waverly Central School District (town): math 41% / reading 46% proficiency, ranked #480 of 590 in NY (top 81%) — families likely to look elsewhere, expect single-tenant / working-renter base with shorter leases.
- Market conditions: 53 active listings in the ZIP; 139 units permitted in Tioga County in 2024 (65 in 5+ unit buildings).
Forward outlook
- In year one you build about $972 of equity ($194 loan paydown + $778 appreciation (2.8% local appreciation)).
- Tioga County population projected at -27% by 2050 — secular population decline; favor cash flow + early exit over multi-decade hold.
- At projected returns (2.8% appreciation + 3.0% rent growth), your $8k cash investment doubles in ~1 year — after that, you're playing with house money.
Negotiation context
- Only 0 days on market — expect competitive offers; lowballing is unlikely to land.
- 4 sale attempts since 7y ago; this cycle's ask has dropped $12k (29%) from the opening price — seller is motivated, your offer sets the floor, not the list.
- Current owner paid $19k; 47% above their basis — modest negotiation headroom, anchor on the comps not their cost.
Risks & watch-outs
- Watch-outs: built in 1890 — expect roof / HVAC / electrical / plumbing capex.
Questions for the listing agent
- Built in 1890 — when were the roof, HVAC, electrical panel, plumbing, and water heater last replaced?
- Is there a deadline driving the sale (1031 exchange, divorce, estate, relocation)? That informs how much negotiation room exists.
- What's the average days-on-market for RENTAL listings here right now (not sales)? A rising rental-DOM trend means longer vacancies and softer asking-rent achievability than the comps imply.
- What's the recent tenant-quality profile in this submarket — average credit score on applications, eviction rate, late-payment / NSF rate, and stable-employment percentage? A property-management company in the area should have these aggregated.
- How much new for-sale + rental construction is in the pipeline within 1–3 miles? Heavy new supply typically softens prices + rents 12–24 months out; constrained supply supports both.
Investment metrics
- 1% rule
- 4.85% ✓
- Cap rate
- 43.98%
- Cash-on-cash
- 134.61%
- DSCR
- 6.99
- GRM
- 1.7
CMA / ARV
- ARV (on-the-fly)
- $173,144
- Comps found
- 12
Show comp detail 12 sales within ~0.75 mi
| Address | Dist | Beds/Ba | Sqft | Sold | Price | $/sf | Match |
|---|---|---|---|---|---|---|---|
| 110 1/2 Providence St | 0.08mi | 3/1.5 (-1) | 1,634 (-13%) | 2mo | $120,000 | $73 | 68 |
| 12 Tioga | 0.29mi | 3/2.5 (-1) | 1,872 (-0%) | 13mo | $180,000 | $96 | 66 |
| 446 Pennsylvania Ave | 0.13mi | 4/1.5 | 2,151 (+14%) | 6mo | $140,000 | $65 | 65 |
| 536 Fulton St | 0.59mi | 3/1.5 (-1) | 1,844 (-2%) | 4mo | $135,000 | $73 | 61 |
| 431 Loder St | 0.51mi | 3/1.5 (-1) | 1,874 (-0%) | 15mo | $75,000 | $40 | 58 |
| 214 William St | 0.36mi | 3/2.5 (-1) | 1,780 (-5%) | 16mo | $195,000 | $110 | 52 |
| 2473 Pennsylvania Ave | 0.49mi | 3/1.5 (-1) | 1,791 (-5%) | 16mo | $240,000 | $134 | 50 |
| 20 Court St | 0.70mi | 4/1.0 | 1,688 (-10%) | 3mo | $265,000 | $157 | 46 |
| 32 Lyman Ave | 0.55mi | 3/1.0 (-1) | 2,066 (+10%) | 12mo | $175,000 | $85 | 41 |
| 434 Clark St | 0.44mi | 4/2.0 | 2,136 (+14%) | 16mo | $176,600 | $83 | 41 |
| 35 Broad Ave | 0.70mi | 3/1.0 (-1) | 1,680 (-11%) | 6mo | $242,000 | $144 | 37 |
| 374 Loder St | 0.68mi | 3/1.5 (-1) | 1,632 (-13%) | 16mo | $150,000 | $92 | 28 |
Match score weights: distance 35% · size 25% · config 20% · recency 20%. Top-matched comps best support the ARV.
Projected returns pro-forma
2.78% appreciation · 3.0% rent growth · sell at horizon
- IRR
- —
- Equity multiple
- 8.54×
- Total profit
- $59,080
- Equity at exit
- $12,242
- IRR
- —
- Equity multiple
- 17.87×
- Total profit
- $132,260
- Equity at exit
- $18,600
Cash invested: $7,840 (down + closing). Projections, not guarantees.
Landlord ↔ Tenant lean methodology
- Overall (STATE)
- 15 Strongly Tenant-Friendly
- State New York
- 15 Strongly Tenant-Friendly · D+10
- County
- — inherits STATE
- City
- — inherits STATE
ZIP-level market 14892
- Home prices YoY
- 1.2%
- Active inventory
- 53
- Price-to-rent
- 1.7×
Monthly cashflow live
- Estimated rent
- $1,358 medium interval (Pro) →
- Mortgage (P&I)
- −$147
- Tax est. 1.5%
- −$35 /mo · $420/yr
- Insurance
- −$12
- HOA
- −$0
- Vacancy / Maint / Mgmt
- −$285
- Net cashflow
- $879
Break-even live
UW: 25.0% down · 7.5% · 30yr · 1.5% tax · 5.0% vac · 8.0% maint · 8.0% mgmt
Financing live
Cash to close
- Down payment
- $7,000
- Closing costs
- $840
- Reserves months
- —
- Total cash needed
- —
Loan-product check · same deal, 3 products live
Conventional
25% down · 7.5% · 30yr
- Down + closing
- —
- Monthly P&I
- —
- Monthly cashflow
- —
- DSCR
- —
- Eligible?
- —
Personal DTI + credit; lowest rate.
DSCR
20% down · 8.5% · 30yr
- Down + closing
- —
- Monthly P&I
- —
- Monthly cashflow
- —
- DSCR
- —
- Eligible?
- —
No personal income docs; deal must DSCR.
Hard money
10% down · 12.0% · 12mo
- Down + closing
- —
- Monthly P&I
- —
- Monthly cashflow
- —
- DSCR
- —
- Eligible?
- —
Short-term bridge; refi at stabilization.
Listing history 9 events
-
2023-06-14historical
-
2023-02-13soldstatus $19,000 209-char remark
Show marketing remark (209 chars)
Investment opportunity! This 4 bedroom home comes with a vacant lot. Over 1/2 acre in town. Endless possibilities. Some of the work has been done. Furnace works, new bilco doors. Sold as-is and priced to sell.
-
2022-09-24$28,000
Show marketing remark (209 chars)
Investment opportunity! This 4 bedroom home comes with a vacant lot. Over 1/2 acre in town. Endless possibilities. Some of the work has been done. Furnace works, new bilco doors. Sold as-is and priced to sell.
-
2022-09-24$39,500 209-char remark
Show marketing remark (209 chars)
Investment opportunity! This 4 bedroom home comes with a vacant lot. Over 1/2 acre in town. Endless possibilities. Some of the work has been done. Furnace works, new bilco doors. Sold as-is and priced to sell.
-
2020-03-25historical
-
2020-01-26$39,900
-
2019-12-06historical
-
2019-06-06$44,900
-
2000-03-09soldstatus $19,000
ⓘ Source: listings_history table (triggers on properties + properties_extension) + one-shot
backfill from property_details.listing_events for pre-trigger history.
Climate risk First Street
- Flood 1/10 Low FEMA zone X (unshaded) · 0% chance over 30 yrs
- Wildfire 1/10 Low
- Heat 3/10 Moderate 7 d/yr ≥96°F today · 15 d/yr by 30 yrs out
- Wind 2/10 Low 100% chance of damaging wind over 30 yrs
- Air quality 2/10 Low 0 unhealthy d/yr today · 1 by 30 yrs out
Nearby sold comps map
Loading sold comps map…
Walkable amenities ~0.75 mi
Loading nearby amenities…
Taxation est. · year 1
- Rental income
- $16,298
- − Mortgage interest
- −$1,568
- − Property taxes
- −$420
- − Insurance
- −$140
- − Repairs & maintenance
- −$1,304
- − Management
- −$1,304
- − Depreciation
- −$815
- Taxable income
- $10,747
- Est. tax owed @ 24.0%
- −$2,579
- After-tax cash flow
- $7,974/yr
For passive investors: Depreciation is non-cash, so a rental often shows a tax loss while cash-flowing — sheltering income. Rental losses are passive: they offset passive income freely, and up to $25,000/yr can offset ordinary (W-2) income if you actively participate and your MAGI is under $100k (phasing out to $0 by $150k); unused losses carry forward. On sale, claimed depreciation is recaptured at up to 25%, and gains may owe capital-gains tax (a 1031 exchange can defer both). Figures are a year-1 estimate at your 24.0% rate — not tax advice; consult a CPA.
Schools (NCES district)
- District
- Waverly Central School District
- NCES district ID
- 3630270
- Math proficiency
- 41% ▼ -4.00%
- Reading proficiency
- 46% ▲ 8.00%
- Median HH income
- $44,935
- Composite
- 36.9/100
- National rank
- #4544
- State rank
- #480 of 590 in NY
Livability — Waverly
- Score
- 67/100
- State rank
- #569
- US rank
- #10246
Category grades
Schools grade is shown separately in the Schools card above.
Census & demographics
- Census place
- Waverly, NY
- Population (ZIP)
- 7,531
Population outlook (Tioga County) Hauer SSP2
- Today (2025)
- 45,155 people
- By 2030
- 42,801 · -5.2%
- By 2040
- 37,960 · -15.9%
- By 2050
- 33,071 · -26.8%
- By 2075
- 24,144 · -46.5%
- By 2100
- 16,545 · -63.4%
Race, ethnicity, and origin ACS 2023
- Neighborhood character
- Predominantly White (93%)
- Race & ethnicity
- White 93% Hispanic / Latino 2% Two or more races 2% Black 1% Asian 1%
- Common ancestry
- Iranian 3% Romanian 3% Italian 2%
- Foreign-born
- 2%
- Languages at home
- 98% English-only · German/W. Germanic 1% Tagalog/Filipino 1%
Political lean MEDSL · Tioga
- 2024 margin
- Strong R (+22.9) · D 38.6% · R 61.4%
- 2008→2024 swing
- -12.7pp toward R · 2008: -10.2pp · 2024: -22.9pp
- All cycles
- 2024: R+22.9 2020: R+20.6 2016: R+27.6 2012: R+15.1 2008: R+10.2
Not yet ingested
- Civics
- —
Market trends
- HPI YoY
- ▲ 2.78%
- Current HPI
- 236.7714
- Rent YoY
- —
- Metro
- —
- State GDP YoY
- ▲ 2.60%
- F500 in state
- 92
Industry mix (Fortune 500 HQ in NY)
| Industry | F500 HQs | Revenue |
|---|---|---|
| Financial Services | 10 | $950B |
|
||
| Consumer Goods | 9 | $162B |
|
||
| Insurance | 4 | $225B |
|
||
| Telecommunications | 2 | $144B |
|
||
| Pharmaceuticals | 2 | $112B |
|
||
| Media / Entertainment | 2 | $69B |
|
||
Price history
+0.0% since first listed9 events — show timeline
- 2023-06-14 Delisted — NMPA
- 2023-02-13 Sold (MLS) $19,000 UNYREIS
- 2022-09-24 Listed $39,500 UNYREIS
- 2022-09-24 Listed $28,000 NMPA
- 2020-03-25 Listing Removed — UNYREIS
- 2020-01-26 Listed $39,900 UNYREIS
- 2019-12-06 Listing Removed — UNYREIS
- 2019-06-06 Listed $44,900 UNYREIS
- 2000-03-09 Sold (Public Records) $19,000 Public Records
Property tax history
+5.7%/yrLatest (2025): $1,825 · +4.6% YoY. Source: county tax records.
Cash-flow waterfall
monthlySold comps — $/sqft
last 12 mo · ≤1 miLoading sold comps…