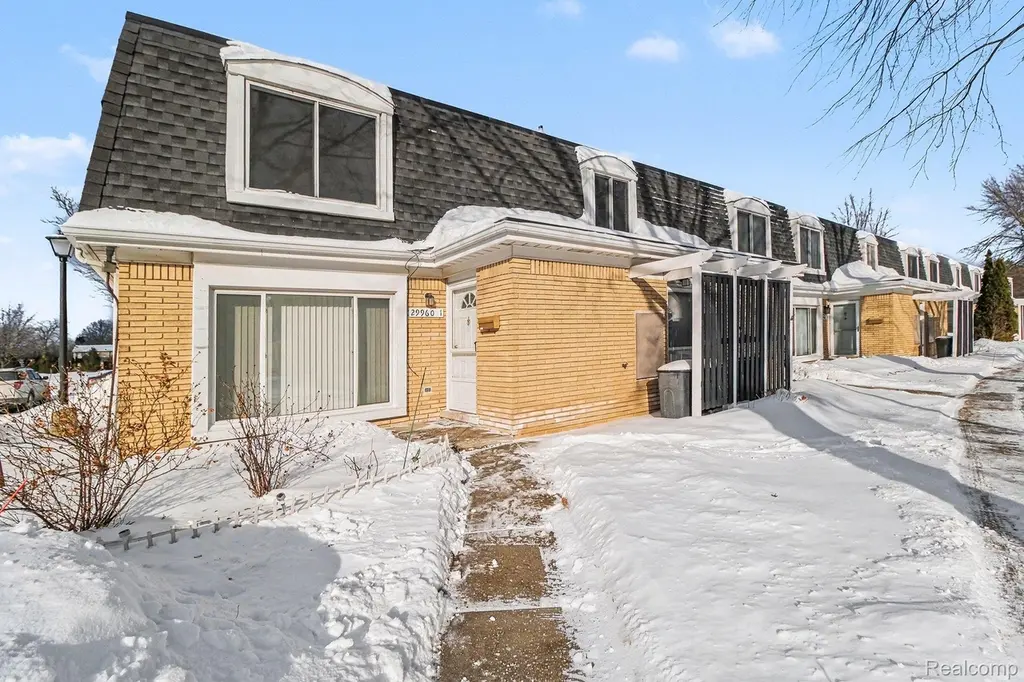
29960 City Center Dr #1 · Warren, MI
Flood risk 2/10 · Minimal
- FEMA flood zone
- X (unshaded)
- Chance of flooding over 30 yrs
- 0.09%
- Est. flood insurance / yr
- $507 – $1,088
Fire risk 1/10 · Minimal
- Est. fire insurance / yr
- $784 – $1,456
Heat risk 3/10 · Minor
- Hot days now (above 97°F)
- 7 days/yr
- Hot days in 30 yrs
- 15 days/yr
Wind risk 1/10 · Minimal
- Chance of severe wind over 30 yrs
- —
Air-quality risk 3/10 · Minor
- Unhealthy air days now
- 3 days/yr
- Unhealthy air days in 30 yrs
- 4 days/yr
Risk factors via First Street. Map © Google.
Why this score? — see what drove the D grade
The composite is a weighted blend of 9 inputs, each scored 0–100. Each bar is that input's sub-score; the figure is the points it added to the 100-point composite (weight × sub-score).
- Cash flow +13.7/30.0
- 1% rule +7.9/10.0
- ARV discount +6.7/15.0
- DSCR +4.1/10.0
- Livability +3.7/5.0
- Rent growth +3.1/5.0
- Schools +2.5/10.0
- Condition / age +2.5/5.0
- Appreciation +0.0/10.0
$129,900
🖨 Deal sheet (PDF) 📄 Offer letter ✓ Due diligence
Listing remarks MLS
PERFECTLY LOCATED !! 2 Bedroom, 1.5 Bath Condo. Spacious Living Room Open to Dining Area & Kitchen w/ Plenty of Cabinet Space & Pantry. Spacious Laundry Room & Half Bathroom off of Kitchen. Huge Primary Bedroom w/ Large Walk-In Closet. 2nd Bedroom & Full Bathroom Upstairs. Assigned Parking. Minutes to City Hall, GM Tech Center, Detroit Arsenal, Hospital & Cadillac Tower! Walking distance to Restaurants, Entertainment, Gyms, Shopping, Schools & Parks! HOA includes: Grounds Maintenance, Structure, Water, Snow Removal & Partial Electricity. Minutes to I-696.
Key facts
- Pantry
- Cabinet space
- Custom built ins
Tags
Neighborhood map
What this means for you Summary
Snapshot
- This is a 2-bed/1.5-bath condo listed at $130k.
Deal economics
- At list price, monthly cash flow is $10 ($120/yr) — positive.
- The deal already cash-flows at list — no discount required.
- Meets the 1% rule at list price ($2k rent vs $130k).
- Recommended offer: $118k (9.0% below list) — sets the bar for market timing.
- Cap rate 6.4% vs local median 5.2% in Warren — meaningfully above typical; check what's discounted (condition, days-on-market, listing class) to confirm the premium yield is real.
Location & tenants
- Location reads 74/100 on livability (#171 in MI, #4,491 nationally) — a middle-class / working-renter tenant base. Strengths: commute A+, cost of living A+, housing A+; Watch: amenities D, employment D, crime D-.
- Warren Consolidated Schools (urban): math 18% / reading 39% proficiency, ranked #373 of 540 in MI (top 69%) — low school quality limits family demand, transient renter base, plan for 1-2y turnover.
- Zoned schools: Cromie Elementary School (math 16% / reading 26%, grade F, #1,081 of 1,397 statewide, top 77%, 570 students, 74% FRL); Carter Middle School (math 15% / reading 40%, grade F, #363 of 493 statewide, top 75%, 684 students, 65% FRL); Cousino Senior High School (math 25% / reading 53%, grade F, #328 of 713 statewide, top 46%, 1,279 students, 56% FRL) — zoned schools average 65% FRL vs 48% district-wide (17 pts higher); higher-poverty schools than district average — tighter screening recommended.
- Market conditions: Rents rising (+2.5%/yr); 128 active listings in the ZIP; 10 comparable units currently listed for rent nearby; rentals leasing fast (median 7d on market — plan ~1-2 weeks tenant-placement turnaround); 1,321 units permitted in Macomb County in 2024 (86 in 5+ unit buildings).
Forward outlook
- Local home prices are declining (-3.0%/yr); year-one equity from $898 of loan paydown is wiped out by about $4k of value loss. Plan a longer hold.
- Macomb County population projected at +9% by 2050 — modest demand growth; plan on rents tracking national, not racing it.
Negotiation context
- It's been on market 118 days — a 9% lower offer ($118k) is reasonable based on typical stale-listing flexibility.
- 3 sale attempts with the ask held roughly flat each time — persistent listings suggest the price (not the market) is what's stuck; bring a comps-based counter.
- Current owner paid $89k; 46% above their basis — modest negotiation headroom, anchor on the comps not their cost.
Risks & watch-outs
- Watch-outs: HOA is 25% of rent.
Questions for the listing agent
- It's been on market 118 days. Have you received any prior offers? Is the seller open to a 9% concession, seller financing, or rate buy-down credit?
- Built in 1970 — when were the roof, HVAC, electrical panel, plumbing, and water heater last replaced?
- What does the HOA fee cover, when was the last increase, and are there any pending special assessments or reserve-fund shortfalls?
- Any open or pending special assessments — roof, HVAC, plumbing, elevator, façade? What's the per-unit balance and payoff schedule, and is the seller paying it off at close or rolling it to the buyer?
- Why hasn't it sold? Are there any deal-killer items the seller is aware of (foundation, flood, title, zoning, code violations)?
- Is there a deadline driving the sale (1031 exchange, divorce, estate, relocation)? That informs how much negotiation room exists.
- Schools are D-rated, which usually means shorter tenancies and higher turnover. Who's the typical renter profile here, and what's been the actual vacancy rate?
- Crime grade is D in this area — have there been break-ins, vandalism, or insurance claims at this property in the last 3 years? What carrier currently insures it and at what premium?
- The area grade is low — what's the realistic commute time and amenity access for the typical tenant pool here? Any planned neighborhood developments (good or bad) we should know about?
- What's the average days-on-market for RENTAL listings here right now (not sales)? A rising rental-DOM trend means longer vacancies and softer asking-rent achievability than the comps imply.
- What's the recent tenant-quality profile in this submarket — average credit score on applications, eviction rate, late-payment / NSF rate, and stable-employment percentage? A property-management company in the area should have these aggregated.
- How much new apartment / multifamily construction is in the pipeline within 1–3 miles? Heavy new supply (>2% of stock underway) typically softens rents 12–24 months out; light construction supports rent growth.
Investment metrics
- 1% rule
- 1.29% ✓
- Cap rate
- 6.39%
- Cash-on-cash
- 0.33%
- DSCR
- 1.01
- GRM
- 6.5
CMA / ARV
- ARV (median comp)
- $127,498
- List price
- $129,900
- Delta
- 1.88%
- Verdict
- FAIR
- Comps
- 20 within 1.0 mi
Projected returns pro-forma
-3.0% appreciation · 2.52% rent growth · sell at horizon
- IRR
- -16.3%
- Equity multiple
- 0.42×
- Total profit
- $-20,937
- Equity at exit
- $19,369
- IRR
- -8.8%
- Equity multiple
- 0.46×
- Total profit
- $-19,542
- Equity at exit
- $11,231
Cash invested: $36,372 (down + closing). Projections, not guarantees.
Landlord ↔ Tenant lean methodology
- Overall (STATE)
- 62 Landlord-Friendly
- State Michigan
- 62 Landlord-Friendly · EVEN
- County
- — inherits STATE
- City
- — inherits STATE
ZIP-level market 48093
- Rents YoY
- 2.5%
- Active inventory
- 128
- Price-to-rent
- 6.5×
Monthly cashflow live
- Estimated rent
- $1,678 high interval (Pro) →
- Mortgage (P&I)
- −$681
- Tax from tax record
- −$154 /mo · $1,852/yr
- Insurance
- −$54
- HOA
- −$426
- Vacancy / Maint / Mgmt
- −$352
- Net cashflow
- $10
Break-even live
Sensitivity live
| Price | -10% $84 | -5% $47 | +0% $10 | +5% $-27 | +10% $-64 |
|---|---|---|---|---|---|
| Rent | -10% $-123 | -5% $-56 | +0% $10 | +5% $76 | +10% $143 |
| Rate | -1.0pp $75 | -0.5pp $43 | base $10 | +0.5pp $-24 | +1.0pp $-58 |
UW: 25.0% down · 7.5% · 30yr · 1.5% tax · 5.0% vac · 8.0% maint · 8.0% mgmt
Financing live
Cash to close
- Down payment
- $32,475
- Closing costs
- $3,897
- Reserves months
- —
- Total cash needed
- —
Loan-product check · same deal, 3 products live
Conventional
25% down · 7.5% · 30yr
- Down + closing
- —
- Monthly P&I
- —
- Monthly cashflow
- —
- DSCR
- —
- Eligible?
- —
Personal DTI + credit; lowest rate.
DSCR
20% down · 8.5% · 30yr
- Down + closing
- —
- Monthly P&I
- —
- Monthly cashflow
- —
- DSCR
- —
- Eligible?
- —
No personal income docs; deal must DSCR.
Hard money
10% down · 12.0% · 12mo
- Down + closing
- —
- Monthly P&I
- —
- Monthly cashflow
- —
- DSCR
- —
- Eligible?
- —
Short-term bridge; refi at stabilization.
Rent comps 10 comps
| Address | Beds | Baths | Sqft | Rent | $/sqft | DOM | Units | Dist |
|---|---|---|---|---|---|---|---|---|
| 11116 Racine Rd Warren, MI | 3.0 | 1.5 | 1433 | $2,000 | $1.40 | 0d | 1 | 0.29mi |
| 8457 Towne Center Cir Unit 90 Warren, MI | 2.0 | 2.0 | 1319 | $1,800 | $1.36 | 45d | 1 | 0.32mi |
| 8459 Towne Center Cir N #96 Warren, MI | 2.0 | 2.5 | 1646 | $2,000 | $1.22 | 0d | 1 | 0.33mi |
| 29400 Towne Center Cir Warren, MI | 1.0–3.0 | 1.0–2.0 | 1114 | $1,749 | $1.57 | 0d | 1 | 0.34mi |
| 8429 Towne Center Cir S #52 Warren, MI | 2.0 | 2.0 | 1240 | $1,775 | $1.43 | 26d | 1 | 0.37mi |
| 29250 Longview Ave Apt 14 Warren, MI | 2.0 | 1.0 | 950 | $1,000 | $1.05 | 45d | 1 | 0.41mi |
| 31727 Hoover Rd Unit 21 Warren, MI | 2.0 | 1.0 | 900 | $1,395 | $1.55 | 6d | 1 | 1.02mi |
| 28801 Imperial Dr Warren, MI | 1.0–2.0 | 1.0 | 887 | $1,205 | $1.36 | 18d | 6 | 1.05mi |
| 28250 Hoover Rd Warren, MI | 1.0–2.0 | 1.0–2.0 | 912 | $1,640 | $1.80 | 1d | 17 | 1.06mi |
| 30428 Iroquois Dr Warren, MI | 3.0 | 1.0 | 1000 | $1,800 | $1.80 | 3d | 1 | 1.22mi |
HOA detail condo
- Monthly dues
- $426 · $5,112/yr
- Likely covers
- waterelectriclandscapingsnow removalgymparking
- Assessments
- None detected in remarks — confirm with the listing agent.
Listing history 20 events
-
2026-06-21days on market $129,900 Active 118 DOM
-
2026-06-18days on market $129,900 Active 115 DOM
-
2026-06-17days on market $129,900 Active 114 DOM
-
2026-06-16days on market $129,900 Active 113 DOM
-
2026-06-15days on market $129,900 Active 112 DOM
-
2026-06-13days on market $129,900 Active 110 DOM
-
2026-06-09days on market $129,900 Active 106 DOM
-
2026-06-08days on market $129,900 Active 105 DOM
-
2026-06-07days on market $129,900 Active 104 DOM
-
2026-06-04days on market $129,900 Active 101 DOM
-
2026-06-03days on market $129,900 Active 100 DOM
-
2026-06-02days on market $129,900 Active 99 DOM
-
2026-06-01days on market $129,900 Active 98 DOM
-
2026-05-31days on market $129,900 Active 97 DOM
-
2026-05-11status Active 603-char remark
Show marketing remark (603 chars)
PERFECTLY LOCATED !! 2 Bedroom, 1.5 Bath Condo. Spacious Living Room Open to Dining Area & Kitchen w/ Plenty of Cabinet Space & Pantry. Spacious Laundry Room & Half Bathroom off of Kitchen. Huge Primary Bedroom w/ Large Walk-In Closet. 2nd Bedroom & Full Bathroom Upstairs. Assigned Parking. Minutes to City Hall, GM Tech Center, Detroit Arsenal, Hospital & Cadillac Tower! Walking distance to Restaurants, Entertainment, Gyms, Shopping, Schools & Parks! HOA includes: Grounds Maintenance, Structure, Water, Snow Removal & Partial Electricity. Minutes to I-696.
-
2026-05-11historical 603-char remark
Show marketing remark (603 chars)
PERFECTLY LOCATED !! 2 Bedroom, 1.5 Bath Condo. Spacious Living Room Open to Dining Area & Kitchen w/ Plenty of Cabinet Space & Pantry. Spacious Laundry Room & Half Bathroom off of Kitchen. Huge Primary Bedroom w/ Large Walk-In Closet. 2nd Bedroom & Full Bathroom Upstairs. Assigned Parking. Minutes to City Hall, GM Tech Center, Detroit Arsenal, Hospital & Cadillac Tower! Walking distance to Restaurants, Entertainment, Gyms, Shopping, Schools & Parks! HOA includes: Grounds Maintenance, Structure, Water, Snow Removal & Partial Electricity. Minutes to I-696.
-
2026-02-24$134,900 Active 603-char remark
Show marketing remark (603 chars)
PERFECTLY LOCATED !! 2 Bedroom, 1.5 Bath Condo. Spacious Living Room Open to Dining Area & Kitchen w/ Plenty of Cabinet Space & Pantry. Spacious Laundry Room & Half Bathroom off of Kitchen. Huge Primary Bedroom w/ Large Walk-In Closet. 2nd Bedroom & Full Bathroom Upstairs. Assigned Parking. Minutes to City Hall, GM Tech Center, Detroit Arsenal, Hospital & Cadillac Tower! Walking distance to Restaurants, Entertainment, Gyms, Shopping, Schools & Parks! HOA includes: Grounds Maintenance, Structure, Water, Snow Removal & Partial Electricity. Minutes to I-696.
-
2003-07-09soldstatus $88,900
-
1995-08-18soldstatus $56,700
ⓘ Source: listings_history table (triggers on properties + properties_extension) + one-shot
backfill from property_details.listing_events for pre-trigger history.
Tax reassessment forecast MI · Partial reset (capped growth)
- Current annual tax
- $1,852 · $154/mo
- Projected year-2 tax
- $1,926 · $161/mo
- Expected delta
- +$74/yr (+$6/mo · 4.0%)
ⓘ Screening estimate from a state-policy table — verify with the county assessor before closing.
Climate risk First Street
- Flood 2/10 Low FEMA zone X (unshaded) · 9% chance over 30 yrs
- Wildfire 1/10 Low
- Heat 3/10 Moderate 7 d/yr ≥97°F today · 15 d/yr by 30 yrs out
- Wind 1/10 Low
- Air quality 3/10 Moderate 3 unhealthy d/yr today · 4 by 30 yrs out
Nearby sold comps map
Loading sold comps map…
Walkable amenities ~0.75 mi
Loading nearby amenities…
Taxation est. · year 1
- Rental income
- $20,137
- − Mortgage interest
- −$7,276
- − Property taxes
- −$1,852
- − Insurance
- −$650
- − Repairs & maintenance
- −$1,611
- − Management
- −$1,611
- − HOA
- −$5,112
- − Depreciation
- −$3,779
- Taxable loss
- −$1,754
- Est. tax savings @ 24.0%
- +$421
- After-tax cash flow
- $541/yr
For passive investors: Depreciation is non-cash, so a rental often shows a tax loss while cash-flowing — sheltering income. Rental losses are passive: they offset passive income freely, and up to $25,000/yr can offset ordinary (W-2) income if you actively participate and your MAGI is under $100k (phasing out to $0 by $150k); unused losses carry forward. On sale, claimed depreciation is recaptured at up to 25%, and gains may owe capital-gains tax (a 1031 exchange can defer both). Figures are a year-1 estimate at your 24.0% rate — not tax advice; consult a CPA.
Schools (NCES district)
- District
- Warren Consolidated Schools
- NCES district ID
- 2635190
- Math proficiency
- 18% ▼ -14.00%
- Reading proficiency
- 39% ▼ -8.00%
- Median HH income
- $52,259
- Composite
- 25.09/100
- National rank
- #7533
- State rank
- #373 of 540 in MI
Livability — Warren
- Score
- 74/100
- State rank
- #171
- US rank
- #4491
Category grades
Schools grade is shown separately in the Schools card above.
Census & demographics
- Census place
- Warren, MI
- County
- Macomb County · 638,552 people
- City population
- 114,937
- Metro
- Detroit-Warren-Dearborn, MI
- Population (ZIP)
- 25,014
- Household income
- $68,218
- Rent vs Own
- Severe rent burden
- 632.0
Population outlook (Macomb County) Hauer SSP2
- Today (2025)
- 925,296 people
- By 2030
- 948,226 · +2.5%
- By 2040
- 983,961 · +6.3%
- By 2050
- 1,010,200 · +9.2%
- By 2075
- 1,076,222 · +16.3%
- By 2100
- 1,077,065 · +16.4%
Race, ethnicity, and origin ACS 2023
- Neighborhood character
- Predominantly White (66%)
- Race & ethnicity
- White 66% Black 18% Asian 9% Two or more races 6% Hispanic / Latino 1%
- Common ancestry
- Romanian 14% Lithuanian 3% Arab 2%
- Foreign-born
- 15% · Vietnam, Canada, China
- Languages at home
- 80% English-only · Other Indo-European 5% Arabic 4% Russian/Polish/Slavic 4%
Political lean MEDSL · Macomb
- 2024 margin
- R (+13.7) · D 42.2% · R 55.9% · Other 1.9%
- 2008→2024 swing
- -22.3pp toward R · 2008: 8.6pp · 2024: -13.7pp
- All cycles
- 2024: R+13.7 2020: R+8.1 2016: R+11.6 2012: D+4.0 2008: D+8.6
Not yet ingested
- Civics
- —
Market trends
- HPI YoY
- ▼ -223.26%
- Current HPI
- 203.6554
- Rent YoY
- ▲ 2.52%
- Metro
- Detroit-Warren-Dearborn, MI
- State GDP YoY
- ▲ 1.37%
- F500 in state
- 28
Industry mix (Fortune 500 HQ in MI)
| Industry | F500 HQs | Revenue |
|---|---|---|
| Automotive Parts | 3 | $48B |
|
||
| Automotive | 2 | $372B |
|
||
| Chemicals | 1 | $45B |
|
||
| Automotive Retail | 1 | $29B |
|
||
| Healthcare / Medical Devices | 1 | $23B |
|
||
| Automotive Technology | 1 | $20B |
|
||
Price history
+137.9% since first listed6 events — show timeline
- 2026-05-11 Relisted — REALCOMP
- 2026-05-11 Listing Removed — REALCOMP
- 2026-02-24 Listed $134,900 MiRealSource-MiMLS
- 2026-02-24 Listed $134,900 REALCOMP
- 2003-07-09 Sold (Public Records) $88,900 Public Records
- 1995-08-18 Sold (Public Records) $56,700 Public Records
Property tax history
+3.9%/yrLatest (2025): $1,852 · +2.2% YoY. Source: county tax records.
Cash-flow waterfall
monthlySold comps — $/sqft
last 12 mo · ≤1 miLoading sold comps…