 🏷️ Likely Rental
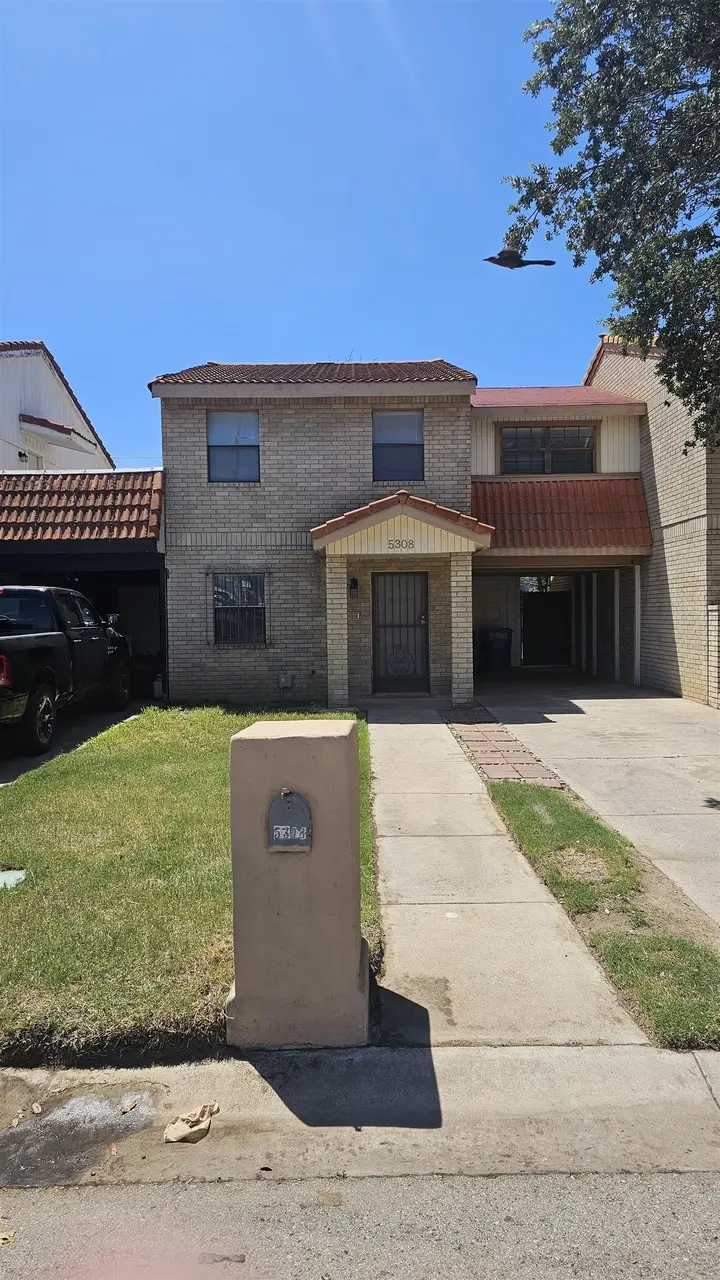
5308 Cypress Dr #5908 · Laredo, TX
Flood risk 5/10 · Moderate
- FEMA flood zone
- X (unshaded)
- Chance of flooding over 30 yrs
- 0.66%
- Est. flood insurance / yr
- $507 – $1,088
Fire risk 1/10 · Minimal
- Est. fire insurance / yr
- $1,222 – $2,270
Heat risk 8/10 · Major
- Hot days now (above 110°F)
- 7 days/yr
- Hot days in 30 yrs
- 23 days/yr
Wind risk 8/10 · Major
- Chance of severe wind over 30 yrs
- 80.0%
Air-quality risk 1/10 · Minimal
- Unhealthy air days now
- 0 days/yr
- Unhealthy air days in 30 yrs
- 0 days/yr
Risk factors via First Street. Map © Google.
Why this score? — see what drove the D grade
The composite is a weighted blend of 9 inputs, each scored 0–100. Each bar is that input's sub-score; the figure is the points it added to the 100-point composite (weight × sub-score).
- Cash flow +15.0/30.0
- ARV discount +7.5/15.0
- 1% rule +5.0/10.0
- DSCR +5.0/10.0
- Livability +3.7/5.0
- Schools +2.8/10.0
- Rent growth +2.5/5.0
- Condition / age +2.5/5.0
- Appreciation +0.0/10.0
$1,550
🖨 Deal sheet 📄 Offer letter ✓ Due diligence
Listing remarks
Two-story townhome for lease. Walking distance to Newman Elementary. Back storage room outside.
Key facts
- Two-story townhome
- 3,080 sq ft lot
- Built 1980
Tags
Property features AI
Exterior
- Parking: Concrete parking
- Utilities: Public water; Underground utilities
- Home design: Condo/Townhouse; Residential property; 2 stories
- Construction: Brick veneer construction; Slab foundation
- Exterior features: Wood fencing; Level lot
Interior
- Kitchen: Microwave; Range; Refrigerator; Electric water heater
- Flooring: Tile flooring; Wood flooring
- Bathrooms: 2 full bathrooms; 1 half bathroom
- Heating & cooling: Central heating; Electric heating; Central air conditioning; Ceiling fans
- Interior features: Kitchen island
Neighborhood map
What this means for you Summary
Snapshot
- This is a 3-bed/2.5-bath single-family listed at $2k.
Deal economics
- At list price, monthly cash flow is $1k ($18k/yr) — positive.
- The deal already cash-flows at list — no discount required.
- Meets the 1% rule at list price ($2k rent vs $2k).
- Recommended offer: $2k (3.0% below list) — sets the bar for market timing.
- Cap rate 1142.5% vs local median 4.1% in Laredo — top-decile yield for the area; either an underpriced asset or a hidden risk that comps aren't pricing in. Stress-test before assuming the spread holds.
Location & tenants
- Location reads 73/100 on livability (#227 in TX) — a middle-class / working-renter tenant base. Strengths: cost of living A+, housing A+, health & safety A+; Watch: crime C-, employment D+, amenities F.
- United ISD (urban): math 27% / reading 38% proficiency, ranked #568 of 826 in TX (top 69%) — families likely to look elsewhere, expect single-tenant / working-renter base with shorter leases; 72% free/reduced lunch — lower-income household profile, screen leases tightly.
- Zoned schools: Newman El (math 22% / reading 32%, grade F, #2,791 of 4,322 statewide, top 68%, 392 students, 89% FRL) — zoned schools average 89% FRL vs 72% district-wide (17 pts higher); higher-poverty schools than district average — tighter screening recommended.
- Market conditions: 124 active listings in the ZIP; 7 comparable units currently listed for rent nearby; rentals lingering (median 44d on market — plan ~5-8 weeks vacancy on turnover, expect pricing pressure); 100% of comp listings sitting > 30 days — soft ceiling on asking rent; 1,448 units permitted in Webb County in 2024 (245 in 5+ unit buildings).
Forward outlook
- Local home prices are declining (-3.0%/yr); year-one equity from $10 of loan paydown is wiped out by about $46 of value loss. Plan a longer hold.
- Webb County population projected at +23% by 2050 — long-run rental-demand tailwind backs the buy-and-hold thesis.
- At projected returns (-3.0% appreciation + 3.0% rent growth), your $434 cash investment doubles in ~1 year — after that, you're playing with house money.
Negotiation context
- It's been on market 46 days — a 3% lower offer ($2k) is reasonable based on typical stale-listing flexibility.
Risks & watch-outs
- Climate carrying-cost: moderate flood risk; severe wind risk, 80% chance of damaging wind over 30y; extreme-heat days projected 7→23/yr by 2055 (HVAC capex compounding) — expect insurance premiums to compound above CPI over the hold.
Questions for the listing agent
- It's been on market 46 days. Have you received any prior offers? Is the seller open to a 3% concession, seller financing, or rate buy-down credit?
- Is there a deadline driving the sale (1031 exchange, divorce, estate, relocation)? That informs how much negotiation room exists.
- The area grade is low — what's the realistic commute time and amenity access for the typical tenant pool here? Any planned neighborhood developments (good or bad) we should know about?
- What's the average days-on-market for RENTAL listings here right now (not sales)? A rising rental-DOM trend means longer vacancies and softer asking-rent achievability than the comps imply.
- What's the recent tenant-quality profile in this submarket — average credit score on applications, eviction rate, late-payment / NSF rate, and stable-employment percentage? A property-management company in the area should have these aggregated.
- How much new for-sale + rental construction is in the pipeline within 1–3 miles? Heavy new supply typically softens prices + rents 12–24 months out; constrained supply supports both.
Investment metrics
- 1% rule
- 120.72% ✓
- Cap rate
- 1142.46%
- Cash-on-cash
- 4057.73%
- DSCR
- 181.55
- GRM
- 0.1
CMA / ARV
- ARV (median comp)
- $223,647
- List price
- $1,550
- Delta
- -99.31%
- Verdict
- UNDERPRICED
- Comps
- 4 within 1.0 mi
Show comp detail 2 sales within ~0.75 mi
| Address | Dist | Beds/Ba | Sqft | Sold | Price | $/sf | Match |
|---|---|---|---|---|---|---|---|
| 106 Kentucky | 0.57mi | 3/2.0 | 1,790 (+7%) | 4mo | $226,000 | $126 | 56 |
| 1005 Chaparral | 0.47mi | 3/2.0 | 1,886 (+13%) | 23mo | $215,000 | $114 | 36 |
Match score weights: distance 35% · size 25% · config 20% · recency 20%. Top-matched comps best support the ARV.
Projected returns pro-forma
-3.0% appreciation · 3.0% rent growth · sell at horizon
- IRR
- —
- Equity multiple
- 215.85×
- Total profit
- $93,246
- Equity at exit
- $231
- IRR
- —
- Equity multiple
- 465.67×
- Total profit
- $201,667
- Equity at exit
- $134
Cash invested: $434 (down + closing). Projections, not guarantees.
Landlord ↔ Tenant lean methodology
- Overall (STATE)
- 87 Strongly Landlord-Friendly
- State Texas
- 87 Strongly Landlord-Friendly · R+5
- County
- — inherits STATE
- City
- — inherits STATE
ZIP-level market 78041
- Active inventory
- 124
- Price-to-rent
- 0.1×
Monthly cashflow live
- Estimated rent
- $1,871 high interval (Pro) →
- Mortgage (P&I)
- −$8
- Tax est. 1.5%
- −$2 /mo · $23/yr
- Insurance
- −$1
- HOA
- −$0
- Vacancy / Maint / Mgmt
- −$393
- Net cashflow
- $1,468
Break-even live
UW: 25.0% down · 7.5% · 30yr · 1.5% tax · 5.0% vac · 8.0% maint · 8.0% mgmt
Financing live
Cash to close
- Down payment
- $388
- Closing costs
- $46
- Reserves months
- —
- Total cash needed
- —
Loan-product check · same deal, 3 products live
Conventional
25% down · 7.5% · 30yr
- Down + closing
- —
- Monthly P&I
- —
- Monthly cashflow
- —
- DSCR
- —
- Eligible?
- —
Personal DTI + credit; lowest rate.
DSCR
20% down · 8.5% · 30yr
- Down + closing
- —
- Monthly P&I
- —
- Monthly cashflow
- —
- DSCR
- —
- Eligible?
- —
No personal income docs; deal must DSCR.
Hard money
10% down · 12.0% · 12mo
- Down + closing
- —
- Monthly P&I
- —
- Monthly cashflow
- —
- DSCR
- —
- Eligible?
- —
Short-term bridge; refi at stabilization.
Rent comps 7 comps
| Address | Beds | Baths | Sqft | Rent | $/sqft | DOM | Units | Dist |
|---|---|---|---|---|---|---|---|---|
| 105 Indiana St Laredo, TX | 3.0 | 2.5 | 1843 | $2,000 | $1.09 | 44d | 1 | 0.60mi |
| 707 Saint James Dr #105 Laredo, TX | 3.0 | 3.5 | 1510 | $1,950 | $1.29 | 44d | 1 | 0.88mi |
| 4505 Springfield Ave Laredo, TX | 1.0–3.0 | 1.0–2.0 | 740 | $1,050 | $1.42 | 44d | 3 | 0.90mi |
| 6317 Krone Ln Unit A3 Laredo, TX | 3.0 | 2.5 | 1904 | $2,600 | $1.37 | 44d | 1 | 1.08mi |
| 1609 Suldana Ave #327 Laredo, TX | 3.0 | 2.5 | 1638 | $1,850 | $1.13 | 44d | 1 | 1.11mi |
| 1609 Suldana Ave Unit 323 Laredo, TX | 3.0 | 2.5 | 1638 | $1,800 | $1.10 | 44d | 1 | 1.11mi |
| 3509 Springfield Ave Laredo, TX | 3.0 | 2.0 | 1394 | $1,250 | $0.90 | 44d | 1 | 1.36mi |
Listing history 17 events
-
2026-06-19days on market $1,550 Active 46 DOM
-
2026-06-18days on market $1,550 Active 45 DOM
-
2026-06-17days on market $1,550 Active 44 DOM
-
2026-06-16days on market $1,550 Active 43 DOM
-
2026-06-15days on market $1,550 Active 42 DOM
-
2026-06-14days on market $1,550 Active 40 DOM
-
2026-06-13days on market $1,550 Active 39 DOM
-
2026-06-10days on market $1,550 Active 37 DOM
-
2026-06-09days on market $1,550 Active 36 DOM
-
2026-06-08days on market $1,550 Active 35 DOM
-
2026-06-07days on market $1,550 Active 34 DOM
-
2026-06-03pricedays on market $1,550 Active 30 DOM
-
2026-06-02days on market $1,700 Active 29 DOM
-
2026-06-01days on market $1,700 Active 28 DOM
-
2026-05-31days on market $1,700 Active 27 DOM
-
2026-05-30days on market $1,700 Active 26 DOM
-
2026-05-03$1,700 Active 95-char remark
ⓘ Source: listings_history table (triggers on properties + properties_extension) + one-shot
backfill from property_details.listing_events for pre-trigger history.
Climate risk First Street
- Flood 5/10 Major FEMA zone X (unshaded) · 66% chance over 30 yrs
- Wildfire 1/10 Low
- Heat 8/10 Severe 7 d/yr ≥110°F today · 23 d/yr by 30 yrs out
- Wind 8/10 Severe 80% chance of damaging wind over 30 yrs
- Air quality 1/10 Low 0 unhealthy d/yr today · 0 by 30 yrs out
Nearby sold comps map
Loading sold comps map…
Walkable amenities ~0.75 mi
Loading nearby amenities…
Taxation est. · year 1
- Rental income
- $22,455
- − Mortgage interest
- −$87
- − Property taxes
- −$23
- − Insurance
- −$8
- − Repairs & maintenance
- −$1,796
- − Management
- −$1,796
- − Depreciation
- −$45
- Taxable income
- $18,699
- Est. tax owed @ 24.0%
- −$4,488
- After-tax cash flow
- $13,123/yr
For passive investors: Depreciation is non-cash, so a rental often shows a tax loss while cash-flowing — sheltering income. Rental losses are passive: they offset passive income freely, and up to $25,000/yr can offset ordinary (W-2) income if you actively participate and your MAGI is under $100k (phasing out to $0 by $150k); unused losses carry forward. On sale, claimed depreciation is recaptured at up to 25%, and gains may owe capital-gains tax (a 1031 exchange can defer both). Figures are a year-1 estimate at your 24.0% rate — not tax advice; consult a CPA.
Schools (NCES district)
- District
- United ISD
- NCES district ID
- 4843650
- Math proficiency
- 27% ▼ -36.00%
- Reading proficiency
- 38% ▼ -11.00%
- Median HH income
- $47,780
- Composite
- 28.02/100
- National rank
- #6848
- State rank
- #568 of 826 in TX
Livability — Laredo
- Score
- 73/100
- State rank
- #227
- US rank
- #5399
Category grades
Schools grade is shown separately in the Schools card above.
Census & demographics
- Census place
- Laredo, TX
- City population
- 67,333
- Population (ZIP)
- 47,089
Population outlook (Webb County) Hauer SSP2
- Today (2025)
- 301,387 people
- By 2030
- 316,307 · +5.0%
- By 2040
- 345,636 · +14.7%
- By 2050
- 370,647 · +23.0%
- By 2075
- 413,907 · +37.3%
- By 2100
- 416,458 · +38.2%
Race, ethnicity, and origin ACS 2023
- Neighborhood character
- Predominantly Hispanic (93%)
- Race & ethnicity
- Hispanic / Latino 93% Two or more races 52% White 5% Asian 1%
- Hispanic origin (detail)
- Mexican 87%
- Foreign-born
- 24% · Canada, South Korea
- Languages at home
- 14% English-only · Spanish 85%
Political lean MEDSL · Webb
- 2024 margin
- Toss-up / Even · D 48.5% · R 50.7%
- 2008→2024 swing
- -45.6pp toward R · 2008: 43.4pp · 2024: -2.2pp
- All cycles
- 2024: R+2.2 2020: D+23.3 2016: D+51.6 2012: D+54.0 2008: D+43.4
Not yet ingested
- Civics
- —
Market trends
- HPI YoY
- ▼ -188.15%
- Current HPI
- 162.152
- Rent YoY
- —
- Metro
- —
- State GDP YoY
- ▲ 3.95%
- F500 in state
- 110
Industry mix (Fortune 500 HQ in TX)
| Industry | F500 HQs | Revenue |
|---|---|---|
| Energy | 16 | $1,198B |
|
||
| Technology | 5 | $198B |
|
||
| Engineering / Construction | 4 | $72B |
|
||
| Energy Services | 3 | $60B |
|
||
| Utilities | 3 | $41B |
|
||
| Healthcare | 2 | $330B |
|
||
Price history
-8.8% since first listed2 events — show timeline
- 2026-06-03 Price Changed $1,550 LAOR
- 2026-05-03 Listed $1,700 LAOR
Cash-flow waterfall
monthlySold comps — $/sqft
last 12 mo · ≤1 miLoading sold comps…