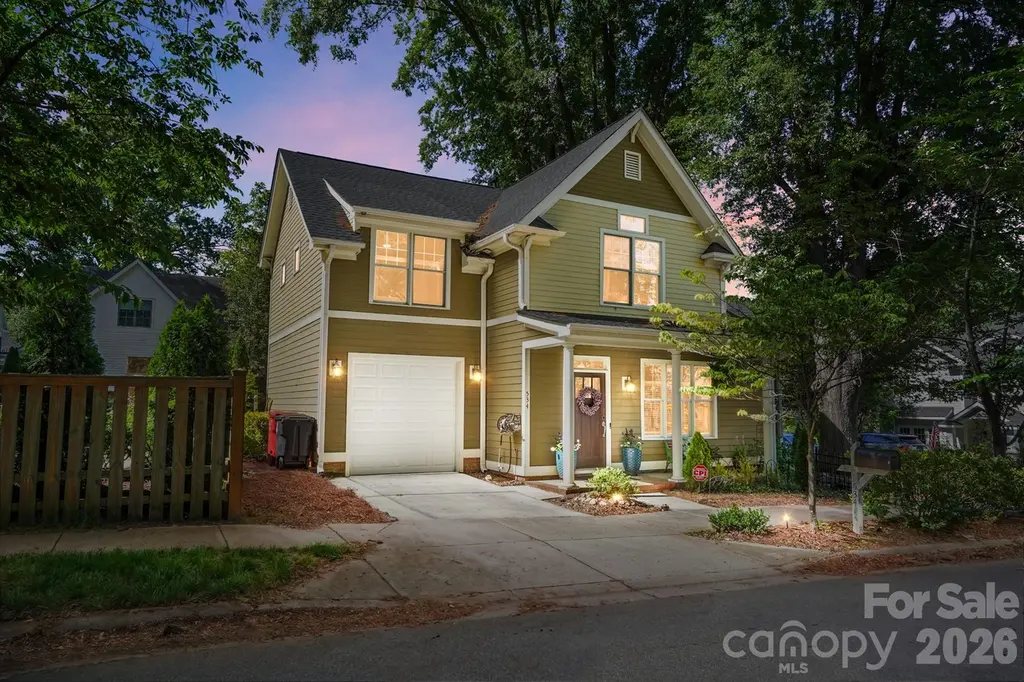
534 Spring St · Davidson, NC
Flood risk 1/10 · Minimal
- FEMA flood zone
- X (unshaded)
- Chance of flooding over 30 yrs
- 0.0%
- Est. flood insurance / yr
- $507 – $1,088
Fire risk 3/10 · Minor
- Est. fire insurance / yr
- $906 – $1,684
Heat risk 6/10 · Moderate
- Hot days now (above 104°F)
- 7 days/yr
- Hot days in 30 yrs
- 17 days/yr
Wind risk 4/10 · Minor
- Chance of severe wind over 30 yrs
- 13.0%
Air-quality risk 3/10 · Minor
- Unhealthy air days now
- 2 days/yr
- Unhealthy air days in 30 yrs
- 3 days/yr
Risk factors via First Street. Map © Google.
Why this score? — see what drove the D+ grade
The composite is a weighted blend of 9 inputs, each scored 0–100. Each bar is that input's sub-score; the figure is the points it added to the 100-point composite (weight × sub-score).
- ARV discount +15.0/15.0
- Cash flow +11.7/30.0
- Schools +3.8/10.0
- Livability +3.8/5.0
- Rent growth +3.5/5.0
- DSCR +3.4/10.0
- Condition / age +2.5/5.0
- 1% rule +2.4/10.0
- Appreciation +0.0/10.0
$307,584
🖨 Deal sheet 📄 Offer letter ✓ Due diligence
Listing remarks
Some homes check the boxes… this one captures your heart the moment you arrive. Welcome to 534 Spring Street, an incredibly rare opportunity to own right in the heart of Davidson, just two blocks from Main Street where life feels a little sweeter and everything is within reach. Morning coffee runs, evening strolls, the Farmers Market, local shops, restaurants and Davidson College events; it’s all right here waiting for you to step into the lifestyle you’ve been dreaming about. Inside, the home welcomes you with a warm, open flow that feels both inviting and effortless. The living room, anchored by a cozy gas log fireplace, blends seamlessly into the dining area and contin
Key facts
- Fully fenced yard
- Stainless deep sink
- 3,310 sq ft lot
Tags
Property features AI
Finance
- Other: Property is zoned VI; Deed restrictions
- HOA & community: No HOA
Exterior
- Parking: Attached garage (1 car); Driveway
- Security: Security system
- Utilities: City water; Public sewer; Cable available; Publicly maintained paved concrete road
- Home design: Single-family residence; Two levels; Slab foundation
- Construction: Site-built home; Fiber cement exterior
- Exterior features: Covered front porch; Patio; Full fencing; Corner lot; Outbuilding
Interior
- Kitchen: Dishwasher; Gas range; Microwave; Refrigerator
- Bedrooms: Three bedrooms on the upper level
- Flooring: Carpet; Tile; Wood
- Bathrooms: Two full bathrooms; One half bathroom on the main level
- Heating & cooling: Forced air heating (natural gas); Central air conditioning; Ceiling fans
- Interior features: Open floorplan; Pantry; Attic with pull-down stairs; Family room with gas log fireplace; Security system
- Laundry & utility: Laundry room on the upper level; Washer/Dryer included
Neighborhood map
What this means for you Summary
Snapshot
- This is a 3-bed/2.5-bath single-family listed at $308k.
Deal economics
- At list price, monthly cash flow is $-90 ($-1k/yr) — negative.
- To cash-flow at today's rent, offer at most $292k (5.2% below list).
- To meet the 1% rule (rent ≥ 1% of price), the offer needs to be $227k (26.2% below list).
- Recommended offer: $227k (26.2% below list) — sets the bar for 1% rule.
- Cap rate 5.9% vs local median 1.6% in Davidson — top-decile yield for the area; either an underpriced asset or a hidden risk that comps aren't pricing in. Stress-test before assuming the spread holds.
Location & tenants
- Location reads 76/100 on livability (#40 in NC, #3,569 nationally) — a middle-class / working-renter tenant base. Strengths: crime A+, commute A+, employment A+; Watch: amenities F, cost of living F, health & safety F.
- Charlotte-Mecklenburg Schools (urban): math 42% / reading 46% proficiency, ranked #85 of 178 in NC (top 48%) — families likely to look elsewhere, expect single-tenant / working-renter base with shorter leases.
- Zoned schools: Davidson K-8 School (math 72% / reading 75%, grade A, #68 of 1,410 statewide, top 5%, 1,171 students, 8% FRL); William Amos Hough High (math 83% / reading 81%, grade A, #71 of 535 statewide, top 13%, 2,518 students, 14% FRL) — zoned schools average 11% FRL vs 49% district-wide (38 pts lower); this property's tenant base skews higher-income than the district average.
- Zoned-school proficiency averages 78% at this address vs 44% district-wide (+34 pts) — the actual schools serving this property are materially stronger than the Charlotte-Mecklenburg Schools average implies; a family-tenant draw the district grade alone would hide.
- Market conditions: Rents rising (+3.9%/yr); 243 active listings in the ZIP; 36 comparable units currently listed for rent nearby; rentals at typical pace (median 18d on market — plan ~3-4 weeks tenant-placement turnaround); high-income renter base; 11,969 units permitted in Mecklenburg County in 2024 (5,377 in 5+ unit buildings).
- This rent is only 17% of the median local income ($156k/yr) — well below the 30% rent-burden line; pricing power to push rent on renewal without tenant pushback.
Forward outlook
- Local home prices are declining (-3.0%/yr); year-one equity from $2k of loan paydown is wiped out by about $9k of value loss. Plan a longer hold.
- Mecklenburg County population projected at +53% by 2050 — long-run rental-demand tailwind backs the buy-and-hold thesis.
Negotiation context
- Only 2 days on market — expect competitive offers; lowballing is unlikely to land.
Risks & watch-outs
- Climate carrying-cost: extreme-heat days projected 7→17/yr by 2055 (HVAC capex compounding) — expect insurance premiums to compound above CPI over the hold.
Questions for the listing agent
- What do current leases actually rent for vs. the listed asking? Can we see a recent rent roll and the last 12 months of T-12 income?
- Is there a deadline driving the sale (1031 exchange, divorce, estate, relocation)? That informs how much negotiation room exists.
- Schools are A-rated — typically a magnet for longer-tenancy family renters. What's the average tenant stay here, and is there a school-zone premium baked into asking?
- The area grade is low — what's the realistic commute time and amenity access for the typical tenant pool here? Any planned neighborhood developments (good or bad) we should know about?
- What's the average days-on-market for RENTAL listings here right now (not sales)? A rising rental-DOM trend means longer vacancies and softer asking-rent achievability than the comps imply.
- What's the recent tenant-quality profile in this submarket — average credit score on applications, eviction rate, late-payment / NSF rate, and stable-employment percentage? A property-management company in the area should have these aggregated.
- How much new for-sale + rental construction is in the pipeline within 1–3 miles? Heavy new supply typically softens prices + rents 12–24 months out; constrained supply supports both.
Investment metrics
- 1% rule
- 0.74% ✗
- Cap rate
- 5.94%
- Cash-on-cash
- -1.26%
- DSCR
- 0.94
- GRM
- 11.3
CMA / ARV
- ARV (on-the-fly)
- $396,576
- Comps found
- 9
Show comp detail 9 sales within ~0.75 mi
| Address | Dist | Beds/Ba | Sqft | Sold | Price | $/sf | Match |
|---|---|---|---|---|---|---|---|
| 534 Spring St | 0.00mi | 3/2.5 | 1,470 (+1%) | 0mo | $307,584 | $209 | 98 |
| 233 Eden St | 0.44mi | 3/2.0 | 1,304 (-11%) | 2mo | $185,000 | $142 | 58 |
| 520 Catawba Ave | 0.61mi | 3/2.5 | 1,344 (-8%) | 3mo | $490,000 | $365 | 56 |
| 119 Potts St | 0.34mi | 4/2.0 (+1) | 1,524 (+4%) | 23mo | $360,000 | $236 | 51 |
| 21216 Pecan St | 0.51mi | 3/1.0 | 1,442 (-1%) | 22mo | $445,000 | $309 | 50 |
| 240 Faust Rd | 0.61mi | 3/2.5 | 1,348 (-8%) | 12mo | $465,000 | $345 | 49 |
| 232 Faust Rd | 0.62mi | 3/2.5 | 1,344 (-8%) | 11mo | $277,000 | $206 | 49 |
| 207 Lakeside Ave | 0.52mi | 3/2.0 | 1,325 (-9%) | 12mo | $360,000 | $272 | 48 |
| 21115 Cornelius St | 0.59mi | 3/2.0 | 1,240 (-15%) | 5mo | $375,000 | $302 | 41 |
Match score weights: distance 35% · size 25% · config 20% · recency 20%. Top-matched comps best support the ARV.
Projected returns pro-forma
-3.0% appreciation · 3.87% rent growth · sell at horizon
- IRR
- -17.6%
- Equity multiple
- 0.38×
- Total profit
- $-53,717
- Equity at exit
- $45,862
- IRR
- -8.3%
- Equity multiple
- 0.46×
- Total profit
- $-46,297
- Equity at exit
- $26,594
Cash invested: $86,124 (down + closing). Projections, not guarantees.
Landlord ↔ Tenant lean methodology
- Overall (STATE)
- 85 Strongly Landlord-Friendly
- State North Carolina
- 85 Strongly Landlord-Friendly · R+3
- County
- — inherits STATE
- City
- — inherits STATE
ZIP-level market 28036
- Rents YoY
- 3.9%
- Active inventory
- 243
- Price-to-rent
- 11.3×
Monthly cashflow live
- Estimated rent
- $2,269 high interval (Pro) →
- Mortgage (P&I)
- −$1,613
- Tax from tax record
- −$142 /mo · $1,702/yr
- Insurance
- −$128
- HOA
- −$0
- Vacancy / Maint / Mgmt
- −$476
- Net cashflow
- $-90
Break-even live
UW: 25.0% down · 7.5% · 30yr · 1.5% tax · 5.0% vac · 8.0% maint · 8.0% mgmt
Financing live
Cash to close
- Down payment
- $76,896
- Closing costs
- $9,228
- Reserves months
- —
- Total cash needed
- —
Loan-product check · same deal, 3 products live
Conventional
25% down · 7.5% · 30yr
- Down + closing
- —
- Monthly P&I
- —
- Monthly cashflow
- —
- DSCR
- —
- Eligible?
- —
Personal DTI + credit; lowest rate.
DSCR
20% down · 8.5% · 30yr
- Down + closing
- —
- Monthly P&I
- —
- Monthly cashflow
- —
- DSCR
- —
- Eligible?
- —
No personal income docs; deal must DSCR.
Hard money
10% down · 12.0% · 12mo
- Down + closing
- —
- Monthly P&I
- —
- Monthly cashflow
- —
- DSCR
- —
- Eligible?
- —
Short-term bridge; refi at stabilization.
Rent comps 36 comps
| Address | Beds | Baths | Sqft | Rent | $/sqft | DOM | Units | Dist |
|---|---|---|---|---|---|---|---|---|
| 351 Spring St Davidson, NC | 3.0 | 3.5 | 1844 | $3,000 | $1.63 | 17d | 1 | 0.07mi |
| 714 Cotton Gin Aly Davidson, NC | 2.0 | 2.0 | 1133 | $1,750 | $1.54 | 7d | 1 | 0.20mi |
| 21032 N Main St Cornelius, NC | 2.0 | 3.0 | 1150 | $1,675 | $1.46 | 23d | 1 | 0.33mi |
| 152 Mock Rd Davidson, NC | 3.0 | 2.0 | 1304 | $2,400 | $1.84 | 23d | 1 | 0.48mi |
| 534 Westside Ter Davidson, NC | 4.0 | 1.5 | 1200 | $1,999 | $1.67 | 23d | 1 | 0.50mi |
| 216 Lakeside Ave Davidson, NC | 3.0 | 1.0 | 912 | $1,500 | $1.64 | 23d | 1 | 0.53mi |
| 20618 Cornelius St Cornelius, NC | 2.0 | 2.0 | 900 | $1,950 | $2.17 | 17d | 1 | 0.62mi |
| 285 Davidson Gateway Dr Davidson, NC | 2.0 | 2.5 | 1502 | $1,950 | $1.30 | 23d | 1 | 0.63mi |
| 229 Davidson Gateway Dr Davidson, NC | 3.0 | 3.5 | 1830 | $3,500 | $1.91 | 23d | 1 | 0.63mi |
| 330 Davidson Gateway Dr Davidson, NC | 2.0 | 2.5 | 1308 | $1,567 | $1.20 | 17d | 1 | 0.67mi |
| 11418 Potters Row Unit Antiquity Townhouse Cornelius, NC | 2.0 | 2.5 | 1200 | $2,150 | $1.79 | 3d | 1 | 0.70mi |
| 626 Old Meeting Way Davidson, NC | 2.0 | 2.5 | 1258 | $1,700 | $1.35 | 23d | 1 | 0.70mi |
| 20241 Railroad St Cornelius, NC | 3.0 | 2.0 | 1078 | $1,400 | $1.30 | 23d | 1 | 0.73mi |
| 455 Davidson Gateway Dr Davidson, NC | 1.0–2.0 | 1.0–2.5 | 915 | $1,999 | $2.18 | 2d | 21 | 0.75mi |
| 605 Jetton St Davidson, NC | 2.0 | 1.0–2.0 | 837 | $1,692 | $2.02 | 3d | 12 | 0.77mi |
| 204 Grey Rd Davidson, NC | 3.0 | 2.5 | 1760 | $2,200 | $1.25 | 16d | 1 | 0.80mi |
| 900 Lakeview Ave Davidson, NC | 2.0–3.0 | 1.0–1.5 | 872 | $1,580 | $1.81 | 4d | 7 | 0.88mi |
| 22415 Market St Cornelius, NC | 1.0–3.0 | 1.0–2.0 | 1091 | $2,355 | $2.16 | 1d | 32 | 0.94mi |
| 21501 Hickory St Cornelius, NC | 1.0–2.0 | 1.0–2.0 | 872 | $1,895 | $2.17 | 3d | 8 | 1.08mi |
| 940 Jetton St Davidson, NC | 3.0 | 2.0 | 1394 | $2,675 | $1.92 | 17d | 1 | 1.12mi |
| 21152 Kimbrough Ln Cornelius, NC | 2.0 | 2.0 | 1180 | $1,600 | $1.36 | 23d | 1 | 1.12mi |
| 1105 Torrence Cir Davidson, NC | 2.0 | 2.0 | 1114 | $2,395 | $2.15 | 16d | 1 | 1.15mi |
| 1105 Torrence Cir Davidson, NC | 2.0 | 2.0 | 1114 | $2,395 | $2.15 | 17d | 1 | 1.15mi |
| 1205 Torrence Cir Davidson, NC | 3.0 | 2.0 | 1390 | $2,900 | $2.09 | 4d | 1 | 1.15mi |
| 763 Southwest Dr Davidson, NC | 2.0 | 2.0 | 985 | $2,100 | $2.13 | 23d | 1 | 1.22mi |
| 767 Southwest Dr Davidson, NC | 2.0 | 2.0 | 962 | $1,725 | $1.79 | 21d | 1 | 1.23mi |
| 767 Southwest Dr Unit 767 Davidson, NC | 2.0 | 2.0 | 962 | $1,795 | $1.87 | 21d | 1 | 1.23mi |
| 19626 Feriba Pl Cornelius, NC | 2.0 | 2.0 | 1180 | $1,525 | $1.29 | 4d | 1 | 1.23mi |
| 19505 Meridian St Cornelius, NC | 2.0 | 2.5 | 1275 | $1,700 | $1.33 | 14d | 1 | 1.23mi |
| 20705 Sterling Bay Ln E Cornelius, NC | 1.0–3.0 | 1.0–2.0 | 1213 | $1,949 | $1.61 | 2d | 15 | 1.24mi |
| 751 Southwest Dr Davidson, NC | 2.0 | 2.0 | 989 | $1,950 | $1.97 | 23d | 1 | 1.24mi |
| 19809 N Ferry St Cornelius, NC | 3.0 | 2.5 | 1192 | $2,050 | $1.72 | 23d | 1 | 1.24mi |
| 21536 Aftonshire Dr Cornelius, NC | 2.0 | 2.0 | 1150 | $1,595 | $1.39 | 7d | 1 | 1.26mi |
| 726 Southwest Dr Davidson, NC | 2.0 | 2.0 | 937 | $2,000 | $2.13 | 23d | 1 | 1.28mi |
| 19925 Weeping Water Run Cornelius, NC | 2.0 | 2.0 | 1180 | $1,595 | $1.35 | 21d | 1 | 1.30mi |
| 862 Southwest Dr Davidson, NC | 3.0 | 2.0 | 1186 | $3,000 | $2.53 | 23d | 1 | 1.30mi |
Listing history 3 events
-
2026-05-20status Pending
-
2026-05-18$307,584 Active
-
2006-09-29soldstatus $540,000
ⓘ Source: listings_history table (triggers on properties + properties_extension) + one-shot
backfill from property_details.listing_events for pre-trigger history.
Tax reassessment forecast NC · Resets to sale price
- Current annual tax
- $1,702 · $142/mo
- Projected year-2 tax
- $2,522 · $210/mo
- Expected delta
- +$820/yr (+$68/mo · 48.2%)
ⓘ Screening estimate from a state-policy table — verify with the county assessor before closing.
Climate risk First Street
- Flood 1/10 Low FEMA zone X (unshaded) · 0% chance over 30 yrs
- Wildfire 3/10 Moderate
- Heat 6/10 Major 7 d/yr ≥104°F today · 17 d/yr by 30 yrs out
- Wind 4/10 Moderate 13% chance of damaging wind over 30 yrs
- Air quality 3/10 Moderate 2 unhealthy d/yr today · 3 by 30 yrs out
Nearby sold comps map
Loading sold comps map…
Walkable amenities ~0.75 mi
Loading nearby amenities…
Taxation est. · year 1
- Rental income
- $27,228
- − Mortgage interest
- −$17,229
- − Property taxes
- −$1,702
- − Insurance
- −$1,538
- − Repairs & maintenance
- −$2,178
- − Management
- −$2,178
- − Depreciation
- −$8,948
- Taxable loss
- −$6,546
- Est. tax savings @ 24.0%
- +$1,571
- After-tax cash flow
- $485/yr
For passive investors: Depreciation is non-cash, so a rental often shows a tax loss while cash-flowing — sheltering income. Rental losses are passive: they offset passive income freely, and up to $25,000/yr can offset ordinary (W-2) income if you actively participate and your MAGI is under $100k (phasing out to $0 by $150k); unused losses carry forward. On sale, claimed depreciation is recaptured at up to 25%, and gains may owe capital-gains tax (a 1031 exchange can defer both). Figures are a year-1 estimate at your 24.0% rate — not tax advice; consult a CPA.
Schools (NCES district)
- District
- Charlotte-Mecklenburg Schools
- NCES district ID
- 3702970
- Math proficiency
- 42% ▼ -6.00%
- Reading proficiency
- 46% ▲ 1.00%
- Median HH income
- $57,175
- Composite
- 38.49/100
- National rank
- #4183
- State rank
- #85 of 178 in NC
Livability — Davidson
- Score
- 76/100
- State rank
- #40
- US rank
- #3569
Category grades
Schools grade is shown separately in the Schools card above.
Census & demographics
- Census place
- Davidson, NC
- County
- Mecklenburg County · 1,167,319 people
- City population
- 22,963
- Metro
- Charlotte-Concord-Gastonia, NC-SC
- Population (ZIP)
- 22,963
- Household income
- $156,496
- Rent vs Own
- Severe rent burden
- 336.0
Population outlook (Mecklenburg County) Hauer SSP2
- Today (2025)
- 1,305,740 people
- By 2030
- 1,442,752 · +10.5%
- By 2040
- 1,722,441 · +31.9%
- By 2050
- 1,999,450 · +53.1%
- By 2075
- 2,642,495 · +102.4%
- By 2100
- 3,106,755 · +137.9%
Race, ethnicity, and origin ACS 2023
- Neighborhood character
- Predominantly White (75%)
- Race & ethnicity
- White 75% Two or more races 11% Black 8% Hispanic / Latino 7% Asian 2%
- Hispanic origin (detail)
- Mexican 3%
- Common ancestry
- Romanian 4% Slovak 4% Iranian 3%
- Foreign-born
- 4% · Canada, China, South Korea
- Languages at home
- 94% English-only · Spanish 3% Chinese 1% Other Asian/Pacific 1%
Political lean MEDSL · Mecklenburg
- 2024 margin
- Solid D (+32.9) · D 65.6% · R 32.7% · Other 1.6%
- 2008→2024 swing
- +8.5pp toward D · 2008: 24.4pp · 2024: 32.9pp
- All cycles
- 2024: D+32.9 2020: D+35.1 2016: D+29.9 2012: D+22.5 2008: D+24.4
Not yet ingested
- Civics
- —
Market trends
- HPI YoY
- ▼ -158.36%
- Current HPI
- 287.0837
- Rent YoY
- ▲ 3.87%
- Metro
- Charlotte-Concord-Gastonia, NC-SC
- State GDP YoY
- ▲ 3.28%
- F500 in state
- 26
Industry mix (Fortune 500 HQ in NC)
| Industry | F500 HQs | Revenue |
|---|---|---|
| Financial Services | 2 | $213B |
|
||
| Retail | 2 | $95B |
|
||
| Industrial Conglomerate | 1 | $38B |
|
||
| Metals / Steel | 1 | $35B |
|
||
| Utilities | 1 | $30B |
|
||
| Industrial Machinery | 1 | $19B |
|
||
Price history
-43.0% since first listed3 events — show timeline
- 2026-05-20 Pending — CANOPYMLS as Distributed by MLS Grid
- 2026-05-18 Listed $307,584 CANOPYMLS as Distributed by MLS Grid
- 2006-09-29 Sold (Public Records) $540,000 Public Records
Property tax history
-3.0%/yrLatest (2025): $1,702 · +1.5% YoY. Source: county tax records.
Cash-flow waterfall
monthlySold comps — $/sqft
last 12 mo · ≤1 miLoading sold comps…