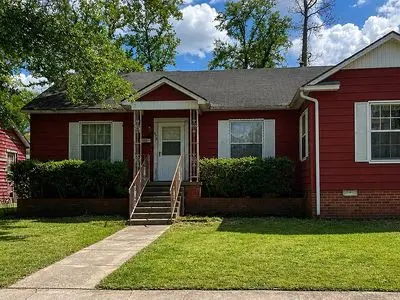
429 Melrose St · El Dorado, AR
Flood risk 1/10 · Minimal
- FEMA flood zone
- X (unshaded)
- Chance of flooding over 30 yrs
- 0.0%
- Est. flood insurance / yr
- $507 – $1,088
Fire risk 3/10 · Minor
- Est. fire insurance / yr
- $1,499 – $2,785
Heat risk 7/10 · Major
- Hot days now (above 111°F)
- 7 days/yr
- Hot days in 30 yrs
- 21 days/yr
Wind risk 6/10 · Moderate
- Chance of severe wind over 30 yrs
- 36.0%
Air-quality risk 1/10 · Minimal
- Unhealthy air days now
- 0 days/yr
- Unhealthy air days in 30 yrs
- 0 days/yr
Risk factors via First Street. Map © Google.
Why this score? — see what drove the B- grade
The composite is a weighted blend of 9 inputs, each scored 0–100. Each bar is that input's sub-score; the figure is the points it added to the 100-point composite (weight × sub-score).
- Cash flow +30.0/30.0
- 1% rule +10.0/10.0
- DSCR +10.0/10.0
- ARV discount +7.5/15.0
- Livability +3.5/5.0
- Schools +2.7/10.0
- Rent growth +2.5/5.0
- Condition / age +2.5/5.0
- Appreciation +0.0/10.0
$70,000
🖨 Deal sheet (PDF) 📄 Offer letter ✓ Due diligence
Listing remarks
Investor special with upside in a solid residential pocket of El Dorado. Main home offers approx. 2,019 sq ft, 3 bedrooms and 2 baths with a traditional layout and functional flow. Appraisal reflects overall condition as needing significant updates, making this a strong value-add opportunity for renovation, resale, or long-term hold strategy. A major bonus feature sets this property apart: a 456 sq ft bonus room located above the garage with a full bathroom & acirc; & euro; & rdquo; NOT included in the listed square footage. Ideal for guest suite, rental income potential, office, or studio setup. Property sits on a standard residential lot with mature surroundings and off-street
Key facts
- Office
- Full bathroom
- Bonus room
Tags
Neighborhood map
What this means for you Summary
Snapshot
- This is a 3-bed/2.0-bath single-family listed at $70k.
Deal economics
- At list price, monthly cash flow is $552 ($7k/yr) — positive.
- The deal already cash-flows at list — no discount required.
- Meets the 1% rule at list price ($1k rent vs $70k).
- Recommended offer: $68k (3.0% below list) — sets the bar for market timing.
- Cap rate 15.8% vs local median 4.1% in El Dorado — top-decile yield for the area; either an underpriced asset or a hidden risk that comps aren't pricing in. Stress-test before assuming the spread holds.
Location & tenants
- Location reads 69/100 on livability (#65 in AR) — a middle-class / working-renter tenant base. Strengths: cost of living A+, housing A+, health & safety A+; Watch: commute C-, employment D, crime F.
- El Dorado School District (town): math 32% / reading 34% proficiency, ranked #134 of 238 in AR (top 56%) — families likely to look elsewhere, expect single-tenant / working-renter base with shorter leases; 61% free/reduced lunch — lower-income household profile, screen leases tightly.
- Zoned schools: Yocum Elementary School (math 42% / reading 22%, grade F, #278 of 454 statewide, top 64%, 596 students, 100% FRL); Barton Jr. High School (math 31% / reading 35%, grade F, #131 of 201 statewide, top 65%, 616 students, 100% FRL); El Dorado High School (math 19% / reading 32%, grade F, #182 of 292 statewide, top 63%, 1,303 students, 100% FRL) — zoned schools average 100% FRL vs 61% district-wide (39 pts higher); higher-poverty schools than district average — tighter screening recommended.
- Market conditions: 126 active listings in the ZIP; 20 units permitted in Union County in 2024 (0 in 5+ unit buildings).
Forward outlook
- Local home prices are declining (-3.0%/yr); year-one equity from $484 of loan paydown is wiped out by about $2k of value loss. Plan a longer hold.
- Union County population projected at -21% by 2050 — secular population decline; favor cash flow + early exit over multi-decade hold.
- At projected returns (-3.0% appreciation + 3.0% rent growth), your $20k cash investment doubles in ~4 years — after that, you're playing with house money.
Negotiation context
- It's been on market 32 days — a 3% lower offer ($68k) is reasonable based on typical stale-listing flexibility.
Risks & watch-outs
- Climate carrying-cost: major wind risk, 36% chance of damaging wind over 30y; extreme-heat days projected 7→21/yr by 2055 (HVAC capex compounding) — expect insurance premiums to compound above CPI over the hold.
Questions for the listing agent
- It's been on market 32 days. Have you received any prior offers? Is the seller open to a 3% concession, seller financing, or rate buy-down credit?
- Is there a deadline driving the sale (1031 exchange, divorce, estate, relocation)? That informs how much negotiation room exists.
- Schools are D-rated, which usually means shorter tenancies and higher turnover. Who's the typical renter profile here, and what's been the actual vacancy rate?
- Crime grade is F in this area — have there been break-ins, vandalism, or insurance claims at this property in the last 3 years? What carrier currently insures it and at what premium?
- What's the average days-on-market for RENTAL listings here right now (not sales)? A rising rental-DOM trend means longer vacancies and softer asking-rent achievability than the comps imply.
- What's the recent tenant-quality profile in this submarket — average credit score on applications, eviction rate, late-payment / NSF rate, and stable-employment percentage? A property-management company in the area should have these aggregated.
- How much new for-sale + rental construction is in the pipeline within 1–3 miles? Heavy new supply typically softens prices + rents 12–24 months out; constrained supply supports both.
Investment metrics
- 1% rule
- 1.74% ✓
- Cap rate
- 15.76%
- Cash-on-cash
- 33.81%
- DSCR
- 2.50
- GRM
- 4.8
CMA / ARV
- ARV (on-the-fly)
- $206,412
- Comps found
- 12
Show comp detail 12 sales within ~0.75 mi
| Address | Dist | Beds/Ba | Sqft | Sold | Price | $/sf | Match |
|---|---|---|---|---|---|---|---|
| 207 Oakhurst Blvd | 0.12mi | 3/1.0 | 1,893 (-6%) | 7mo | $189,000 | $100 | 75 |
| 1223 N Newton | 0.25mi | 4/2.0 (+1) | 1,864 (-7%) | 6mo | $94,940 | $51 | 66 |
| 703 E 8th St | 0.73mi | 3/2.0 | 2,023 (+1%) | 5mo | $210,000 | $104 | 60 |
| 1213 Cypress Dr | 0.64mi | 4/2.0 (+1) | 1,980 (-1%) | 9mo | $235,000 | $119 | 56 |
| 143 N Broadway Blvd | 0.55mi | 2/3.0 (-1) | 2,095 (+4%) | 6mo | $135,000 | $64 | 52 |
| 1338 N Madison | 0.53mi | 3/2.5 | 2,256 (+13%) | 1mo | $85,000 | $38 | 52 |
| 612 E 7th St | 0.68mi | 3/2.5 | 1,926 (-4%) | 11mo | $85,000 | $44 | 51 |
| 707 E 8th St | 0.75mi | 3/2.0 | 1,902 (-5%) | 11mo | $195,000 | $103 | 48 |
| 1114 W 4th St | 0.74mi | 4/2.0 (+1) | 1,760 (-12%) | 1mo | $199,000 | $113 | 39 |
| 1211 Janwood St | 0.71mi | 3/2.0 | 1,738 (-13%) | 11mo | $205,000 | $118 | 36 |
| 2022 N Calion Rd | 0.71mi | 3/3.0 | 2,255 (+12%) | 8mo | $230,000 | $102 | 35 |
| 1225 Briarwood Dr | 0.75mi | 2/2.5 (-1) | 2,300 (+15%) | 3mo | $240,000 | $104 | 31 |
Match score weights: distance 35% · size 25% · config 20% · recency 20%. Top-matched comps best support the ARV.
Projected returns pro-forma
-3.0% appreciation · 3.0% rent growth · sell at horizon
- IRR
- 29.1%
- Equity multiple
- 2.21×
- Total profit
- $23,798
- Equity at exit
- $10,437
- IRR
- 36.5%
- Equity multiple
- 4.36×
- Total profit
- $65,898
- Equity at exit
- $6,052
Cash invested: $19,600 (down + closing). Projections, not guarantees.
Landlord ↔ Tenant lean methodology
- Overall (STATE)
- 92 Strongly Landlord-Friendly
- State Arkansas
- 92 Strongly Landlord-Friendly · R+14
- County
- — inherits STATE
- City
- — inherits STATE
ZIP-level market 71730
- Home prices YoY
- -18.5%
- Active inventory
- 126
- Price-to-rent
- 4.8×
Monthly cashflow live
- Estimated rent
- $1,219 medium interval (Pro) →
- Mortgage (P&I)
- −$367
- Tax from tax record
- −$14 /mo · $172/yr
- Insurance
- −$29
- HOA
- −$0
- Vacancy / Maint / Mgmt
- −$256
- Net cashflow
- $552
Break-even live
Sensitivity live
| Price | -10% $592 | -5% $572 | +0% $552 | +5% $532 | +10% $513 |
|---|---|---|---|---|---|
| Rent | -10% $456 | -5% $504 | +0% $552 | +5% $600 | +10% $648 |
| Rate | -1.0pp $587 | -0.5pp $570 | base $552 | +0.5pp $534 | +1.0pp $516 |
UW: 25.0% down · 7.5% · 30yr · 1.5% tax · 5.0% vac · 8.0% maint · 8.0% mgmt
Financing live
Cash to close
- Down payment
- $17,500
- Closing costs
- $2,100
- Reserves months
- —
- Total cash needed
- —
Loan-product check · same deal, 3 products live
Conventional
25% down · 7.5% · 30yr
- Down + closing
- —
- Monthly P&I
- —
- Monthly cashflow
- —
- DSCR
- —
- Eligible?
- —
Personal DTI + credit; lowest rate.
DSCR
20% down · 8.5% · 30yr
- Down + closing
- —
- Monthly P&I
- —
- Monthly cashflow
- —
- DSCR
- —
- Eligible?
- —
No personal income docs; deal must DSCR.
Hard money
10% down · 12.0% · 12mo
- Down + closing
- —
- Monthly P&I
- —
- Monthly cashflow
- —
- DSCR
- —
- Eligible?
- —
Short-term bridge; refi at stabilization.
Listing history 18 events
-
2026-06-21days on market $70,000 Active 32 DOM
-
2026-06-19days on market $70,000 Active 30 DOM
-
2026-06-18days on market $70,000 Active 29 DOM
-
2026-06-17days on market $70,000 Active 28 DOM
-
2026-06-16days on market $70,000 Active 27 DOM
-
2026-06-15days on market $70,000 Active 26 DOM
-
2026-06-14days on market $70,000 Active 24 DOM
-
2026-06-12days on market $70,000 Active 23 DOM
-
2026-06-09days on market $70,000 Active 20 DOM
-
2026-06-08days on market $70,000 Active 19 DOM
-
2026-06-07days on market $70,000 Active 18 DOM
-
2026-06-07days on market $70,000 Active 17 DOM
-
2026-06-04days on market $70,000 Active 14 DOM
-
2026-06-02days on market $70,000 Active 13 DOM
-
2026-06-01days on market $70,000 Active 12 DOM
-
2026-05-31days on market $70,000 Active 11 DOM
-
2026-05-31days on market $70,000 Active 10 DOM
-
2026-05-21$70,000 Active
ⓘ Source: listings_history table (triggers on properties + properties_extension) + one-shot
backfill from property_details.listing_events for pre-trigger history.
Tax reassessment forecast AR · Resets to sale price
- Current annual tax
- $172 · $14/mo
- Projected year-2 tax
- $448 · $37/mo
- Expected delta
- +$276/yr (+$23/mo · 159.9%)
ⓘ Screening estimate from a state-policy table — verify with the county assessor before closing.
Climate risk First Street
- Flood 1/10 Low FEMA zone X (unshaded) · 0% chance over 30 yrs
- Wildfire 3/10 Moderate
- Heat 7/10 Severe 7 d/yr ≥111°F today · 21 d/yr by 30 yrs out
- Wind 6/10 Major 36% chance of damaging wind over 30 yrs
- Air quality 1/10 Low 0 unhealthy d/yr today · 0 by 30 yrs out
Nearby sold comps map
Loading sold comps map…
Walkable amenities ~0.75 mi
Loading nearby amenities…
Taxation est. · year 1
- Rental income
- $14,625
- − Mortgage interest
- −$3,921
- − Property taxes
- −$172
- − Insurance
- −$350
- − Repairs & maintenance
- −$1,170
- − Management
- −$1,170
- − Depreciation
- −$2,036
- Taxable income
- $5,805
- Est. tax owed @ 24.0%
- −$1,393
- After-tax cash flow
- $5,233/yr
For passive investors: Depreciation is non-cash, so a rental often shows a tax loss while cash-flowing — sheltering income. Rental losses are passive: they offset passive income freely, and up to $25,000/yr can offset ordinary (W-2) income if you actively participate and your MAGI is under $100k (phasing out to $0 by $150k); unused losses carry forward. On sale, claimed depreciation is recaptured at up to 25%, and gains may owe capital-gains tax (a 1031 exchange can defer both). Figures are a year-1 estimate at your 24.0% rate — not tax advice; consult a CPA.
Schools (NCES district)
- District
- El Dorado School District
- NCES district ID
- 0505680
- Math proficiency
- 32% ▼ -6.00%
- Reading proficiency
- 34% ▼ -6.00%
- Median HH income
- $36,122
- Composite
- 27.36/100
- National rank
- #6979
- State rank
- #134 of 238 in AR
Livability — El Dorado
- Score
- 69/100
- State rank
- #65
- US rank
- #8444
Category grades
Schools grade is shown separately in the Schools card above.
Census & demographics
- Census place
- El Dorado, AR
- Population (ZIP)
- 29,187
Population outlook (Union County) Hauer SSP2
- Today (2025)
- 37,422 people
- By 2030
- 35,808 · -4.3%
- By 2040
- 32,605 · -12.9%
- By 2050
- 29,688 · -20.7%
- By 2075
- 23,691 · -36.7%
- By 2100
- 17,950 · -52.0%
Race, ethnicity, and origin ACS 2023
- Neighborhood character
- Diverse neighborhood (Simpson 0.55)
- Race & ethnicity
- White 58% Black 32% Hispanic / Latino 6% Two or more races 4% Asian 1%
- Hispanic origin (detail)
- Mexican 5%
- Common ancestry
- Lithuanian 1% Italian 1% Serbian 1%
- Foreign-born
- 4% · Canada, China
- Languages at home
- 95% English-only · Spanish 4% Chinese 1%
Political lean MEDSL · Union
- 2024 margin
- Solid R (+33.5) · D 32.5% · R 66.0% · Other 1.5%
- 2008→2024 swing
- -7.4pp toward R · 2008: -26.1pp · 2024: -33.5pp
- All cycles
- 2024: R+33.5 2020: R+29.5 2016: R+27.8 2012: R+26.3 2008: R+26.1
Not yet ingested
- Civics
- —
Market trends
- HPI YoY
- ▼ -35.36%
- Current HPI
- 155.8786
- Rent YoY
- —
- Metro
- —
- State GDP YoY
- ▲ 3.80%
- F500 in state
- 10
Industry mix (Fortune 500 HQ in AR)
| Industry | F500 HQs | Revenue |
|---|---|---|
| Retail | 1 | $681B |
|
||
| Food / Agriculture | 1 | $53B |
|
||
| Retail / Energy | 1 | $22B |
|
||
| Transportation / Logistics | 1 | $12B |
|
||
| Energy | 1 | $4B |
|
||
Price history
1 event — show timeline
- 2026-05-21 Listed $70,000 FSBO.com
Property tax history
-2.9%/yrLatest (2025): $172 · -11.2% YoY. Source: county tax records.
Cash-flow waterfall
monthlySold comps — $/sqft
last 12 mo · ≤1 miLoading sold comps…