2509 Larry St SW · Huntsville, AL
Flood risk 1/10 · Minimal
- FEMA flood zone
- X (unshaded)
- Chance of flooding over 30 yrs
- 0.0%
- Est. flood insurance / yr
- $507 – $1,088
Fire risk 1/10 · Minimal
- Est. fire insurance / yr
- $916 – $1,700
Heat risk 6/10 · Moderate
- Hot days now (above 105°F)
- 7 days/yr
- Hot days in 30 yrs
- 20 days/yr
Wind risk 4/10 · Minor
- Chance of severe wind over 30 yrs
- 17.0%
Air-quality risk 2/10 · Minimal
- Unhealthy air days now
- 1 days/yr
- Unhealthy air days in 30 yrs
- 1 days/yr
Risk factors via First Street. Map © Google.
Why this score? — see what drove the D+ grade
The composite is a weighted blend of 9 inputs, each scored 0–100. Each bar is that input's sub-score; the figure is the points it added to the 100-point composite (weight × sub-score).
- Cash flow +16.6/30.0
- ARV discount +11.1/15.0
- DSCR +5.1/10.0
- Livability +4.1/5.0
- 1% rule +3.5/10.0
- Rent growth +3.0/5.0
- Schools +2.9/10.0
- Condition / age +2.5/5.0
- Appreciation +0.0/10.0
$135,000
🖨 Deal sheet (PDF) 📄 Offer letter ✓ Due diligence
Listing remarks
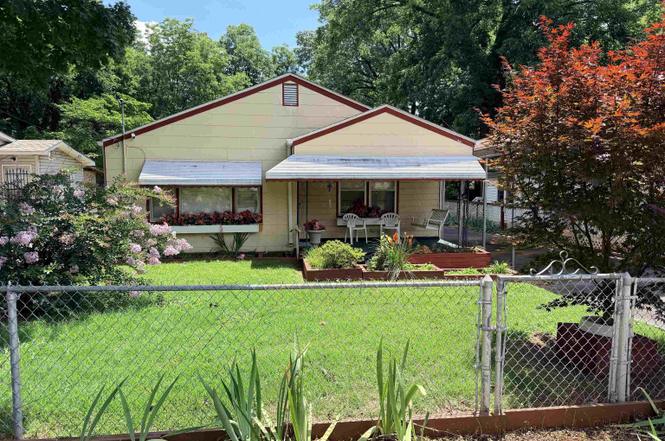
Opportunity awaits at 2509 Larry St! This 2-bedroom, 1-bath home offers great potential for investors, flippers, or buyers looking to add their personal touch. Conveniently located near shopping, dining, and major roadways. Property is being sold AS-IS, WHERE-IS. Buyer to verify all information deemed important.
Key facts
- 0.23 acre lot
- Listed 4 days
Property features AI
Finance
- Other: Lot size about 0.23 acres; Directions: Go south on Memorial Parkway, right on Bob Wallace, right onto Larry St — house on the left
- HOA & community: No association
Exterior
- Parking: Detached carport
- Utilities: Public sewer; Public water
- Home design: Single family residence; Residential property; Living area approximately 1,000; Not new construction
- Construction: No fireplaces
- Exterior features: Public water; Public sewer; Lot in Westlawn subdivision
Interior
- Bathrooms: 1 full bathroom
- Heating & cooling: Cooling: Other; Heating: See remarks
- Interior features: 5 total rooms; Crawl space basement
Neighborhood map
What this means for you Summary
Snapshot
- This is a 2-bed/1.0-bath single-family listed at $135k.
Deal economics
- At list price, monthly cash flow is $81 ($970/yr) — positive.
- The deal already cash-flows at list — no discount required.
- To meet the 1% rule (rent ≥ 1% of price), the offer needs to be $115k (14.9% below list).
- Recommended offer: $115k (14.9% below list) — sets the bar for 1% rule.
- Cap rate 7.0% vs local median 3.8% in Huntsville — top-decile yield for the area; either an underpriced asset or a hidden risk that comps aren't pricing in. Stress-test before assuming the spread holds.
Location & tenants
- Location reads 82/100 on livability (#3 in AL, #1,082 nationally) — a professional / high-income tenant draw. Strengths: commute A+, cost of living A+, housing A+; Watch: crime F.
- Huntsville City (urban): math 21% / reading 46% proficiency, ranked #48 of 129 in AL (top 37%) — families likely to look elsewhere, expect single-tenant / working-renter base with shorter leases.
- Zoned schools: Morris Elementary School (math 5% / reading 31%, grade F, #481 of 627 statewide, top 77%, 515 students, 90% FRL); Columbia High School (math 12% / reading 17%, grade F, #220 of 305 statewide, top 77%, 954 students, 50% FRL) — zoned schools average 70% FRL vs 46% district-wide (24 pts higher); higher-poverty schools than district average — tighter screening recommended.
- Zoned-school proficiency averages 16% at this address vs 34% district-wide (-17 pts) — the specific schools serving this property underperform the Huntsville City average; the district grade overstates school quality for this exact location.
- Market conditions: Rents rising (+1.8%/yr); 133 active listings in the ZIP; 40 comparable units currently listed for rent nearby; rentals at typical pace (median 25d on market — plan ~3-4 weeks tenant-placement turnaround); 42% of comp listings sitting > 30 days — soft ceiling on asking rent; lower-income renter base — watch delinquency; 4,709 units permitted in Madison County in 2024 (1,186 in 5+ unit buildings).
- This rent runs 39% of the median local income ($35k/yr) — at the standard rent-burdened threshold; future hikes will face affordability resistance.
Forward outlook
- Local home prices are declining (-3.0%/yr); year-one equity from $933 of loan paydown is wiped out by about $4k of value loss. Plan a longer hold.
- Madison County population projected at +18% by 2050 — long-run rental-demand tailwind backs the buy-and-hold thesis.
Negotiation context
- Only 4 days on market — expect competitive offers; lowballing is unlikely to land.
Risks & watch-outs
- Watch-outs: built in 1945 — expect roof / HVAC / electrical / plumbing capex.
- Climate carrying-cost: extreme-heat days projected 7→20/yr by 2055 (HVAC capex compounding) — expect insurance premiums to compound above CPI over the hold.
Questions for the listing agent
- Built in 1945 — when were the roof, HVAC, electrical panel, plumbing, and water heater last replaced?
- Is there a deadline driving the sale (1031 exchange, divorce, estate, relocation)? That informs how much negotiation room exists.
- Crime grade is F in this area — have there been break-ins, vandalism, or insurance claims at this property in the last 3 years? What carrier currently insures it and at what premium?
- The area grade is low — what's the realistic commute time and amenity access for the typical tenant pool here? Any planned neighborhood developments (good or bad) we should know about?
- What's the average days-on-market for RENTAL listings here right now (not sales)? A rising rental-DOM trend means longer vacancies and softer asking-rent achievability than the comps imply.
- What's the recent tenant-quality profile in this submarket — average credit score on applications, eviction rate, late-payment / NSF rate, and stable-employment percentage? A property-management company in the area should have these aggregated.
- How much new for-sale + rental construction is in the pipeline within 1–3 miles? Heavy new supply typically softens prices + rents 12–24 months out; constrained supply supports both.
Investment metrics
- 1% rule
- 0.85% ✗
- Cap rate
- 7.01%
- Cash-on-cash
- 2.57%
- DSCR
- 1.11
- GRM
- 9.8
CMA / ARV
- ARV (on-the-fly)
- $146,700
- Comps found
- 12
Show comp detail 12 sales within ~0.75 mi
| Address | Dist | Beds/Ba | Sqft | Sold | Price | $/sf | Match |
|---|---|---|---|---|---|---|---|
| 2501 #1-2 SW 15th St | 0.09mi | 2/1.0 | 920 (+2%) | 12mo | $150,000 | $163 | 82 |
| 3919 Beech Ave | 0.19mi | 2/1.0 | 841 (-7%) | 3mo | $100,000 | $119 | 77 |
| 3811 8th Ave SW | 0.22mi | 2/1.0 | 960 (+7%) | 3mo | $200,000 | $208 | 76 |
| 3916 Birch Ave SW | 0.16mi | 2/1.0 | 986 (+10%) | 1mo | $158,700 | $161 | 75 |
| 3810 9th Ave | 0.20mi | 2/1.0 | 861 (-4%) | 16mo | $171,500 | $199 | 70 |
| 3900 Birch Ave SW | 0.21mi | 2/1.0 | 1,008 (+12%) | 2mo | $179,000 | $178 | 68 |
| 3921 Pine Ave | 0.27mi | 2/1.0 | 955 (+6%) | 11mo | $110,000 | $115 | 68 |
| 2105 North Rose Dr SW | 0.26mi | 2/1.0 | 1,008 (+12%) | 1mo | $129,000 | $128 | 67 |
| 3513 7th Ave | 0.47mi | 2/1.0 | 888 (-1%) | 16mo | $80,000 | $90 | 63 |
| 2105 Sycamore St | 0.27mi | 2/1.0 | 1,015 (+13%) | 19mo | $180,000 | $177 | 50 |
| 2912 Hillsboro Rd | 0.70mi | 3/1.0 (+1) | 925 (+3%) | 19mo | $172,000 | $186 | 42 |
| 410 Warner St NW | 0.75mi | 3/2.0 (+1) | 1,033 (+15%) | 5mo | $144,000 | $139 | 28 |
Match score weights: distance 35% · size 25% · config 20% · recency 20%. Top-matched comps best support the ARV.
Projected returns pro-forma
-3.0% appreciation · 1.82% rent growth · sell at horizon
- IRR
- -13.5%
- Equity multiple
- 0.52×
- Total profit
- $-18,124
- Equity at exit
- $20,129
- IRR
- -6.4%
- Equity multiple
- 0.61×
- Total profit
- $-14,751
- Equity at exit
- $11,672
Cash invested: $37,800 (down + closing). Projections, not guarantees.
Landlord ↔ Tenant lean methodology
- Overall (STATE)
- 90 Strongly Landlord-Friendly
- State Alabama
- 90 Strongly Landlord-Friendly · R+15
- County
- — inherits STATE
- City
- — inherits STATE
ZIP-level market 35805
- Home prices YoY
- -17.4%
- Rents YoY
- 1.8%
- Active inventory
- 133
- Price-to-rent
- 9.8×
Monthly cashflow live
- Estimated rent
- $1,149 high interval (Pro) →
- Mortgage (P&I)
- −$708
- Tax from tax record
- −$63 /mo · $751/yr
- Insurance
- −$56
- HOA
- −$0
- Vacancy / Maint / Mgmt
- −$241
- Net cashflow
- $81
Break-even live
Sensitivity live
| Price | -10% $157 | -5% $119 | +0% $81 | +5% $43 | +10% $4 |
|---|---|---|---|---|---|
| Rent | -10% $-10 | -5% $35 | +0% $81 | +5% $126 | +10% $172 |
| Rate | -1.0pp $149 | -0.5pp $115 | base $81 | +0.5pp $46 | +1.0pp $10 |
UW: 25.0% down · 7.5% · 30yr · 1.5% tax · 5.0% vac · 8.0% maint · 8.0% mgmt
Financing live
Cash to close
- Down payment
- $33,750
- Closing costs
- $4,050
- Reserves months
- —
- Total cash needed
- —
Loan-product check · same deal, 3 products live
Conventional
25% down · 7.5% · 30yr
- Down + closing
- —
- Monthly P&I
- —
- Monthly cashflow
- —
- DSCR
- —
- Eligible?
- —
Personal DTI + credit; lowest rate.
DSCR
20% down · 8.5% · 30yr
- Down + closing
- —
- Monthly P&I
- —
- Monthly cashflow
- —
- DSCR
- —
- Eligible?
- —
No personal income docs; deal must DSCR.
Hard money
10% down · 12.0% · 12mo
- Down + closing
- —
- Monthly P&I
- —
- Monthly cashflow
- —
- DSCR
- —
- Eligible?
- —
Short-term bridge; refi at stabilization.
Rent comps 40 comps
| Address | Beds | Baths | Sqft | Rent | $/sqft | DOM | Units | Dist |
|---|---|---|---|---|---|---|---|---|
| 4013 9th Ave SW Huntsville, AL | 2.0 | 1.0 | 1060 | $1,098 | $1.04 | 45d | 1 | 0.06mi |
| 4112 17th St SW Unit C Huntsville, AL | 2.0 | 2.0 | 750 | $1,095 | $1.46 | 45d | 1 | 0.09mi |
| 4112 17th St SW Unit B Huntsville, AL | 1.0 | 1.0 | 750 | $895 | $1.19 | 15d | 1 | 0.09mi |
| 4306 9th Ave SW Huntsville, AL | 2.0 | 1.0 | 745 | $1,175 | $1.58 | 25d | 1 | 0.31mi |
| 3801 6th Ave SW Huntsville, AL | 2.0 | 2.0 | 953 | $1,325 | $1.39 | 25d | 2 | 0.36mi |
| 2308 Wind Trace Cir SW Huntsville, AL | 1.0 | 1.0 | 600 | $925 | $1.54 | 45d | 1 | 0.39mi |
| 4405 Judith Ln SW Huntsville, AL | 1.0–3.0 | 1.0–2.0 | 937 | $974 | $1.04 | 45d | 8 | 0.42mi |
| 4523 Judith Ln SW Huntsville, AL | 1.0 | 1.0 | 550 | $850 | $1.55 | 45d | 2 | 0.43mi |
| 3700 Governors Dr SW Huntsville, AL | 3.0 | 1.0–2.0 | 1547 | $2,032 | $1.31 | 15d | 58 | 0.54mi |
| 4611 Governors House Dr SW Huntsville, AL | 3.0 | 1.0–2.0 | 1149 | $1,631 | $1.42 | 15d | 12 | 0.55mi |
| 3204 Berkley St SW Huntsville, AL | 3.0 | 1.5 | 1118 | $1,400 | $1.25 | 25d | 1 | 0.74mi |
| 407 Warner St NW Huntsville, AL | 3.0 | 1.0 | 1015 | $1,295 | $1.28 | 25d | 1 | 0.74mi |
| 3218 Joslin St SW Huntsville, AL | 3.0 | 1.5 | 1107 | $1,495 | $1.35 | 25d | 1 | 0.84mi |
| 2900 4th Ave NW Huntsville, AL | 2.0 | 1.0–2.0 | 765 | $1,804 | $2.36 | 15d | 81 | 0.85mi |
| 3210 Clopton St SW Huntsville, AL | 2.0 | 1.0 | 812 | $960 | $1.18 | 15d | 1 | 0.85mi |
| 3208 Clopton St SW Huntsville, AL | 2.0 | 1.0 | 812 | $960 | $1.18 | 23d | 1 | 0.85mi |
| 3218 Fairacres Rd SW Huntsville, AL | 3.0 | 1.5 | 1105 | $1,300 | $1.18 | 45d | 1 | 0.86mi |
| 604 Austin Dr NW Huntsville, AL | 3.0 | 1.0 | 1075 | $1,350 | $1.26 | 25d | 1 | 0.89mi |
| 603 Austin Dr NW Huntsville, AL | 3.0 | 1.0 | 1086 | $1,450 | $1.34 | 45d | 1 | 0.89mi |
| 3009 Hillsboro Rd SW Huntsville, AL | 3.0 | 1.0 | 1000 | $1,250 | $1.25 | 25d | 1 | 0.90mi |
| 608 Austin Dr NW Huntsville, AL | 3.0 | 1.5 | 1100 | $1,350 | $1.23 | 25d | 1 | 0.91mi |
| 3502 Penny St SW Unit B Huntsville, AL | 3.0 | 2.0 | 1000 | $1,200 | $1.20 | 45d | 1 | 0.92mi |
| 2999 Woodway Dr SW Huntsville, AL | 1.0–2.0 | 1.0 | 676 | $915 | $1.35 | 15d | 1 | 0.94mi |
| 3606 Mc Vay St SW Unit A Huntsville, AL | 2.0 | 1.0 | 754 | $900 | $1.19 | 23d | 1 | 0.98mi |
| 3111 Hale Dr SW Huntsville, AL | 3.0 | 1.5 | 1100 | $1,550 | $1.41 | 23d | 1 | 1.01mi |
| 612 Marguerite Dr NW Huntsville, AL | 3.0 | 1.0 | 1040 | $1,400 | $1.35 | 45d | 1 | 1.01mi |
| 3209 Westheimer Dr SW Unit 06 Huntsville, AL | 1.0 | 1.0 | 553 | $810 | $1.46 | 45d | 1 | 1.02mi |
| 3621 N Crestview Dr NW Unit 2 Huntsville, AL | 2.0 | 1.5 | 900 | $895 | $0.99 | 45d | 1 | 1.05mi |
| 3615 N Crestview Dr NW Unit 2 Huntsville, AL | 2.0 | 1.5 | 920 | $795 | $0.86 | 25d | 1 | 1.05mi |
| 1208 Julia St NW Huntsville, AL | 2.0 | 1.0 | 800 | $745 | $0.93 | 25d | 1 | 1.14mi |
| 3016 Holmes Ave NW Huntsville, AL | 3.0 | 1.0 | 1092 | $1,275 | $1.17 | 25d | 1 | 1.15mi |
| 905 Fairway Dr NW Huntsville, AL | 2.0 | 1.0 | 1000 | $995 | $0.99 | 45d | 1 | 1.18mi |
| 2714 7th Ave SW Unit D Huntsville, AL | 1.0 | 1.0 | 1000 | $795 | $0.80 | 45d | 1 | 1.18mi |
| 3803 McVay St SW Huntsville, AL | 1.0 | 1.0 | 865 | $850 | $0.98 | 45d | 1 | 1.20mi |
| 3801 Thomas Rd SW Unit 3917-05 Huntsville, AL | 1.0 | 1.0 | 550 | $725 | $1.32 | 25d | 1 | 1.20mi |
| 3801 Thomas Rd SW Unit 3807-09 Huntsville, AL | 3.0 | 2.0 | 950 | $1,225 | $1.29 | 25d | 1 | 1.20mi |
| 3801 Thomas Rd SW Unit 3917-08 Huntsville, AL | 1.0 | 1.0 | 550 | $725 | $1.32 | 45d | 1 | 1.20mi |
| 3801 Thomas Rd SW Unit 3912-06 Huntsville, AL | 2.0 | 1.0 | 795 | $925 | $1.16 | 45d | 1 | 1.20mi |
| 3801 Thomas Rd SW Unit 3814-01 Huntsville, AL | 2.0 | 1.0 | 825 | $1,025 | $1.24 | 45d | 1 | 1.20mi |
| 3801 Thomas Rd SW Unit 3910-E Huntsville, AL | 2.0 | 1.0 | 795 | $925 | $1.16 | 25d | 1 | 1.20mi |
Listing history 3 events
-
2026-06-22days on market $135,000 Active 4 DOM
-
2026-06-18remarks 313-char remark
-
2026-06-18$135,000 Active 1 DOM
ⓘ Source: listings_history table (triggers on properties + properties_extension) + one-shot
backfill from property_details.listing_events for pre-trigger history.
Tax reassessment forecast AL · Resets to sale price
- Current annual tax
- $751 · $63/mo
- Projected year-2 tax
- $751 · $63/mo
- Expected delta
- $0/yr ($0/mo · 0.0%)
ⓘ Screening estimate from a state-policy table — verify with the county assessor before closing.
Climate risk First Street
- Flood 1/10 Low FEMA zone X (unshaded) · 0% chance over 30 yrs
- Wildfire 1/10 Low
- Heat 6/10 Major 7 d/yr ≥105°F today · 20 d/yr by 30 yrs out
- Wind 4/10 Moderate 17% chance of damaging wind over 30 yrs
- Air quality 2/10 Low 1 unhealthy d/yr today · 1 by 30 yrs out
Nearby sold comps map
Loading sold comps map…
Walkable amenities ~0.75 mi
Loading nearby amenities…
Taxation est. · year 1
- Rental income
- $13,786
- − Mortgage interest
- −$7,562
- − Property taxes
- −$751
- − Insurance
- −$675
- − Repairs & maintenance
- −$1,103
- − Management
- −$1,103
- − Depreciation
- −$3,927
- Taxable loss
- −$1,335
- Est. tax savings @ 24.0%
- +$320
- After-tax cash flow
- $1,290/yr
For passive investors: Depreciation is non-cash, so a rental often shows a tax loss while cash-flowing — sheltering income. Rental losses are passive: they offset passive income freely, and up to $25,000/yr can offset ordinary (W-2) income if you actively participate and your MAGI is under $100k (phasing out to $0 by $150k); unused losses carry forward. On sale, claimed depreciation is recaptured at up to 25%, and gains may owe capital-gains tax (a 1031 exchange can defer both). Figures are a year-1 estimate at your 24.0% rate — not tax advice; consult a CPA.
Schools (NCES district)
- District
- Huntsville City
- NCES district ID
- 0101800
- Math proficiency
- 21% ▼ -23.00%
- Reading proficiency
- 46% ▬ 0.00%
- Median HH income
- $48,264
- Composite
- 28.84/100
- National rank
- #6647
- State rank
- #48 of 129 in AL
Livability — Huntsville
- Score
- 82/100
- State rank
- #3
- US rank
- #1082
Category grades
Schools grade is shown separately in the Schools card above.
Census & demographics
- Census place
- Huntsville, AL
- County
- Madison County · 380,832 people
- City population
- 220,435
- Metro
- Huntsville, AL
- Population (ZIP)
- 20,856
- Household income
- $35,385
- Rent vs Own
- Severe rent burden
- 1750.0
Population outlook (Madison County) Hauer SSP2
- Today (2025)
- 392,086 people
- By 2030
- 409,788 · +4.5%
- By 2040
- 440,557 · +12.4%
- By 2050
- 460,990 · +17.6%
- By 2075
- 502,872 · +28.3%
- By 2100
- 513,623 · +31.0%
Race, ethnicity, and origin ACS 2023
- Neighborhood character
- Diverse neighborhood (Simpson 0.69)
- Race & ethnicity
- White 40% Black 31% Hispanic / Latino 24% Two or more races 8%
- Hispanic origin (detail)
- Mexican 17% Puerto Rican 2%
- Common ancestry
- Lithuanian 1% Slovak 1% Serbian 1%
- Foreign-born
- 16% · Canada, Jamaica
- Languages at home
- 76% English-only · Spanish 22% German/W. Germanic 1%
Political lean MEDSL · Madison
- 2024 margin
- Lean R (+9.0) · D 44.7% · R 53.7% · Other 1.6%
- 2008→2024 swing
- +6.0pp toward D · 2008: -14.9pp · 2024: -9.0pp
- All cycles
- 2024: R+9.0 2020: R+8.0 2016: R+16.8 2012: R+18.7 2008: R+14.9
Not yet ingested
- Civics
- —
Market trends
- HPI YoY
- ▼ -48.03%
- Current HPI
- 228.6963
- Rent YoY
- ▲ 1.82%
- Metro
- Huntsville, AL
- State GDP YoY
- ▲ 2.94%
- F500 in state
- 4
Industry mix (Fortune 500 HQ in AL)
| Industry | F500 HQs | Revenue |
|---|---|---|
| Financial Services | 1 | $8B |
|
||
| Healthcare | 1 | $5B |
|
||
Price history
1 event — show timeline
- 2026-06-17 Listed $135,000 VMLS
Property tax history
+14.6%/yrLatest (2024): $751 · +34.0% YoY. Source: county tax records.
Cash-flow waterfall
monthlySold comps — $/sqft
last 12 mo · ≤1 miLoading sold comps…