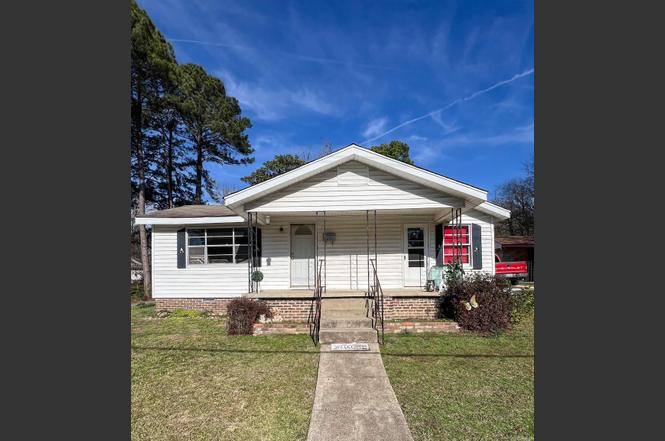
430 W Mill St · Malvern, AR
Flood risk 1/10 · Minimal
- FEMA flood zone
- X (unshaded)
- Chance of flooding over 30 yrs
- 0.0%
- Est. flood insurance / yr
- $473 – $860
Fire risk 5/10 · Moderate
- Est. fire insurance / yr
- $1,499 – $2,785
Heat risk 6/10 · Moderate
- Hot days now (above 110°F)
- 7 days/yr
- Hot days in 30 yrs
- 20 days/yr
Wind risk 4/10 · Minor
- Chance of severe wind over 30 yrs
- 17.0%
Air-quality risk 2/10 · Minimal
- Unhealthy air days now
- 0 days/yr
- Unhealthy air days in 30 yrs
- 1 days/yr
Risk factors via First Street. Map © Google.
Why this score? — see what drove the B grade
The composite is a weighted blend of 9 inputs, each scored 0–100. Each bar is that input's sub-score; the figure is the points it added to the 100-point composite (weight × sub-score).
- Cash flow +30.0/30.0
- ARV discount +15.0/15.0
- DSCR +10.0/10.0
- 1% rule +9.0/10.0
- Livability +3.1/5.0
- Rent growth +2.5/5.0
- Condition / age +2.5/5.0
- Schools +1.8/10.0
- Appreciation +0.0/10.0
$99,999
🖨 Deal sheet 📄 Offer letter ✓ Due diligence
Listing remarks MLS
Check out this great investment opportunity just minutes away from downtown Malvern!! This home is nestled in a quiet neighborhood and hosts 3 bedrooms and 2 baths with an enclosed patio and separate laundry room. Additionally, there are two storage buildings on the property with electric already hooked up. The seller has made some improvements but this home is ready for someone to give it their personal touch!
Key facts
- Storage buildings
- Quiet neighborhood
- Enclosed patio
Tags
Property features AI
Finance
- Financial info: Financing available: Conventional loan or cash
Exterior
- Parking: Garage
- Utilities: Public sewer; Public water; Municipal electric (Entergy); Natural gas
- Home design: Frame exterior; Composition siding; Composition roof; Inside city limits
- Construction: Slab/crawl combination foundation
- Exterior features: Patio; Paved road access; Corner lot; Sloped and level areas
Interior
- Kitchen: Gas range; Electric range; Refrigerator stays
- Flooring: Wood flooring; Vinyl flooring
- Bathrooms: 2 full bathrooms
- Heating & cooling: Window air conditioning units
- Interior features: Washer connection; Electric dryer connection; Paneling and sheet rock ceilings
- Laundry & utility: Laundry room; Washer and dryer hookups
Neighborhood map
What this means for you Summary
Snapshot
- This is a 3-bed/2.0-bath single-family listed at $100k.
Deal economics
- At list price, monthly cash flow is $415 ($5k/yr) — positive.
- The deal already cash-flows at list — no discount required.
- Meets the 1% rule at list price ($1k rent vs $100k).
- Cap rate 11.3% vs local median 5.3% in Malvern — top-decile yield for the area; either an underpriced asset or a hidden risk that comps aren't pricing in. Stress-test before assuming the spread holds.
Location & tenants
- Location reads 62/100 on livability (#215 in AR) — a middle-class / working-renter tenant base. Strengths: cost of living A+, housing A+, health & safety A-; Watch: schools D-, crime F, amenities F.
- Malvern School District (town): math 21% / reading 22% proficiency, ranked #207 of 238 in AR (top 87%) — low school quality limits family demand, transient renter base, plan for 1-2y turnover; 64% free/reduced lunch — lower-income household profile, screen leases tightly.
- Market conditions: 171 active listings in the ZIP; 1 comparable units currently listed for rent nearby; 4 units permitted in Hot Spring County in 2024 (0 in 5+ unit buildings).
Forward outlook
- Local home prices are declining (-3.0%/yr); year-one equity from $691 of loan paydown is wiped out by about $3k of value loss. Plan a longer hold.
- Hot Spring County population projected to shrink 3% by 2050 — rents likely to lag national; underwrite the cash flow, not the appreciation.
- At projected returns (-3.0% appreciation + 3.0% rent growth), your $28k cash investment doubles in ~7 years — after that, you're playing with house money.
Negotiation context
- Only 12 days on market — expect competitive offers; lowballing is unlikely to land.
- 9 sale attempts since 10y ago with the ask held roughly flat each time — persistent listings suggest the price (not the market) is what's stuck; bring a comps-based counter.
- Current owner paid $38k; list at $100k implies a 160% gain — meaningful room to come down on a strong offer.
Risks & watch-outs
- Watch-outs: built in 1953 — expect roof / HVAC / electrical / plumbing capex.
- Climate carrying-cost: moderate wildfire risk; extreme-heat days projected 7→20/yr by 2055 (HVAC capex compounding) — expect insurance premiums to compound above CPI over the hold.
Questions for the listing agent
- Built in 1953 — when were the roof, HVAC, electrical panel, plumbing, and water heater last replaced?
- Is there a deadline driving the sale (1031 exchange, divorce, estate, relocation)? That informs how much negotiation room exists.
- Schools are D-rated, which usually means shorter tenancies and higher turnover. Who's the typical renter profile here, and what's been the actual vacancy rate?
- Crime grade is F in this area — have there been break-ins, vandalism, or insurance claims at this property in the last 3 years? What carrier currently insures it and at what premium?
- What's the average days-on-market for RENTAL listings here right now (not sales)? A rising rental-DOM trend means longer vacancies and softer asking-rent achievability than the comps imply.
- What's the recent tenant-quality profile in this submarket — average credit score on applications, eviction rate, late-payment / NSF rate, and stable-employment percentage? A property-management company in the area should have these aggregated.
- How much new for-sale + rental construction is in the pipeline within 1–3 miles? Heavy new supply typically softens prices + rents 12–24 months out; constrained supply supports both.
Investment metrics
- 1% rule
- 1.40% ✓
- Cap rate
- 11.27%
- Cash-on-cash
- 17.78%
- DSCR
- 1.79
- GRM
- 6.0
CMA / ARV
- ARV (on-the-fly)
- $132,720
- Comps found
- 7
Show comp detail 7 sales within ~0.75 mi
| Address | Dist | Beds/Ba | Sqft | Sold | Price | $/sf | Match |
|---|---|---|---|---|---|---|---|
| 1514 Stanley St | 0.18mi | 3/2.0 | 1,598 (+1%) | 21mo | $162,200 | $102 | 72 |
| 1426 Stanley St Unit A & B | 0.19mi | 4/4.0 (+1) | 1,600 (+1%) | 8mo | $115,000 | $72 | 69 |
| 408 Vine St | 0.39mi | 3/1.0 | 1,590 (+1%) | 21mo | $10,700 | $7 | 59 |
| 927 School St | 0.66mi | 3/1.0 | 1,516 (-4%) | 10mo | $126,900 | $84 | 50 |
| 213 Oak St | 0.43mi | 3/2.0 | 1,416 (-10%) | 20mo | $117,000 | $83 | 46 |
| 604 E Highland Ave | 0.67mi | 3/2.0 | 1,688 (+7%) | 23mo | $150,000 | $89 | 38 |
| 624 Mann St | 0.71mi | 3/2.0 | 1,374 (-13%) | 16mo | $160,000 | $116 | 32 |
Match score weights: distance 35% · size 25% · config 20% · recency 20%. Top-matched comps best support the ARV.
Projected returns pro-forma
-3.0% appreciation · 3.0% rent growth · sell at horizon
- IRR
- 9.3%
- Equity multiple
- 1.37×
- Total profit
- $10,244
- Equity at exit
- $14,910
- IRR
- 18.5%
- Equity multiple
- 2.54×
- Total profit
- $43,035
- Equity at exit
- $8,646
Cash invested: $28,000 (down + closing). Projections, not guarantees.
Landlord ↔ Tenant lean methodology
- Overall (STATE)
- 92 Strongly Landlord-Friendly
- State Arkansas
- 92 Strongly Landlord-Friendly · R+14
- County
- — inherits STATE
- City
- — inherits STATE
ZIP-level market 72104
- Home prices YoY
- -7.3%
- Active inventory
- 171
- Price-to-rent
- 6.0×
Monthly cashflow live
- Estimated rent
- $1,400 medium interval (Pro) →
- Mortgage (P&I)
- −$524
- Tax est. 1.5%
- −$125 /mo · $1,500/yr
- Insurance
- −$42
- HOA
- −$0
- Vacancy / Maint / Mgmt
- −$294
- Net cashflow
- $415
Break-even live
UW: 25.0% down · 7.5% · 30yr · 1.5% tax · 5.0% vac · 8.0% maint · 8.0% mgmt
Financing live
Cash to close
- Down payment
- $25,000
- Closing costs
- $3,000
- Reserves months
- —
- Total cash needed
- —
Loan-product check · same deal, 3 products live
Conventional
25% down · 7.5% · 30yr
- Down + closing
- —
- Monthly P&I
- —
- Monthly cashflow
- —
- DSCR
- —
- Eligible?
- —
Personal DTI + credit; lowest rate.
DSCR
20% down · 8.5% · 30yr
- Down + closing
- —
- Monthly P&I
- —
- Monthly cashflow
- —
- DSCR
- —
- Eligible?
- —
No personal income docs; deal must DSCR.
Hard money
10% down · 12.0% · 12mo
- Down + closing
- —
- Monthly P&I
- —
- Monthly cashflow
- —
- DSCR
- —
- Eligible?
- —
Short-term bridge; refi at stabilization.
Rent comps 1 comps
| Address | Beds | Baths | Sqft | Rent | $/sqft | DOM | Units | Dist |
|---|---|---|---|---|---|---|---|---|
| 735 Floyd St Malvern, AR | 3.0 | 1.0 | 1168 | $1,400 | $1.20 | 14d | 1 | 1.43mi |
Listing history 11 events
-
2026-06-19days on market $99,999 Active 12 DOM
-
2026-06-18days on market $99,999 Active 11 DOM
-
2026-06-17days on market $99,999 Active 10 DOM
-
2026-06-16days on market $99,999 Active 9 DOM
-
2026-06-15statusdays on market $99,999 Active 8 DOM
-
2026-06-14days on market $99,999 New Listing 6 DOM
-
2026-06-13days on market $99,999 New Listing 5 DOM
-
2026-06-10days on market $99,999 New Listing 3 DOM
-
2026-06-09days on market $99,999 New Listing 2 DOM
-
2026-06-08remarks 415-char remark
Show marketing remark (414 chars)
Check out this great investment opportunity just minutes away from downtown Malvern!! This home is nestled in a quiet neighborhood and hosts 3 bedrooms and 2 baths with an enclosed patio and separate laundry room. Additionally, there are two storage buildings on the property with electric already hooked up. The seller has made some improvements but this home is ready for someone to give it their personal touch!
-
2026-06-08$99,999 New Listing 1 DOM
Show marketing remark (414 chars)
Check out this great investment opportunity just minutes away from downtown Malvern!! This home is nestled in a quiet neighborhood and hosts 3 bedrooms and 2 baths with an enclosed patio and separate laundry room. Additionally, there are two storage buildings on the property with electric already hooked up. The seller has made some improvements but this home is ready for someone to give it their personal touch!
ⓘ Source: listings_history table (triggers on properties + properties_extension) + one-shot
backfill from property_details.listing_events for pre-trigger history.
Climate risk First Street
- Flood 1/10 Low FEMA zone X (unshaded) · 0% chance over 30 yrs
- Wildfire 5/10 Major
- Heat 6/10 Major 7 d/yr ≥110°F today · 20 d/yr by 30 yrs out
- Wind 4/10 Moderate 17% chance of damaging wind over 30 yrs
- Air quality 2/10 Low 0 unhealthy d/yr today · 1 by 30 yrs out
Nearby sold comps map
Loading sold comps map…
Walkable amenities ~0.75 mi
Loading nearby amenities…
Taxation est. · year 1
- Rental income
- $16,800
- − Mortgage interest
- −$5,601
- − Property taxes
- −$1,500
- − Insurance
- −$500
- − Repairs & maintenance
- −$1,344
- − Management
- −$1,344
- − Depreciation
- −$2,909
- Taxable income
- $3,601
- Est. tax owed @ 24.0%
- −$864
- After-tax cash flow
- $4,115/yr
For passive investors: Depreciation is non-cash, so a rental often shows a tax loss while cash-flowing — sheltering income. Rental losses are passive: they offset passive income freely, and up to $25,000/yr can offset ordinary (W-2) income if you actively participate and your MAGI is under $100k (phasing out to $0 by $150k); unused losses carry forward. On sale, claimed depreciation is recaptured at up to 25%, and gains may owe capital-gains tax (a 1031 exchange can defer both). Figures are a year-1 estimate at your 24.0% rate — not tax advice; consult a CPA.
Schools (NCES district)
- District
- Malvern School District
- NCES district ID
- 0509240
- Math proficiency
- 21% ▼ -11.00%
- Reading proficiency
- 22% ▼ -9.00%
- Median HH income
- $35,370
- Composite
- 17.76/100
- National rank
- #9017
- State rank
- #207 of 238 in AR
Livability — Malvern
- Score
- 62/100
- State rank
- #215
- US rank
- #16632
Category grades
Schools grade is shown separately in the Schools card above.
Census & demographics
- Census place
- Malvern, AR
- Population (ZIP)
- 23,222
Population outlook (Hot Spring County) Hauer SSP2
- Today (2025)
- 34,464 people
- By 2030
- 34,659 · +0.6%
- By 2040
- 34,486 · +0.1%
- By 2050
- 33,419 · -3.0%
- By 2075
- 28,702 · -16.7%
- By 2100
- 21,415 · -37.9%
Race, ethnicity, and origin ACS 2023
- Neighborhood character
- Predominantly White (75%)
- Race & ethnicity
- White 75% Black 16% Two or more races 5% Hispanic / Latino 4%
- Common ancestry
- Serbian 2% Slovak 1% Iranian 1%
- Foreign-born
- 1% · Canada
- Languages at home
- 97% English-only · Spanish 3%
Political lean MEDSL · Hot Spring
- 2024 margin
- Solid R (+52.2) · D 22.9% · R 75.1% · Other 1.9%
- 2008→2024 swing
- -27.7pp toward R · 2008: -24.4pp · 2024: -52.2pp
- All cycles
- 2024: R+52.2 2020: R+48.7 2016: R+42.5 2012: R+29.0 2008: R+24.4
Not yet ingested
- Civics
- —
Market trends
- HPI YoY
- ▼ -16.79%
- Current HPI
- 211.6419
- Rent YoY
- —
- Metro
- —
- State GDP YoY
- ▲ 3.80%
- F500 in state
- 10
Industry mix (Fortune 500 HQ in AR)
| Industry | F500 HQs | Revenue |
|---|---|---|
| Retail | 1 | $681B |
|
||
| Food / Agriculture | 1 | $53B |
|
||
| Retail / Energy | 1 | $22B |
|
||
| Transportation / Logistics | 1 | $12B |
|
||
| Energy | 1 | $4B |
|
||
Price history
+53.8% since first listed33 events — show timeline
- 2026-06-08 Listed $99,999 CARMLS
- 2026-06-08 Listed $99,999 HSBOR
- 2025-10-01 Listing Removed — CARMLS
- 2025-07-08 Price Changed $98,500 CARMLS
- 2025-07-08 Price Changed $98,500 HSBOR
- 2025-05-13 Price Changed $99,999 CARMLS
- 2025-05-12 Price Changed $99,999 HSBOR
- 2025-05-12 Relisted — CARMLS
- 2025-04-25 Pending — CARMLS
- 2025-03-18 Price Changed $109,000 CARMLS
- 2025-03-18 Price Changed $109,000 HSBOR
- 2025-02-21 Price Changed $112,500 CARMLS
- 2025-02-21 Price Changed $112,500 HSBOR
- 2025-01-16 Price Changed $115,000 CARMLS
- 2025-01-16 Price Changed $115,000 HSBOR
- 2024-12-18 Listed $119,000 CARMLS
- 2024-03-06 Listing Removed — CARMLS
- 2024-02-23 Relisted — CARMLS
- 2024-02-03 Pending — CARMLS
- 2023-10-27 Price Changed $77,900 CARMLS
- 2023-09-06 Listed $79,900 CARMLS
- 2023-05-12 Sold (MLS) $38,500 CARMLS
- 2023-05-04 Sold (Public Records) $38,500 Public Records
- 2023-04-26 Pending — CARMLS
- 2023-04-18 Price Changed $40,000 CARMLS
- 2023-04-18 Relisted — CARMLS
- 2023-04-18 Listing Removed — CARMLS
- 2023-03-17 Price Changed $47,500 CARMLS
- 2023-02-16 Price Changed $54,900 CARMLS
- 2023-01-17 Listed $60,000 CARMLS
- 2017-05-31 Listing Removed — CARMLS
- 2016-08-26 Price Changed $63,000 CARMLS
- 2016-08-12 Listed $65,000 CARMLS
Property tax history
-20.7%/yrLatest (2025): $65 · -60.5% YoY. Source: county tax records.
Cash-flow waterfall
monthlySold comps — $/sqft
last 12 mo · ≤1 miLoading sold comps…