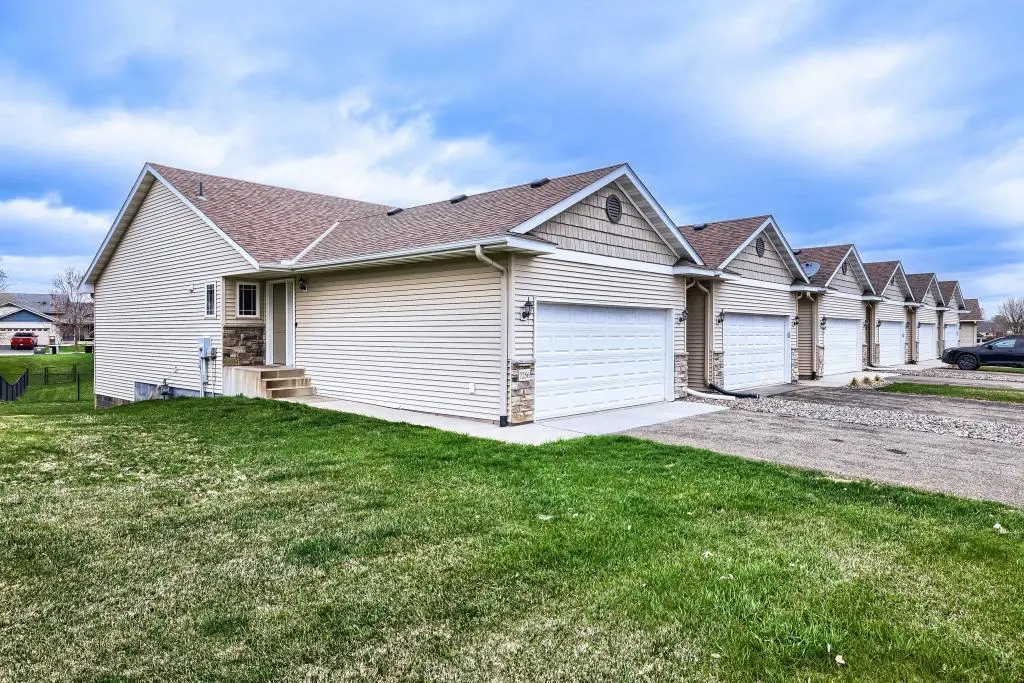
7256 Kahler Cir NE · Otsego, MN
Flood risk 1/10 · Minimal
- FEMA flood zone
- X
- Chance of flooding over 30 yrs
- 0.0%
- Est. flood insurance / yr
- $473 – $860
Fire risk 1/10 · Minimal
- Est. fire insurance / yr
- $888 – $1,650
Heat risk 2/10 · Minimal
- Hot days now (above 99°F)
- 7 days/yr
- Hot days in 30 yrs
- 14 days/yr
Wind risk 2/10 · Minimal
- Chance of severe wind over 30 yrs
- —
Air-quality risk 2/10 · Minimal
- Unhealthy air days now
- 1 days/yr
- Unhealthy air days in 30 yrs
- 2 days/yr
Risk factors via First Street. Map © Google.
Why this score? — see what drove the C grade
The composite is a weighted blend of 9 inputs, each scored 0–100. Each bar is that input's sub-score; the figure is the points it added to the 100-point composite (weight × sub-score).
- Cash flow +16.6/30.0
- ARV discount +14.5/15.0
- 1% rule +5.2/10.0
- DSCR +5.2/10.0
- Schools +5.2/10.0
- Livability +3.5/5.0
- Rent growth +2.5/5.0
- Condition / age +2.5/5.0
- Appreciation +0.0/10.0
$279,900
🖨 Deal sheet 📄 Offer letter ✓ Due diligence
Listing remarks
Well-maintained end-unit 4 bedroom/2 bath townhome in a great location! The main level living space has vaulted ceilings, open kitchen, informal dining area, large breakfast bar, and living room with access to the deck. There are two bedrooms & a full bathroom also on the main level, including a primary bedroom with walk-in closet and second bedroom with brand new carpet. The finished lower level includes 2 additional bedrooms, spacious family room, and 3/4 bath. Recent updates include new LVP flooring and fresh paint throughout the entire lower level and new washer and dryer (2025). HOA replaced the roof and driveway apron in 2023. Additional upgrades include adding the breakfast bar
Key facts
- Fresh paint
- Walk-in closet
- New lvp flooring
Tags
Property features AI
Finance
- Financial info: Conventional mortgage financing indicated
- HOA & community: HOA managed by Sterling Realty & Management; Monthly association fee of $313; HOA covers hazard insurance, lawn care, professional management, and snow removal
Exterior
- Parking: Attached garage with automatic opener; 2-car garage (approx. 21x20)
- Utilities: City water connected; City sewer connected; Natural gas
- Home design: Residential attached property; One level; Main entry on main level
- Construction: Asphalt roof; Block foundation
- Exterior features: Deck; Stone and vinyl exterior; Light tree coverage; City street frontage with paved streets; Publicly maintained road
Interior
- Kitchen: Stainless steel appliances; Dishwasher; Refrigerator; Microwave; Water osmosis system; Breakfast bar / kitchen-dining area
- Bedrooms: 4 bedrooms (Main floor primary and main floor bedroom); Bedroom sizes include 14x11 (Main), 10x10 (Main), 12x11 (Lower), 12x11 (Lower)
- Flooring: Tile floors
- Bathrooms: Main floor full bathroom; Basement 3/4 bathroom
- Heating & cooling: Forced air heating; Central air conditioning
- Interior features: Vaulted ceilings; Tile floors; Washer/dryer hookup; Egress window(s) in basement; Finished basement; Sump pump; Kitchen window; Primary bedroom walk-in closet; Walk-in closet
- Laundry & utility: Washer; Dryer; Laundry on lower level
Neighborhood map
What this means for you Summary
Snapshot
- This is a 4-bed/1.0-bath townhouse listed at $280k.
Deal economics
- At list price, monthly cash flow is $170 ($2k/yr) — positive.
- The deal already cash-flows at list — no discount required.
- Meets the 1% rule at list price ($3k rent vs $280k).
- Recommended offer: $276k (1.5% below list) — sets the bar for market timing.
- Cap rate 7.0% vs local median 4.0% in Otsego — top-decile yield for the area; either an underpriced asset or a hidden risk that comps aren't pricing in. Stress-test before assuming the spread holds.
Location & tenants
- Location reads 69/100 on livability (#367 in MN) — a middle-class / working-renter tenant base. Strengths: employment A+, housing A+, crime A-; Watch: cost of living C-, amenities F, commute F.
- Independent School District 728 (suburban): math 56% / reading 60% proficiency, ranked #37 of 301 in MN (top 12%) — acceptable for families but not a draw, mixed tenant base, ~2y average lease; only 14% free/reduced lunch — higher-income household profile.
- Market conditions: 141 active listings in the ZIP; 3 comparable units currently listed for rent nearby; rentals leasing fast (median 2d on market — plan ~1-2 weeks tenant-placement turnaround); high-income renter base; 1,260 units permitted in Wright County in 2024 (180 in 5+ unit buildings).
Forward outlook
- Local home prices are declining (-3.0%/yr); year-one equity from $2k of loan paydown is wiped out by about $8k of value loss. Plan a longer hold.
- Wright County population projected at +9% by 2050 — modest demand growth; plan on rents tracking national, not racing it.
Negotiation context
- It's been on market 16 days — a 2% lower offer ($276k) is reasonable based on typical stale-listing flexibility.
- 5 sale attempts since 19y ago with the ask held roughly flat each time — persistent listings suggest the price (not the market) is what's stuck; bring a comps-based counter.
- Current owner paid $125k; list at $280k implies a 124% gain — meaningful room to come down on a strong offer.
Questions for the listing agent
- What does the HOA fee cover, when was the last increase, and are there any pending special assessments or reserve-fund shortfalls?
- Is there a deadline driving the sale (1031 exchange, divorce, estate, relocation)? That informs how much negotiation room exists.
- Schools are B-rated — typically a magnet for longer-tenancy family renters. What's the average tenant stay here, and is there a school-zone premium baked into asking?
- What's the average days-on-market for RENTAL listings here right now (not sales)? A rising rental-DOM trend means longer vacancies and softer asking-rent achievability than the comps imply.
- What's the recent tenant-quality profile in this submarket — average credit score on applications, eviction rate, late-payment / NSF rate, and stable-employment percentage? A property-management company in the area should have these aggregated.
- How much new for-sale + rental construction is in the pipeline within 1–3 miles? Heavy new supply typically softens prices + rents 12–24 months out; constrained supply supports both.
Investment metrics
- 1% rule
- 1.02% ✓
- Cap rate
- 7.02%
- Cash-on-cash
- 2.61%
- DSCR
- 1.12
- GRM
- 8.2
CMA / ARV
- ARV (median comp)
- $331,696
- List price
- $279,900
- Delta
- -14.11%
- Verdict
- UNDERPRICED
- Comps
- 3 within 1.0 mi
Projected returns pro-forma
-3.0% appreciation · 3.0% rent growth · sell at horizon
- IRR
- -12.1%
- Equity multiple
- 0.56×
- Total profit
- $-34,367
- Equity at exit
- $41,734
- IRR
- -2.9%
- Equity multiple
- 0.80×
- Total profit
- $-15,394
- Equity at exit
- $24,201
Cash invested: $78,372 (down + closing). Projections, not guarantees.
Landlord ↔ Tenant lean methodology
- Overall (STATE)
- 46 Balanced
- State Minnesota
- 46 Balanced · D+2
- County
- — inherits STATE
- City
- — inherits STATE
ZIP-level market 55301
- Home prices YoY
- -14.2%
- Active inventory
- 141
- Price-to-rent
- 8.2×
Monthly cashflow live
- Estimated rent
- $2,860 medium interval (Pro) →
- Mortgage (P&I)
- −$1,468
- Tax from tax record
- −$191 /mo · $2,296/yr
- Insurance
- −$117
- HOA
- −$313
- Vacancy / Maint / Mgmt
- −$601
- Net cashflow
- $170
Break-even live
UW: 25.0% down · 7.5% · 30yr · 1.5% tax · 5.0% vac · 8.0% maint · 8.0% mgmt
Financing live
Cash to close
- Down payment
- $69,975
- Closing costs
- $8,397
- Reserves months
- —
- Total cash needed
- —
Loan-product check · same deal, 3 products live
Conventional
25% down · 7.5% · 30yr
- Down + closing
- —
- Monthly P&I
- —
- Monthly cashflow
- —
- DSCR
- —
- Eligible?
- —
Personal DTI + credit; lowest rate.
DSCR
20% down · 8.5% · 30yr
- Down + closing
- —
- Monthly P&I
- —
- Monthly cashflow
- —
- DSCR
- —
- Eligible?
- —
No personal income docs; deal must DSCR.
Hard money
10% down · 12.0% · 12mo
- Down + closing
- —
- Monthly P&I
- —
- Monthly cashflow
- —
- DSCR
- —
- Eligible?
- —
Short-term bridge; refi at stabilization.
Rent comps 3 comps
| Address | Beds | Baths | Sqft | Rent | $/sqft | DOM | Units | Dist |
|---|---|---|---|---|---|---|---|---|
| 7712 Lachman Ave NE Albertville, MN | 3.0 | 2.0 | 1525 | $2,259 | $1.48 | 1d | 1 | 0.79mi |
| 10740 County Road 37 NE Albertville, MN | 2.0–3.0 | 1.0–2.0 | 988 | $1,740 | $1.76 | 1d | 6 | 0.98mi |
| 7535 Lannon Ave NE Albertville, MN | 5.0 | 3.0 | 2209 | $3,179 | $1.44 | 1d | 1 | 1.26mi |
HOA detail
- Monthly dues
- $313 · $3,756/yr
Listing history 27 events
-
2026-06-18days on market $279,900 Active 16 DOM
-
2026-06-17days on market $279,900 Active 15 DOM
-
2026-06-16days on market $279,900 Active 14 DOM
-
2026-06-15days on market $279,900 Active 13 DOM
-
2026-06-13days on market $279,900 Active 11 DOM
-
2026-06-13days on market $279,900 Active 10 DOM
-
2026-06-09days on market $279,900 Active 7 DOM
-
2026-06-08days on market $279,900 Active 6 DOM
-
2026-06-07days on market $279,900 Active 5 DOM
-
2026-06-04days on market $279,900 Active 2 DOM
-
2026-06-02pricedays on market $279,900 Active 1 DOM
-
2026-06-01days on market $284,900 Active 38 DOM
-
2026-05-31days on market $284,900 Active 37 DOM
-
2026-05-19price $284,900 1086-char remark
-
2026-04-25$289,900 Active 1086-char remark
-
2026-04-18historical $289,900 1086-char remark
-
2020-06-30historical
-
2020-05-23price $220,000
-
2020-05-19price $225,000
-
2020-05-11$235,000 Active
-
2020-05-08historical
-
2010-04-19soldstatus $124,900
-
2010-03-22historical
-
2010-03-15$119,900
-
2007-11-15historical
-
2007-10-11$214,900
-
2007-08-31soldstatus $45,000
ⓘ Source: listings_history table (triggers on properties + properties_extension) + one-shot
backfill from property_details.listing_events for pre-trigger history.
Tax reassessment forecast MN · Partial reset (capped growth)
- Current annual tax
- $2,296 · $191/mo
- Projected year-2 tax
- $2,715 · $226/mo
- Expected delta
- +$419/yr (+$35/mo · 18.3%)
ⓘ Screening estimate from a state-policy table — verify with the county assessor before closing.
Climate risk First Street
- Flood 1/10 Low FEMA zone X · 0% chance over 30 yrs
- Wildfire 1/10 Low
- Heat 2/10 Low 7 d/yr ≥99°F today · 14 d/yr by 30 yrs out
- Wind 2/10 Low
- Air quality 2/10 Low 1 unhealthy d/yr today · 2 by 30 yrs out
Nearby sold comps map
Loading sold comps map…
Walkable amenities ~0.75 mi
Loading nearby amenities…
Taxation est. · year 1
- Rental income
- $34,316
- − Mortgage interest
- −$15,679
- − Property taxes
- −$2,296
- − Insurance
- −$1,400
- − Repairs & maintenance
- −$2,745
- − Management
- −$2,745
- − HOA
- −$3,756
- − Depreciation
- −$8,143
- Taxable loss
- −$2,447
- Est. tax savings @ 24.0%
- +$587
- After-tax cash flow
- $2,632/yr
For passive investors: Depreciation is non-cash, so a rental often shows a tax loss while cash-flowing — sheltering income. Rental losses are passive: they offset passive income freely, and up to $25,000/yr can offset ordinary (W-2) income if you actively participate and your MAGI is under $100k (phasing out to $0 by $150k); unused losses carry forward. On sale, claimed depreciation is recaptured at up to 25%, and gains may owe capital-gains tax (a 1031 exchange can defer both). Figures are a year-1 estimate at your 24.0% rate — not tax advice; consult a CPA.
Schools (NCES district)
- District
- Independent School District 728
- NCES district ID
- 2711370
- Math proficiency
- 56% ▼ -15.00%
- Reading proficiency
- 60% ▼ -10.00%
- Median HH income
- $82,336
- Composite
- 52.5/100
- National rank
- #1567
- State rank
- #37 of 301 in MN
Livability — Otsego
- Score
- 69/100
- State rank
- #367
- US rank
- #8641
Category grades
Schools grade is shown separately in the Schools card above.
Census & demographics
- Census place
- Otsego, MN
- County
- Wright County · 79,164 people
- Metro
- Minneapolis-St. Paul-Bloomington, MN-WI
- Population (ZIP)
- 13,482
- Household income
- $129,232
- Rent vs Own
- Severe rent burden
- 50.0
Population outlook (Wright County) Hauer SSP2
- Today (2025)
- 142,526 people
- By 2030
- 146,915 · +3.1%
- By 2040
- 153,625 · +7.8%
- By 2050
- 155,416 · +9.0%
- By 2075
- 150,352 · +5.5%
- By 2100
- 130,631 · -8.3%
Race, ethnicity, and origin ACS 2023
- Neighborhood character
- Predominantly White (85%)
- Race & ethnicity
- White 85% Black 7% Two or more races 5% Asian 2%
- Common ancestry
- Portuguese 10% Romanian 5% Lithuanian 4%
- Foreign-born
- 7% · South Korea, China, Canada
Political lean MEDSL · Wright
- 2024 margin
- Strong R (+29.4) · D 34.4% · R 63.8% · Other 1.8%
- 2008→2024 swing
- -11.9pp toward R · 2008: -17.4pp · 2024: -29.4pp
- All cycles
- 2024: R+29.4 2020: R+28.6 2016: R+33.2 2012: R+21.4 2008: R+17.4
Not yet ingested
- Civics
- —
Market trends
- HPI YoY
- ▼ -38.52%
- Current HPI
- 233.6299
- Rent YoY
- —
- Metro
- Minneapolis-St. Paul-Bloomington, MN-WI
- State GDP YoY
- ▲ 2.41%
- F500 in state
- 34
Industry mix (Fortune 500 HQ in MN)
| Industry | F500 HQs | Revenue |
|---|---|---|
| Healthcare | 2 | $407B |
|
||
| Retail | 2 | $150B |
|
||
| Consumer Goods | 2 | $32B |
|
||
| Industrial Machinery | 2 | $6B |
|
||
| Agriculture | 1 | $40B |
|
||
| Healthcare / Medical Devices | 1 | $32B |
|
||
Price history
+522.0% since first listed16 events — show timeline
- 2026-06-02 Listing Removed — NORTHSTARMLS as Distributed by MLS Grid
- 2026-06-02 Listed $279,900 NORTHSTARMLS as Distributed by MLS Grid
- 2026-05-19 Price Changed $284,900 NORTHSTARMLS as Distributed by MLS Grid
- 2026-04-25 Listed $289,900 NORTHSTARMLS as Distributed by MLS Grid
- 2026-04-18 Coming Soon — NORTHSTARMLS as Distributed by MLS Grid
- 2020-06-30 Listing Removed — NORTHSTARMLS as Distributed by MLS Grid
- 2020-05-23 Price Changed $220,000 NORTHSTARMLS as Distributed by MLS Grid
- 2020-05-19 Price Changed $225,000 NORTHSTARMLS as Distributed by MLS Grid
- 2020-05-11 Listed $235,000 NORTHSTARMLS as Distributed by MLS Grid
- 2020-05-08 Coming Soon — NORTHSTARMLS as Distributed by MLS Grid
- 2010-04-19 Sold (MLS) $124,900 NORTHSTARMLS as Distributed by MLS Grid
- 2010-03-22 Listing Removed — NORTHSTARMLS as Distributed by MLS Grid
- 2010-03-15 Listed $119,900 NORTHSTARMLS as Distributed by MLS Grid
- 2007-11-15 Listing Removed — NORTHSTARMLS as Distributed by MLS Grid
- 2007-10-11 Listed $214,900 NORTHSTARMLS as Distributed by MLS Grid
- 2007-08-31 Sold (Public Records) $45,000 Public Records
Property tax history
+3.9%/yrLatest (2025): $2,296 · -3.5% YoY. Source: county tax records.
Cash-flow waterfall
monthlySold comps — $/sqft
last 12 mo · ≤1 miLoading sold comps…