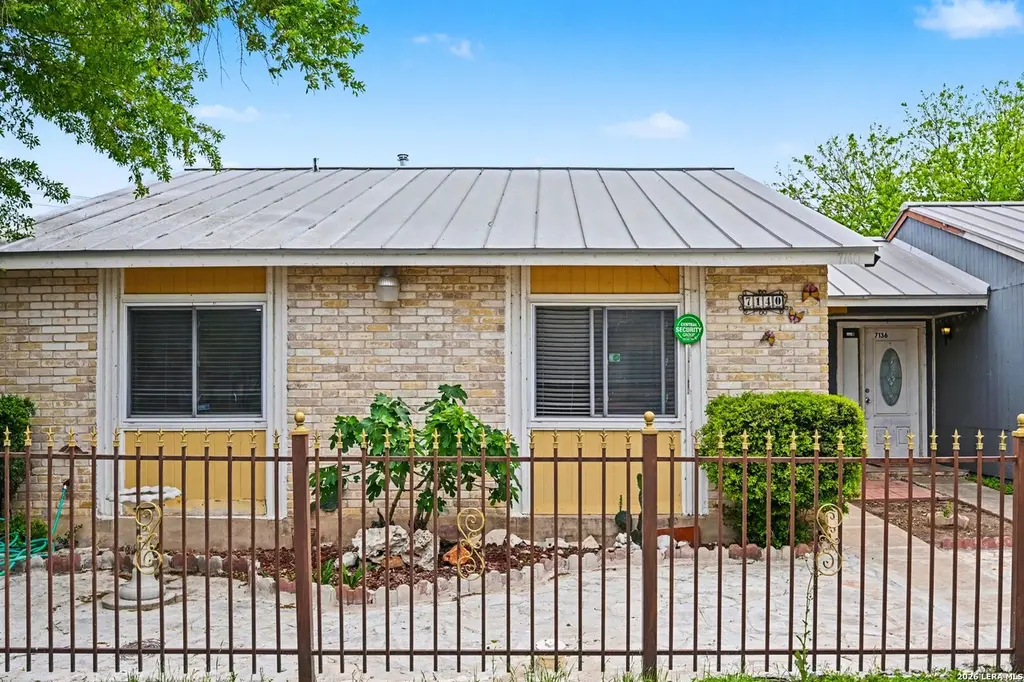
7140 Oldham · San Antonio, TX
Flood risk 4/10 · Minor
- FEMA flood zone
- X (unshaded)
- Chance of flooding over 30 yrs
- 0.22%
- Est. flood insurance / yr
- $507 – $1,088
Fire risk 2/10 · Minimal
- Est. fire insurance / yr
- $1,222 – $2,270
Heat risk 8/10 · Major
- Hot days now (above 108°F)
- 7 days/yr
- Hot days in 30 yrs
- 22 days/yr
Wind risk 8/10 · Major
- Chance of severe wind over 30 yrs
- 80.0%
Air-quality risk 1/10 · Minimal
- Unhealthy air days now
- 0 days/yr
- Unhealthy air days in 30 yrs
- 0 days/yr
Risk factors via First Street. Map © Google.
Why this score? — see what drove the D+ grade
The composite is a weighted blend of 9 inputs, each scored 0–100. Each bar is that input's sub-score; the figure is the points it added to the 100-point composite (weight × sub-score).
- Cash flow +16.4/30.0
- ARV discount +10.6/15.0
- DSCR +5.1/10.0
- 1% rule +4.3/10.0
- Livability +4.0/5.0
- Schools +3.8/10.0
- Condition / age +2.5/5.0
- Rent growth +2.2/5.0
- Appreciation +0.0/10.0
$160,000
🖨 Deal sheet 📄 Offer letter ✓ Due diligence
Listing remarks MLS
A Great Home Ready for Its Next Chapter! This inviting home delivers a smart, open-concept layout that makes everyday living feel effortless and entertaining a natural extension of daily life. The kitchen features stylish finishes and easy sight lines to the living spaces, keeping the cook connected to the action whether it's a quiet evening in or a gathering with friends and family. The primary bedroom is thoughtfully positioned within the floor plan, offering the privacy and comfort today's buyers appreciate. The overall layout flows naturally and makes the most of every square foot. Out back, the great fenced backyard provides a private outdoor retreat ready for weekend cookouts, play, gardening, or simply unwinding after a long day. Conveniently located close to area shopping, dining, and everyday amenities, everything you need is just minutes away!
Key facts
- Close to dining
- Fenced backyard
- Open-concept layout
Tags
Neighborhood map
What this means for you Summary
Snapshot
- This is a 3-bed/2.0-bath townhouse listed at $160k.
Deal economics
- At list price, monthly cash flow is $90 ($1k/yr) — positive.
- The deal already cash-flows at list — no discount required.
- To meet the 1% rule (rent ≥ 1% of price), the offer needs to be $149k (6.8% below list).
- Recommended offer: $149k (6.8% below list) — sets the bar for 1% rule.
- Cap rate 7.0% vs local median 3.8% in San Antonio — top-decile yield for the area; either an underpriced asset or a hidden risk that comps aren't pricing in. Stress-test before assuming the spread holds.
Location & tenants
- Location reads 80/100 on livability (#31 in TX, #1,616 nationally) — a professional / high-income tenant draw. Strengths: amenities A+, commute A+, cost of living A+; Watch: schools C-, crime F.
- North East ISD (urban): math 38% / reading 49% proficiency, ranked #276 of 826 in TX (top 33%) — families likely to look elsewhere, expect single-tenant / working-renter base with shorter leases.
- Market conditions: Rents soft (-1.1%/yr); 202 active listings in the ZIP; 40 comparable units currently listed for rent nearby; rentals at typical pace (median 24d on market — plan ~3-4 weeks tenant-placement turnaround); 8,308 units permitted in Bexar County in 2024 (2,506 in 5+ unit buildings).
Forward outlook
- Local home prices are declining (-3.0%/yr); year-one equity from $1k of loan paydown is wiped out by about $5k of value loss. Plan a longer hold.
- Bexar County population projected at +50% by 2050 — long-run rental-demand tailwind backs the buy-and-hold thesis.
Negotiation context
- It's been on market 76 days — a 6% lower offer ($150k) is reasonable based on typical stale-listing flexibility.
Risks & watch-outs
- Climate carrying-cost: severe wind risk, 80% chance of damaging wind over 30y; extreme-heat days projected 7→22/yr by 2055 (HVAC capex compounding) — expect insurance premiums to compound above CPI over the hold.
Questions for the listing agent
- It's been on market 76 days. Have you received any prior offers? Is the seller open to a 7% concession, seller financing, or rate buy-down credit?
- Built in 1978 — when were the roof, HVAC, electrical panel, plumbing, and water heater last replaced?
- Why hasn't it sold? Are there any deal-killer items the seller is aware of (foundation, flood, title, zoning, code violations)?
- Is there a deadline driving the sale (1031 exchange, divorce, estate, relocation)? That informs how much negotiation room exists.
- Crime grade is F in this area — have there been break-ins, vandalism, or insurance claims at this property in the last 3 years? What carrier currently insures it and at what premium?
- The area grade is low — what's the realistic commute time and amenity access for the typical tenant pool here? Any planned neighborhood developments (good or bad) we should know about?
- What's the average days-on-market for RENTAL listings here right now (not sales)? A rising rental-DOM trend means longer vacancies and softer asking-rent achievability than the comps imply.
- What's the recent tenant-quality profile in this submarket — average credit score on applications, eviction rate, late-payment / NSF rate, and stable-employment percentage? A property-management company in the area should have these aggregated.
- How much new for-sale + rental construction is in the pipeline within 1–3 miles? Heavy new supply typically softens prices + rents 12–24 months out; constrained supply supports both.
Investment metrics
- 1% rule
- 0.93% ✗
- Cap rate
- 6.97%
- Cash-on-cash
- 2.41%
- DSCR
- 1.11
- GRM
- 8.9
CMA / ARV
- ARV (median comp)
- $171,919
- List price
- $160,000
- Delta
- -6.93%
- Verdict
- FAIR
- Comps
- 20 within 1.0 mi
Show comp detail 4 sales within ~0.75 mi
| Address | Dist | Beds/Ba | Sqft | Sold | Price | $/sf | Match |
|---|---|---|---|---|---|---|---|
| 7009 Glen Mist | 0.41mi | 2/2.0 (-1) | 1,232 (-5%) | 3mo | $60,000 | $49 | 66 |
| 6907 Neston #1 | 0.26mi | 3/1.0 | 1,393 (+8%) | 7mo | $95,000 | $68 | 65 |
| 8002 Mallow | 0.12mi | 3/2.0 | 1,177 (-9%) | 22mo | $100,000 | $85 | 61 |
| 7904 Broadwick | 0.18mi | 3/2.0 | 1,104 (-15%) | 17mo | $135,000 | $122 | 53 |
Match score weights: distance 35% · size 25% · config 20% · recency 20%. Top-matched comps best support the ARV.
Projected returns pro-forma
-3.0% appreciation · 0.0% rent growth · sell at horizon
- IRR
- -15.9%
- Equity multiple
- 0.45×
- Total profit
- $-24,548
- Equity at exit
- $23,857
- IRR
- -13.7%
- Equity multiple
- 0.31×
- Total profit
- $-30,829
- Equity at exit
- $13,834
Cash invested: $44,800 (down + closing). Projections, not guarantees.
Landlord ↔ Tenant lean methodology
- Overall (STATE)
- 87 Strongly Landlord-Friendly
- State Texas
- 87 Strongly Landlord-Friendly · R+5
- County
- — inherits STATE
- City
- — inherits STATE
ZIP-level market 78239
- Home prices YoY
- -5.9%
- Rents YoY
- -1.1%
- Active inventory
- 202
- Price-to-rent
- 8.9×
Monthly cashflow live
- Estimated rent
- $1,491 high interval (Pro) →
- Mortgage (P&I)
- −$839
- Tax from tax record
- −$182 /mo · $2,187/yr
- Insurance
- −$67
- HOA
- −$0
- Vacancy / Maint / Mgmt
- −$313
- Net cashflow
- $90
Break-even live
UW: 25.0% down · 7.5% · 30yr · 1.5% tax · 5.0% vac · 8.0% maint · 8.0% mgmt
Financing live
Cash to close
- Down payment
- $40,000
- Closing costs
- $4,800
- Reserves months
- —
- Total cash needed
- —
Loan-product check · same deal, 3 products live
Conventional
25% down · 7.5% · 30yr
- Down + closing
- —
- Monthly P&I
- —
- Monthly cashflow
- —
- DSCR
- —
- Eligible?
- —
Personal DTI + credit; lowest rate.
DSCR
20% down · 8.5% · 30yr
- Down + closing
- —
- Monthly P&I
- —
- Monthly cashflow
- —
- DSCR
- —
- Eligible?
- —
No personal income docs; deal must DSCR.
Hard money
10% down · 12.0% · 12mo
- Down + closing
- —
- Monthly P&I
- —
- Monthly cashflow
- —
- DSCR
- —
- Eligible?
- —
Short-term bridge; refi at stabilization.
Rent comps 40 comps
| Address | Beds | Baths | Sqft | Rent | $/sqft | DOM | Units | Dist |
|---|---|---|---|---|---|---|---|---|
| 7904 Mallow San Antonio, TX | 3.0 | 2.0 | 1135 | $1,145 | $1.01 | 15d | 1 | 0.04mi |
| 7006 Glen Grv San Antonio, TX | 3.0 | 2.0 | 1036 | $1,495 | $1.44 | 44d | 1 | 0.09mi |
| 7923 Langport San Antonio, TX | 3.0 | 2.0 | 1095 | $1,800 | $1.64 | 44d | 1 | 0.10mi |
| 7138 Brecon San Antonio, TX | 3.0 | 2.5 | 1276 | $1,065 | $0.83 | 44d | 1 | 0.15mi |
| 6918 Stockport San Antonio, TX | 3.0 | 2.0 | 1390 | $1,050 | $0.76 | 44d | 1 | 0.19mi |
| 6831 De Palma San Antonio, TX | 3.0 | 2.0 | 1504 | $1,539 | $1.02 | 3d | 1 | 0.19mi |
| 6831 De Palma San Antonio, TX | 3.0 | 2.0 | 1504 | $1,569 | $1.04 | 16d | 1 | 0.19mi |
| 7812 Broadwick San Antonio, TX | 2.0 | 1.0 | 884 | $1,075 | $1.22 | 18d | 1 | 0.22mi |
| 7809 Sarepto San Antonio, TX | 2.0 | 2.0 | 1152 | $950 | $0.82 | 24d | 1 | 0.24mi |
| 6811 Avila San Antonio, TX | 3.0 | 2.0 | 1260 | $1,555 | $1.23 | 20d | 1 | 0.25mi |
| 7210 John Palmer Dr Unit 101 San Antonio, TX | 3.0 | 2.5 | 1426 | $1,700 | $1.19 | 24d | 1 | 0.27mi |
| 7210 John Palmer Dr Unit 101 San Antonio, TX | 3.0 | 2.5 | 1426 | $1,650 | $1.16 | 16d | 1 | 0.27mi |
| 7603 Glen Vis San Antonio, TX | 3.0 | 2.0 | 980 | $1,200 | $1.22 | 8d | 1 | 0.29mi |
| 6814 Oldham San Antonio, TX | 3.0 | 2.0 | 1238 | $1,300 | $1.05 | 24d | 1 | 0.31mi |
| 7222 Glen Hvn San Antonio, TX | 4.0 | 2.0 | 1320 | $1,350 | $1.02 | 24d | 1 | 0.34mi |
| 8318 Tuxford San Antonio, TX | 4.0 | 2.0 | 1452 | $1,700 | $1.17 | 4d | 1 | 0.39mi |
| 7614 Glen Hurst San Antonio, TX | 3.0 | 1.0 | 1100 | $1,400 | $1.27 | 2d | 1 | 0.41mi |
| 7318 Glen Trl San Antonio, TX | 3.0 | 2.0 | 1226 | $1,900 | $1.55 | 44d | 1 | 0.42mi |
| 7326 Glen Trl San Antonio, TX | 4.0 | 2.0 | 1370 | $1,549 | $1.13 | 3d | 1 | 0.45mi |
| 7042 Glen Mist San Antonio, TX | 3.0 | 2.0 | 1284 | $950 | $0.74 | 44d | 1 | 0.47mi |
| 6733 Montgomery Dr San Antonio, TX | 3.0 | 2.0 | 1150 | $860 | $0.75 | 44d | 2 | 0.48mi |
| 7237 Glen Bay San Antonio, TX | 3.0 | 2.0 | 1400 | $1,050 | $0.75 | 44d | 1 | 0.49mi |
| 8259 Montgomery Oak San Antonio, TX | 3.0 | 2.0 | 1152 | $1,250 | $1.09 | 44d | 5 | 0.55mi |
| 8219 Glen Lark San Antonio, TX | 4.0 | 2.0 | 1260 | $1,250 | $0.99 | 22d | 1 | 0.55mi |
| 7347 Montgomery Dr San Antonio, TX | 3.0 | 2.0 | 1579 | $1,950 | $1.23 | 24d | 1 | 0.57mi |
| 7331 Glen Hts San Antonio, TX | 3.0 | 2.0 | 1184 | $1,390 | $1.17 | 24d | 1 | 0.63mi |
| 6607 Benhill San Antonio, TX | 3.0 | 2.0 | 1318 | $2,000 | $1.52 | 22d | 1 | 0.67mi |
| 8310 Hastings San Antonio, TX | 2.0 | 1.0 | 1315 | $1,450 | $1.10 | 24d | 1 | 0.68mi |
| 8215 Littleport San Antonio, TX | 3.0 | 2.0 | 1344 | $1,600 | $1.19 | 18d | 1 | 0.68mi |
| 7858 Hedrick Farm San Antonio, TX | 3.0 | 2.5 | 1437 | $1,485 | $1.03 | 3d | 1 | 0.69mi |
| 7323 Booker Bay San Antonio, TX | 3.0 | 2.0 | 1388 | $1,495 | $1.08 | 44d | 1 | 0.69mi |
| 7662 Oak Chase San Antonio, TX | 3.0 | 2.0 | 1250 | $1,200 | $0.96 | 11d | 1 | 0.71mi |
| 7664 Oak Chase San Antonio, TX | 3.0 | 2.0 | 1250 | $1,350 | $1.08 | 8d | 1 | 0.71mi |
| 7658 Oak Chase San Antonio, TX | 3.0 | 2.0 | 1250 | $1,350 | $1.08 | 8d | 1 | 0.71mi |
| 7650 Oak Chase Unit 7650 San Antonio, TX | 4.0 | 2.0 | 1250 | $1,650 | $1.32 | 44d | 1 | 0.71mi |
| 7660 Oak Chase San Antonio, TX | 3.0 | 2.0 | 1250 | $1,200 | $0.96 | 11d | 1 | 0.71mi |
| 7500 Paradise Rd San Antonio, TX | 3.0 | 2.0 | 1650 | $1,950 | $1.18 | 44d | 1 | 0.72mi |
| 7422 Branching Peak San Antonio, TX | 3.0 | 2.5 | 1605 | $1,669 | $1.04 | 3d | 1 | 0.72mi |
| 7636 Oak Chase Unit 1 San Antonio, TX | 3.0 | 2.0 | 1200 | $1,255 | $1.05 | 44d | 1 | 0.72mi |
| 7831 Hedrick Farm San Antonio, TX | 3.0 | 3.0 | 1556 | $1,560 | $1.00 | 13d | 1 | 0.73mi |
Listing history 17 events
-
2026-06-18days on market $160,000 Active 76 DOM
-
2026-06-17statusdays on market $160,000 Active 75 DOM
-
2026-06-16days on market $160,000 Price Change 74 DOM
-
2026-06-13days on market $160,000 Price Change 71 DOM
-
2026-06-13days on market $160,000 Price Change 70 DOM
-
2026-06-09days on market $160,000 Price Change 67 DOM
-
2026-06-08days on market $160,000 Price Change 66 DOM
-
2026-06-07pricestatusdays on market $160,000 Price Change 65 DOM
-
2026-06-04days on market $165,000 Active 62 DOM
-
2026-06-03days on market $165,000 Active 61 DOM
-
2026-06-02days on market $165,000 Active 60 DOM
-
2026-06-01days on market $165,000 Active 59 DOM
-
2026-05-31days on market $165,000 Active 58 DOM
-
2026-05-11price $165,000 865-char remark
Show marketing remark (865 chars)
A Great Home Ready for Its Next Chapter! This inviting home delivers a smart, open-concept layout that makes everyday living feel effortless and entertaining a natural extension of daily life. The kitchen features stylish finishes and easy sight lines to the living spaces, keeping the cook connected to the action whether it's a quiet evening in or a gathering with friends and family. The primary bedroom is thoughtfully positioned within the floor plan, offering the privacy and comfort today's buyers appreciate. The overall layout flows naturally and makes the most of every square foot. Out back, the great fenced backyard provides a private outdoor retreat ready for weekend cookouts, play, gardening, or simply unwinding after a long day. Conveniently located close to area shopping, dining, and everyday amenities, everything you need is just minutes away!
-
2026-05-01price $170,000 865-char remark
Show marketing remark (865 chars)
A Great Home Ready for Its Next Chapter! This inviting home delivers a smart, open-concept layout that makes everyday living feel effortless and entertaining a natural extension of daily life. The kitchen features stylish finishes and easy sight lines to the living spaces, keeping the cook connected to the action whether it's a quiet evening in or a gathering with friends and family. The primary bedroom is thoughtfully positioned within the floor plan, offering the privacy and comfort today's buyers appreciate. The overall layout flows naturally and makes the most of every square foot. Out back, the great fenced backyard provides a private outdoor retreat ready for weekend cookouts, play, gardening, or simply unwinding after a long day. Conveniently located close to area shopping, dining, and everyday amenities, everything you need is just minutes away!
-
2026-04-03$180,000 New 865-char remark
Show marketing remark (865 chars)
A Great Home Ready for Its Next Chapter! This inviting home delivers a smart, open-concept layout that makes everyday living feel effortless and entertaining a natural extension of daily life. The kitchen features stylish finishes and easy sight lines to the living spaces, keeping the cook connected to the action whether it's a quiet evening in or a gathering with friends and family. The primary bedroom is thoughtfully positioned within the floor plan, offering the privacy and comfort today's buyers appreciate. The overall layout flows naturally and makes the most of every square foot. Out back, the great fenced backyard provides a private outdoor retreat ready for weekend cookouts, play, gardening, or simply unwinding after a long day. Conveniently located close to area shopping, dining, and everyday amenities, everything you need is just minutes away!
-
1993-07-01soldstatus
ⓘ Source: listings_history table (triggers on properties + properties_extension) + one-shot
backfill from property_details.listing_events for pre-trigger history.
Tax reassessment forecast TX · Resets to sale price
- Current annual tax
- $2,187 · $182/mo
- Projected year-2 tax
- $2,928 · $244/mo
- Expected delta
- +$741/yr (+$62/mo · 33.9%)
ⓘ Screening estimate from a state-policy table — verify with the county assessor before closing.
Climate risk First Street
- Flood 4/10 Moderate FEMA zone X (unshaded) · 22% chance over 30 yrs
- Wildfire 2/10 Low
- Heat 8/10 Severe 7 d/yr ≥108°F today · 22 d/yr by 30 yrs out
- Wind 8/10 Severe 80% chance of damaging wind over 30 yrs
- Air quality 1/10 Low 0 unhealthy d/yr today · 0 by 30 yrs out
Nearby sold comps map
Loading sold comps map…
Walkable amenities ~0.75 mi
Loading nearby amenities…
Taxation est. · year 1
- Rental income
- $17,894
- − Mortgage interest
- −$8,962
- − Property taxes
- −$2,187
- − Insurance
- −$800
- − Repairs & maintenance
- −$1,432
- − Management
- −$1,432
- − Depreciation
- −$4,655
- Taxable loss
- −$1,573
- Est. tax savings @ 24.0%
- +$377
- After-tax cash flow
- $1,458/yr
For passive investors: Depreciation is non-cash, so a rental often shows a tax loss while cash-flowing — sheltering income. Rental losses are passive: they offset passive income freely, and up to $25,000/yr can offset ordinary (W-2) income if you actively participate and your MAGI is under $100k (phasing out to $0 by $150k); unused losses carry forward. On sale, claimed depreciation is recaptured at up to 25%, and gains may owe capital-gains tax (a 1031 exchange can defer both). Figures are a year-1 estimate at your 24.0% rate — not tax advice; consult a CPA.
Schools (NCES district)
- District
- North East ISD
- NCES district ID
- 4832940
- Math proficiency
- 38% ▼ -14.00%
- Reading proficiency
- 49% ▼ -4.00%
- Median HH income
- $57,715
- Composite
- 38.1/100
- National rank
- #4276
- State rank
- #276 of 826 in TX
Livability — San Antonio
- Score
- 80/100
- State rank
- #31
- US rank
- #1616
Category grades
Schools grade is shown separately in the Schools card above.
Census & demographics
- County
- Bexar County · 1,990,555 people
- City population
- 1,806,925
- Metro
- San Antonio-New Braunfels, TX
- Population (ZIP)
- 28,609
- Household income
- $70,098
- Rent vs Own
- Severe rent burden
- 488.0
Population outlook (Bexar County) Hauer SSP2
- Today (2025)
- 2,336,851 people
- By 2030
- 2,560,728 · +9.6%
- By 2040
- 3,020,569 · +29.3%
- By 2050
- 3,493,522 · +49.5%
- By 2075
- 4,668,459 · +99.8%
- By 2100
- 5,533,242 · +136.8%
Race, ethnicity, and origin ACS 2023
- Neighborhood character
- Diverse neighborhood (Simpson 0.66)
- Race & ethnicity
- Hispanic / Latino 47% White 30% Two or more races 20% Black 16% Asian 4% Pacific Islander 2%
- Hispanic origin (detail)
- Mexican 38% Puerto Rican 4%
- Common ancestry
- Lithuanian 2% Romanian 1% Slovak 1%
- Foreign-born
- 13% · Canada, Vietnam, Jamaica
- Languages at home
- 72% English-only · Spanish 24% Vietnamese 1% Chinese 1%
Political lean MEDSL · Bexar
- 2024 margin
- Lean D (+9.8) · D 54.3% · R 44.6% · Other 1.1%
- 2008→2024 swing
- +4.2pp toward D · 2008: 5.6pp · 2024: 9.8pp
- All cycles
- 2024: D+9.8 2020: D+18.2 2016: D+13.5 2012: D+4.6 2008: D+5.6
Not yet ingested
- Civics
- —
Market trends
- HPI YoY
- ▼ -15.13%
- Current HPI
- 242.1272
- Rent YoY
- ▼ -1.05%
- Metro
- San Antonio-New Braunfels, TX
- State GDP YoY
- ▲ 3.95%
- F500 in state
- 110
Industry mix (Fortune 500 HQ in TX)
| Industry | F500 HQs | Revenue |
|---|---|---|
| Energy | 16 | $1,198B |
|
||
| Technology | 5 | $198B |
|
||
| Engineering / Construction | 4 | $72B |
|
||
| Energy Services | 3 | $60B |
|
||
| Utilities | 3 | $41B |
|
||
| Healthcare | 2 | $330B |
|
||
Price history
-8.3% since first listed4 events — show timeline
- 2026-05-11 Price Changed $165,000 LERA
- 2026-05-01 Price Changed $170,000 LERA
- 2026-04-03 Listed $180,000 LERA
- 1993-07-01 Sold (Public Records) — Public Records
Property tax history
+12.1%/yrLatest (2025): $2,187 · +8.9% YoY. Source: county tax records.
Cash-flow waterfall
monthlySold comps — $/sqft
last 12 mo · ≤1 miLoading sold comps…