 Fourplex
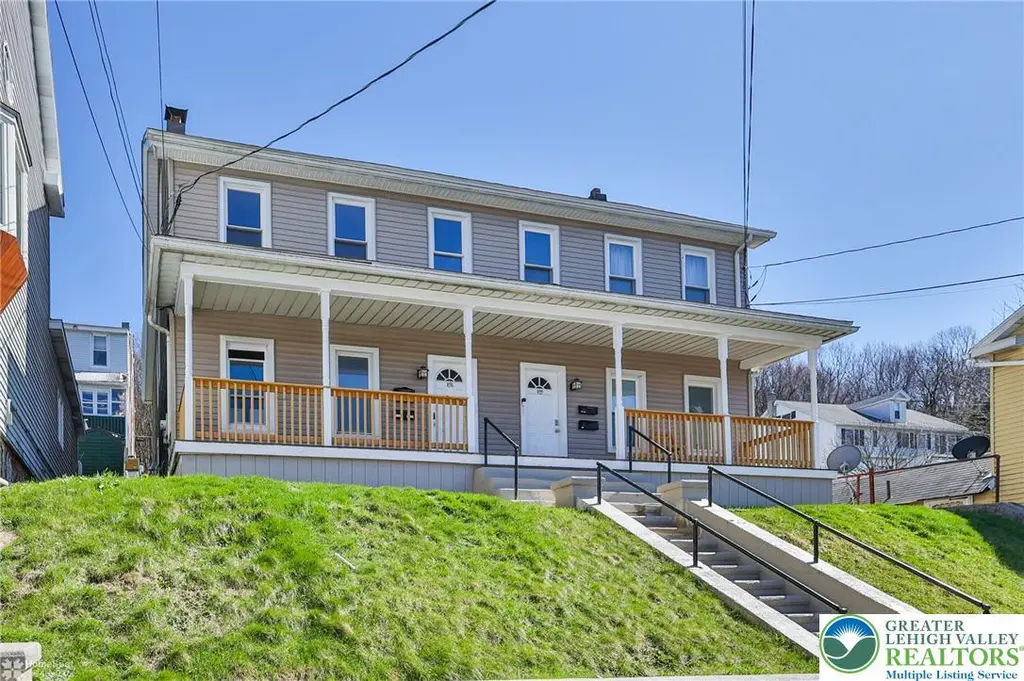
302 W Abbott St · Lansford, PA
Flood risk 1/10 · Minimal
- FEMA flood zone
- X (unshaded)
- Chance of flooding over 30 yrs
- 0.0%
- Est. flood insurance / yr
- $507 – $1,088
Fire risk 3/10 · Minor
- Est. fire insurance / yr
- $511 – $949
Heat risk 3/10 · Minor
- Hot days now (above 94°F)
- 7 days/yr
- Hot days in 30 yrs
- 15 days/yr
Wind risk 4/10 · Minor
- Chance of severe wind over 30 yrs
- 8.0%
Air-quality risk 2/10 · Minimal
- Unhealthy air days now
- 1 days/yr
- Unhealthy air days in 30 yrs
- 3 days/yr
Risk factors via First Street. Map © Google.
Why this score? — see what drove the C+ grade
The composite is a weighted blend of 9 inputs, each scored 0–100. Each bar is that input's sub-score; the figure is the points it added to the 100-point composite (weight × sub-score).
- Cash flow +26.3/30.0
- Appreciation +9.6/10.0
- DSCR +8.9/10.0
- 1% rule +7.0/10.0
- Livability +3.6/5.0
- ARV discount +2.7/15.0
- Rent growth +2.5/5.0
- Condition / age +2.2/5.0
- Schools +2.0/10.0
$375,000
🖨 Deal sheet (PDF) 📄 Offer letter ✓ Due diligence
Multi-family units
County records classify this as Multi-Family (2-4 Unit). Listing-text estimate: 4 units. confirmed
Listing remarks MLS
Fully Occupied 4-Unit Investment Property in Lansford, PA Great opportunity to own a fully leased 4-unit building featuring a desirable unit mix of one 1-bedroom and three 2-bedroom apartments. Tenants pay all utilities, keeping owner expenses low and maximizing cash flow. A solid, income-producing asset in a strong rental market—ideal for investors seeking stable returns and low overhead.
Key facts
- 6,752 sq ft lot
- 4 parking spots
- Built 1904
Neighborhood map
What this means for you Summary
Snapshot
- This is a 1×1bd/1.0ba + 3×2bd/1.0ba units multifamily listed at $375k. Condition is rated fair.
Deal economics
- At list price, monthly cash flow is $971 ($12k/yr) — positive. Per door: $243/mo.
- The deal already cash-flows at list — no discount required.
- Meets the 1% rule at list price ($5k rent vs $375k).
- Recommended offer: $352k (6.0% below list) — sets the bar for market timing.
Location & tenants
- Location reads 72/100 on livability (#605 in PA) — a middle-class / working-renter tenant base. Strengths: cost of living A+, health & safety A+, crime A-; Watch: amenities D, commute F, employment F.
- Panther Valley SD (rural): math 14% / reading 35% proficiency, ranked #477 of 539 in PA (top 88%) — low school quality limits family demand, transient renter base, plan for 1-2y turnover.
- Zoned schools: Panther Valley El Sch (math 27% / reading 42%, grade F, #1,049 of 1,518 statewide, top 71%, 622 students, 100% FRL); Panther Valley Intermediate Sch (math 11% / reading 31%, grade F, #432 of 512 statewide, top 85%, 417 students, 100% FRL); Panther Valley Jshs (math 13% / reading 36%, grade F, #376 of 437 statewide, top 86%, 771 students, 100% FRL) — zoned schools average 100% FRL vs 52% district-wide (48 pts higher); higher-poverty schools than district average — tighter screening recommended.
- Market conditions: 36 active listings in the ZIP; lower-income renter base — watch delinquency; 180 units permitted in Carbon County in 2024 (10 in 5+ unit buildings).
- At $4,509/mo this rent would consume 121% of the median local household income ($45k/yr) (locally 123% of renters already pay >50% of income on rent) — very limited rent-growth headroom before tenants either downsize or default.
Forward outlook
- In year one you build about $37k of equity ($3k loan paydown + $34k appreciation (9.1% local appreciation)).
- Carbon County population projected at -18% by 2050 — secular population decline; favor cash flow + early exit over multi-decade hold.
- At projected returns (9.1% appreciation + 3.0% rent growth), your $105k cash investment doubles in ~3 years — after that, you're playing with house money.
- By year 2, paydown + projected appreciation supports a ~$59k cash-out refi (75% LTV) — recoverable capital for the next deal without selling this one.
Negotiation context
- It's been on market 72 days — a 6% lower offer ($352k) is reasonable based on typical stale-listing flexibility.
- 3 sale attempts since 3y ago; this cycle's ask has dropped $20k (5%) from the opening price — seller is motivated, your offer sets the floor, not the list.
- Current owner paid $285k; 32% above their basis — modest negotiation headroom, anchor on the comps not their cost.
Risks & watch-outs
- Watch-outs: built in 1904 — expect roof / HVAC / electrical / plumbing capex.
Questions for the listing agent
- It's been on market 72 days. Have you received any prior offers? Is the seller open to a 6% concession, seller financing, or rate buy-down credit?
- Can we see the unit-by-unit rent roll, current vacancy, and any below-market leases? What's the average tenancy length?
- What capital expenditures (roof, boiler, parking lot, exteriors) have been made in the last 5 years, and what's planned in the next 2?
- Have any recent inspections been done? Can we get a copy of the seller's disclosures and any deferred-maintenance estimates?
- Built in 1904 — when were the roof, HVAC, electrical panel, plumbing, and water heater last replaced?
- Why hasn't it sold? Are there any deal-killer items the seller is aware of (foundation, flood, title, zoning, code violations)?
- Is there a deadline driving the sale (1031 exchange, divorce, estate, relocation)? That informs how much negotiation room exists.
- Schools are F-rated, which usually means shorter tenancies and higher turnover. Who's the typical renter profile here, and what's been the actual vacancy rate?
- What's the average days-on-market for RENTAL listings here right now (not sales)? A rising rental-DOM trend means longer vacancies and softer asking-rent achievability than the comps imply.
- What's the recent tenant-quality profile in this submarket — average credit score on applications, eviction rate, late-payment / NSF rate, and stable-employment percentage? A property-management company in the area should have these aggregated.
- How much new apartment / multifamily construction is in the pipeline within 1–3 miles? Heavy new supply (>2% of stock underway) typically softens rents 12–24 months out; light construction supports rent growth.
Investment metrics
- 1% rule
- 1.20% ✓
- Cap rate
- 9.40%
- Cash-on-cash
- 11.09%
- DSCR
- 1.49
- GRM
- 6.9
CMA / ARV
- ARV (median comp)
- $338,801
- List price
- $375,000
- Delta
- 10.68%
- Verdict
- OVERPRICED
- Comps
- 7 within 1.0 mi
Projected returns pro-forma
9.12% appreciation · 3.0% rent growth · sell at horizon
- IRR
- 30.8%
- Equity multiple
- 3.32×
- Total profit
- $243,676
- Equity at exit
- $313,954
- IRR
- 26.9%
- Equity multiple
- 7.33×
- Total profit
- $664,341
- Equity at exit
- $653,160
Cash invested: $105,000 (down + closing). Projections, not guarantees.
Landlord ↔ Tenant lean methodology
- Overall (STATE)
- 62 Landlord-Friendly
- State Pennsylvania
- 62 Landlord-Friendly · EVEN
- County
- — inherits STATE
- City
- — inherits STATE
ZIP-level market 18232
- Home prices YoY
- 3.6%
- Active inventory
- 36
- Price-to-rent
- 28.9×
Monthly cashflow live
- Estimated rent
- $4,509 high interval (Pro) →
- Mortgage (P&I)
- −$1,967
- Tax est. 1.5%
- −$469 /mo · $5,625/yr
- Insurance
- −$156
- HOA
- −$0
- Vacancy / Maint / Mgmt
- −$947
- Net cashflow
- $971
Break-even live
Sensitivity live
| Price | -10% $1,230 | -5% $1,100 | +0% $971 | +5% $841 | +10% $711 |
|---|---|---|---|---|---|
| Rent | -10% $614 | -5% $792 | +0% $971 | +5% $1,149 | +10% $1,327 |
| Rate | -1.0pp $1,159 | -0.5pp $1,066 | base $971 | +0.5pp $873 | +1.0pp $775 |
4-unit breakdown (identical units grouped — click to expand)
| Units | Beds | Baths | Est. rent |
|---|---|---|---|
| 1× unit | 1 | 1 | $1,082 |
| 3× units | 2 | 1 | $3,426 |
| #2 | 2 | 1 | $1,142 |
| #3 | 2 | 1 | $1,142 |
| #4 | 2 | 1 | $1,142 |
| Total (4 units) | $4,509 | ||
UW: 25.0% down · 7.5% · 30yr · 1.5% tax · 5.0% vac · 8.0% maint · 8.0% mgmt
Financing live
Cash to close
- Down payment
- $93,750
- Closing costs
- $11,250
- Reserves months
- —
- Total cash needed
- —
Loan-product check · same deal, 3 products live
Conventional
25% down · 7.5% · 30yr
- Down + closing
- —
- Monthly P&I
- —
- Monthly cashflow
- —
- DSCR
- —
- Eligible?
- —
Personal DTI + credit; lowest rate.
DSCR
20% down · 8.5% · 30yr
- Down + closing
- —
- Monthly P&I
- —
- Monthly cashflow
- —
- DSCR
- —
- Eligible?
- —
No personal income docs; deal must DSCR.
Hard money
10% down · 12.0% · 12mo
- Down + closing
- —
- Monthly P&I
- —
- Monthly cashflow
- —
- DSCR
- —
- Eligible?
- —
Short-term bridge; refi at stabilization.
Listing history 25 events
-
2026-06-22pricedays on market $375,000 Active 72 DOM
-
2026-06-18days on market $395,000 Active 69 DOM
-
2026-06-17remarks 432-char remark
-
2026-06-17days on market $395,000 Active 68 DOM
-
2026-06-16days on market $395,000 Active 67 DOM
-
2026-06-15days on market $395,000 Active 66 DOM
-
2026-06-14days on market $395,000 Active 64 DOM
-
2026-06-13days on market $395,000 Active 63 DOM
-
2026-06-10days on market $395,000 Active 61 DOM
-
2026-06-09days on market $395,000 Active 60 DOM
-
2026-06-08days on market $395,000 Active 59 DOM
-
2026-06-07days on market $395,000 Active 58 DOM
-
2026-06-05days on market $395,000 Active 55 DOM
-
2026-06-03days on market $395,000 Active 54 DOM
-
2026-06-02days on market $395,000 Active 53 DOM
-
2026-06-01days on market $395,000 Active 52 DOM
-
2026-05-31days on market $395,000 Active 51 DOM
-
2026-05-31days on market $395,000 Active 50 DOM
-
2026-04-10$395,000 Active 401-char remark
Show marketing remark (401 chars)
Fully Occupied 4-Unit Investment Property in Lansford, PA Great opportunity to own a fully leased 4-unit building featuring a desirable unit mix of one 1-bedroom and three 2-bedroom apartments. Tenants pay all utilities, keeping owner expenses low and maximizing cash flow. A solid, income-producing asset in a strong rental market—ideal for investors seeking stable returns and low overhead.
-
2024-11-03historical $950
-
2024-10-15price $950
-
2024-08-28price $999
-
2024-08-02$1,025
-
2023-08-25soldstatus $285,000 Closed 566-char remark
Show marketing remark (566 chars)
Beautifully renovated 4 unit (4th unit is in the process of being renovated and will be complete within 30 days). Located in the small borough of Lansford, each side of the building contains two units including a first floor flat and a second floor unit with additional space on the third floor. The building has three 2-bedroom units and one 1-bedroom unit. Each unit has laundry facilities. Tenants pay electric, heat and hot water. Units have vinyl laminate floors, updated kitchens and some carpeting. One unit has a deck, and the property includes a large yard.
-
2023-04-30$285,000 Active 566-char remark
Show marketing remark (566 chars)
Beautifully renovated 4 unit (4th unit is in the process of being renovated and will be complete within 30 days). Located in the small borough of Lansford, each side of the building contains two units including a first floor flat and a second floor unit with additional space on the third floor. The building has three 2-bedroom units and one 1-bedroom unit. Each unit has laundry facilities. Tenants pay electric, heat and hot water. Units have vinyl laminate floors, updated kitchens and some carpeting. One unit has a deck, and the property includes a large yard.
ⓘ Source: listings_history table (triggers on properties + properties_extension) + one-shot
backfill from property_details.listing_events for pre-trigger history.
Climate risk First Street
- Flood 1/10 Low FEMA zone X (unshaded) · 0% chance over 30 yrs
- Wildfire 3/10 Moderate
- Heat 3/10 Moderate 7 d/yr ≥94°F today · 15 d/yr by 30 yrs out
- Wind 4/10 Moderate 8% chance of damaging wind over 30 yrs
- Air quality 2/10 Low 1 unhealthy d/yr today · 3 by 30 yrs out
Nearby sold comps map
Loading sold comps map…
Walkable amenities ~0.75 mi
Loading nearby amenities…
Taxation est. · year 1
- Rental income
- $54,108
- − Mortgage interest
- −$21,006
- − Property taxes
- −$5,625
- − Insurance
- −$1,875
- − Repairs & maintenance
- −$4,329
- − Management
- −$4,329
- − Depreciation
- −$10,909
- Taxable income
- $6,036
- Est. tax owed @ 24.0%
- −$1,449
- After-tax cash flow
- $10,198/yr
For passive investors: Depreciation is non-cash, so a rental often shows a tax loss while cash-flowing — sheltering income. Rental losses are passive: they offset passive income freely, and up to $25,000/yr can offset ordinary (W-2) income if you actively participate and your MAGI is under $100k (phasing out to $0 by $150k); unused losses carry forward. On sale, claimed depreciation is recaptured at up to 25%, and gains may owe capital-gains tax (a 1031 exchange can defer both). Figures are a year-1 estimate at your 24.0% rate — not tax advice; consult a CPA.
Condition & rehab AI · 12 photos
This 4-unit property requires moderate renovations to improve its curb appeal and interior condition, which can significantly increase its resale and rental value.
Repairs flagged
- Minor Paint — Some wear and tear visible on interior walls and exterior siding.
- Minor Flooring — Some wear and tear visible in common areas.
- Minor Windows — Some wear and tear visible on windows, but no immediate safety concerns.
Value-add opportunities
- Both Painting and updating the exterior siding — Improves curb appeal and can increase both resale and rental value.
- Both Updating the kitchen and bathrooms — Modernizing the kitchen and bathrooms can significantly increase both resale and rental value.
- Both Upgrading the HVAC system — A more efficient HVAC system can improve comfort and energy efficiency, increasing both resale and rental value.
Renovation cost estimate screening
| Repair item | Severity | Est. cost |
|---|---|---|
| Paint · Some wear and tear visible on interior walls and exterior siding. | Minor | $500–3,000 |
| Flooring · Some wear and tear visible in common areas. | Minor | $500–3,000 |
| Windows · Some wear and tear visible on windows, but no immediate safety concerns. | Minor | $500–3,000 |
| Total estimated repair cost · 3 items | $1,500–9,000 |
Value-add ROI direction
- Both Painting and updating the exterior siding — Improves curb appeal and can increase both resale and rental value. ↑
- Both Updating the kitchen and bathrooms — Modernizing the kitchen and bathrooms can significantly increase both resale and rental value. ↑
- Both Upgrading the HVAC system — A more efficient HVAC system can improve comfort and energy efficiency, increasing both resale and rental value. ↑
ⓘ Cost ranges are severity-bucket heuristics (US national rule-of-thumb). Get contractor quotes + a written scope before underwriting a rehab budget.
Schools (NCES district)
- District
- Panther Valley SD
- NCES district ID
- 4218450
- Math proficiency
- 14% ▼ -7.00%
- Reading proficiency
- 35% ▼ -14.00%
- Median HH income
- $36,914
- Composite
- 20.31/100
- National rank
- #8613
- State rank
- #477 of 539 in PA
Livability — Lansford
- Score
- 72/100
- State rank
- #605
- US rank
- #5834
Category grades
Schools grade is shown separately in the Schools card above.
Census & demographics
- Census place
- Lansford, PA
- County
- Carbon County · 13,404 people
- City population
- 4,156
- Metro
- Allentown-Bethlehem-Easton, PA-NJ
- Population (ZIP)
- 4,156
- Household income
- $44,713
- Rent vs Own
- Severe rent burden
- 123.0
Population outlook (Carbon County) Hauer SSP2
- Today (2025)
- 61,643 people
- By 2030
- 59,840 · -2.9%
- By 2040
- 55,413 · -10.1%
- By 2050
- 50,843 · -17.5%
- By 2075
- 43,326 · -29.7%
- By 2100
- 37,126 · -39.8%
Race, ethnicity, and origin ACS 2023
- Neighborhood character
- Diverse neighborhood (Simpson 0.55)
- Race & ethnicity
- White 64% Hispanic / Latino 17% Black 11% Two or more races 11% Native American 4%
- Hispanic origin (detail)
- Puerto Rican 5%
- Common ancestry
- Romanian 4% Polish 2% Iranian 2%
- Foreign-born
- 7% · Canada, Jamaica, South Korea
- Languages at home
- 89% English-only · Spanish 10%
Political lean MEDSL · Carbon
- 2024 margin
- Solid R (+34.8) · D 32.2% · R 67.0%
- 2008→2024 swing
- -36.7pp toward R · 2008: 1.9pp · 2024: -34.8pp
- All cycles
- 2024: R+34.8 2020: R+32.0 2016: R+34.1 2012: R+6.9 2008: D+1.9
Not yet ingested
- Civics
- —
Market trends
- HPI YoY
- ▲ 9.12%
- Current HPI
- 262.3396
- Rent YoY
- —
- Metro
- Allentown-Bethlehem-Easton, PA-NJ
- State GDP YoY
- ▲ 1.68%
- F500 in state
- 34
Industry mix (Fortune 500 HQ in PA)
| Industry | F500 HQs | Revenue |
|---|---|---|
| Healthcare | 2 | $309B |
|
||
| Insurance | 2 | $27B |
|
||
| Telecommunications / Media | 1 | $124B |
|
||
| Industrial Distribution | 1 | $22B |
|
||
| Financial Services | 1 | $20B |
|
||
| Chemicals / Materials | 1 | $18B |
|
||
Price history
+38.6% since first listed7 events — show timeline
- 2026-04-10 Listed $395,000 GLVRMLS
- 2024-11-03 Rental Removed $950 SHOWMOJO
- 2024-10-15 Price Changed $950 SHOWMOJO
- 2024-08-28 Price Changed $999 SHOWMOJO
- 2024-08-02 Listed for Rent $1,025 SHOWMOJO
- 2023-08-25 Sold (MLS) $285,000 PMAR
- 2023-04-30 Listed $285,000 PMAR
Cash-flow waterfall
monthlySold comps — $/sqft
last 12 mo · ≤1 miLoading sold comps…