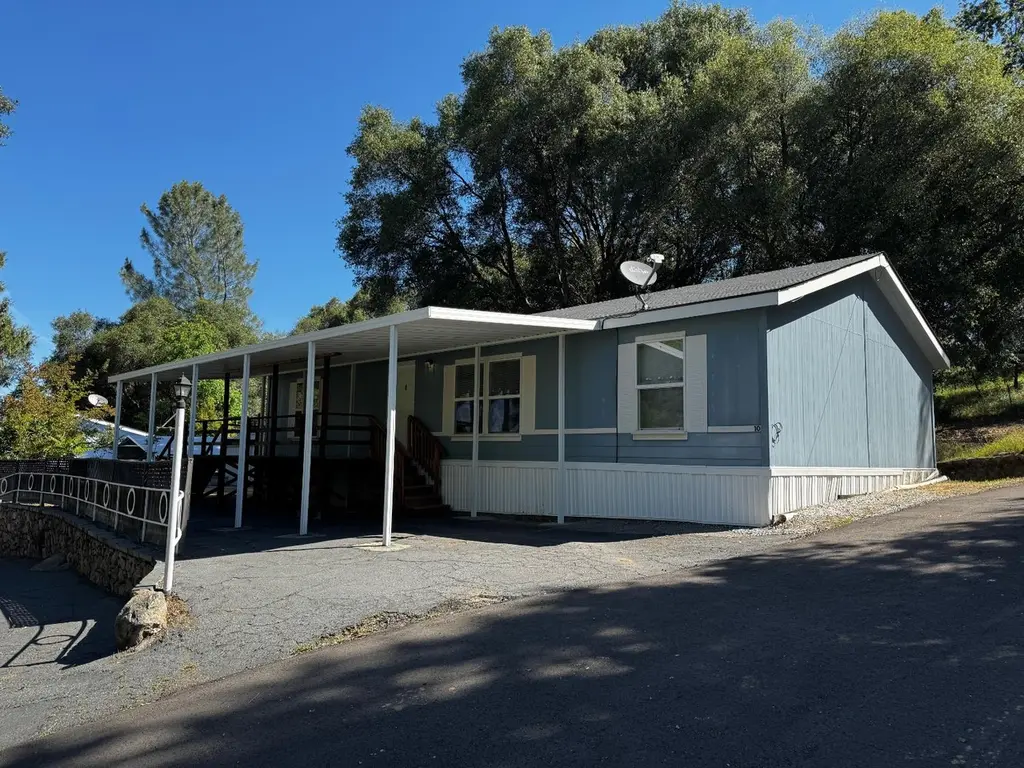
50889 Road 426 #10 · Oakhurst, CA
Flood risk 1/10 · Minimal
- FEMA flood zone
- X (unshaded)
- Chance of flooding over 30 yrs
- 0.0%
- Est. flood insurance / yr
- $507 – $1,088
Fire risk 8/10 · Major
- Est. fire insurance / yr
- $659 – $1,223
Heat risk 5/10 · Moderate
- Hot days now (above 97°F)
- 8 days/yr
- Hot days in 30 yrs
- 20 days/yr
Wind risk 1/10 · Minimal
- Chance of severe wind over 30 yrs
- —
Air-quality risk 10/10 · Severe
- Unhealthy air days now
- 53 days/yr
- Unhealthy air days in 30 yrs
- 63 days/yr
Risk factors via First Street. Map © Google.
Why this score? — see what drove the D- grade
The composite is a weighted blend of 9 inputs, each scored 0–100. Each bar is that input's sub-score; the figure is the points it added to the 100-point composite (weight × sub-score).
- 1% rule +9.6/10.0
- Cash flow +7.8/30.0
- ARV discount +7.5/15.0
- Schools +5.0/10.0
- Livability +2.7/5.0
- Rent growth +2.5/5.0
- Condition / age +2.5/5.0
- DSCR +1.9/10.0
- Appreciation +0.0/10.0
$130,000
🖨 Deal sheet 📄 Offer letter ✓ Due diligence
Listing remarks
Tucked away in the peaceful setting of Sierra Hideaway Mobile Home Park, this beautifully maintained 3-bedroom, 2-bath manufactured home offers comfort, charm, and convenience in the heart of the Sierra foothills. Pride of ownership shines throughout this clean and pristine home, featuring a spacious layout, inviting living spaces, and a warm, welcoming atmosphere. Step outside to enjoy the large deck perfect for relaxing, entertaining, or soaking in the tranquil surroundings along with a lovely yard that adds to the home's charm. Conveniently located just minutes from downtown Oakhurst, shopping, dining, and the south entrance to Yosemite National Park, this is an ideal full-time residen
Key facts
- Large deck
- Peaceful setting
- Lovely yard
Tags
Property features AI
Finance
- Other: Located in Madera County; Directions: From Oakhurst turn right on Road 426 at the talking bear, drive about 3 miles; Sierra Hide-Away is on the left at 50889 Road 426
- HOA & community: Association with monthly fee of $869; Association amenities: Other/None
Exterior
- Parking: Open parking
- Utilities: Electric service available; Public utilities
- Home design: Manufactured home; Single-story (one level)
- Construction: Sierra Hide Away mobile home; Composition roof; Concrete foundation; Other construction materials
- Exterior features: Foothill lot setting; Park space rented
Interior
- Kitchen: Range/oven (gas); Dishwasher; Refrigerator
- Flooring: Carpet; Laminate
- Bathrooms: 2 bathrooms with tub/shower
- Heating & cooling: Central heating and central air conditioning
- Interior features: Dishwasher; Refrigerator; Gas range/oven; Gas appliances
- Laundry & utility: Laundry inside
Neighborhood map
What this means for you Summary
Snapshot
- This is a 3-bed/2.0-bath single-family listed at $130k.
Deal economics
- At list price, monthly cash flow is $-144 ($-2k/yr) — negative.
- To cash-flow at today's rent, offer at most $104k (19.6% below list).
- Meets the 1% rule at list price ($2k rent vs $130k).
- Recommended offer: $104k (19.6% below list) — sets the bar for cash-flow.
- Cap rate 5.0% vs local median 3.5% in Oakhurst — top-decile yield for the area; either an underpriced asset or a hidden risk that comps aren't pricing in. Stress-test before assuming the spread holds.
Location & tenants
- Location reads 54/100 on livability (#911 in CA) — a working-class tenant base; expect higher turnover. Strengths: housing A; Watch: crime D-, amenities F, commute F.
- Market conditions: 133 active listings in the ZIP; 1,346 units permitted in Madera County in 2024 (8 in 5+ unit buildings).
Forward outlook
- Local home prices are declining (-3.0%/yr); year-one equity from $899 of loan paydown is wiped out by about $4k of value loss. Plan a longer hold.
- Madera County population projected at +6% by 2050 — modest demand growth; plan on rents tracking national, not racing it.
Negotiation context
- It's been on market 17 days — a 2% lower offer ($128k) is reasonable based on typical stale-listing flexibility.
- 2 sale attempts since 5y ago with the ask held roughly flat each time — persistent listings suggest the price (not the market) is what's stuck; bring a comps-based counter.
Risks & watch-outs
- Watch-outs: HOA is 46% of rent.
- Climate carrying-cost: severe wildfire risk; extreme-heat days projected 8→20/yr by 2055 (HVAC capex compounding) — expect insurance premiums to compound above CPI over the hold.
Questions for the listing agent
- What do current leases actually rent for vs. the listed asking? Can we see a recent rent roll and the last 12 months of T-12 income?
- What does the HOA fee cover, when was the last increase, and are there any pending special assessments or reserve-fund shortfalls?
- Is there a deadline driving the sale (1031 exchange, divorce, estate, relocation)? That informs how much negotiation room exists.
- Crime grade is D in this area — have there been break-ins, vandalism, or insurance claims at this property in the last 3 years? What carrier currently insures it and at what premium?
- The area grade is low — what's the realistic commute time and amenity access for the typical tenant pool here? Any planned neighborhood developments (good or bad) we should know about?
- What's the average days-on-market for RENTAL listings here right now (not sales)? A rising rental-DOM trend means longer vacancies and softer asking-rent achievability than the comps imply.
- What's the recent tenant-quality profile in this submarket — average credit score on applications, eviction rate, late-payment / NSF rate, and stable-employment percentage? A property-management company in the area should have these aggregated.
- How much new for-sale + rental construction is in the pipeline within 1–3 miles? Heavy new supply typically softens prices + rents 12–24 months out; constrained supply supports both.
Investment metrics
- 1% rule
- 1.46% ✓
- Cap rate
- 4.96%
- Cash-on-cash
- -4.76%
- DSCR
- 0.79
- GRM
- 5.7
CMA / ARV
No comps found within radius.
Projected returns pro-forma
-3.0% appreciation · 3.0% rent growth · sell at horizon
- IRR
- -23.8%
- Equity multiple
- 0.18×
- Total profit
- $-29,776
- Equity at exit
- $19,383
- IRR
- -17.6%
- Equity multiple
- 0.02×
- Total profit
- $-35,790
- Equity at exit
- $11,240
Cash invested: $36,400 (down + closing). Projections, not guarantees.
Landlord ↔ Tenant lean methodology
- Overall (STATE)
- 18 Strongly Tenant-Friendly
- State California
- 18 Strongly Tenant-Friendly · D+13
- County
- — inherits STATE
- City
- — inherits STATE
ZIP-level market 93644
- Active inventory
- 133
- Price-to-rent
- 5.7×
Monthly cashflow live
- Estimated rent
- $1,900 medium interval (Pro) →
- Mortgage (P&I)
- −$682
- Tax from tax record
- −$41 /mo · $489/yr
- Insurance
- −$54
- HOA
- −$869
- Vacancy / Maint / Mgmt
- −$399
- Net cashflow
- $-144
Break-even live
UW: 25.0% down · 7.5% · 30yr · 1.5% tax · 5.0% vac · 8.0% maint · 8.0% mgmt
Financing live
Cash to close
- Down payment
- $32,500
- Closing costs
- $3,900
- Reserves months
- —
- Total cash needed
- —
Loan-product check · same deal, 3 products live
Conventional
25% down · 7.5% · 30yr
- Down + closing
- —
- Monthly P&I
- —
- Monthly cashflow
- —
- DSCR
- —
- Eligible?
- —
Personal DTI + credit; lowest rate.
DSCR
20% down · 8.5% · 30yr
- Down + closing
- —
- Monthly P&I
- —
- Monthly cashflow
- —
- DSCR
- —
- Eligible?
- —
No personal income docs; deal must DSCR.
Hard money
10% down · 12.0% · 12mo
- Down + closing
- —
- Monthly P&I
- —
- Monthly cashflow
- —
- DSCR
- —
- Eligible?
- —
Short-term bridge; refi at stabilization.
HOA detail
- Monthly dues
- $869 · $10,428/yr
Listing history 20 events
-
2026-06-19days on market $130,000 Active 17 DOM
-
2026-06-18days on market $130,000 Active 16 DOM
-
2026-06-17days on market $130,000 Active 15 DOM
-
2026-06-16days on market $130,000 Active 14 DOM
-
2026-06-15days on market $130,000 Active 13 DOM
-
2026-06-14days on market $130,000 Active 11 DOM
-
2026-06-12days on market $130,000 Active 10 DOM
-
2026-06-09days on market $130,000 Active 14 DOM
-
2026-06-08days on market $130,000 Active 13 DOM
-
2026-06-07days on market $130,000 Active 12 DOM
-
2026-06-07days on market $130,000 Active 11 DOM
-
2026-06-04days on market $130,000 Active 8 DOM
-
2026-06-02days on market $130,000 Active 1 DOM
-
2026-06-01days on market $130,000 Active 6 DOM
-
2026-05-31days on market $130,000 Active 5 DOM
-
2026-05-31days on market $130,000 Active 4 DOM
-
2026-05-26$130,000 Active
-
2021-12-27status Pending Sale
-
2021-12-18historical
-
2021-11-07$95,000 Active
ⓘ Source: listings_history table (triggers on properties + properties_extension) + one-shot
backfill from property_details.listing_events for pre-trigger history.
Tax reassessment forecast CA · Resets to sale price
- Current annual tax
- $489 · $41/mo
- Projected year-2 tax
- $988 · $82/mo
- Expected delta
- +$499/yr (+$42/mo · 101.9%)
ⓘ Screening estimate from a state-policy table — verify with the county assessor before closing.
Climate risk First Street
- Flood 1/10 Low FEMA zone X (unshaded) · 0% chance over 30 yrs
- Wildfire 8/10 Severe
- Heat 5/10 Major 8 d/yr ≥97°F today · 20 d/yr by 30 yrs out
- Wind 1/10 Low
- Air quality 10/10 Extreme 53 unhealthy d/yr today · 63 by 30 yrs out
Nearby sold comps map
Loading sold comps map…
Walkable amenities ~0.75 mi
Loading nearby amenities…
Taxation est. · year 1
- Rental income
- $22,804
- − Mortgage interest
- −$7,282
- − Property taxes
- −$489
- − Insurance
- −$650
- − Repairs & maintenance
- −$1,824
- − Management
- −$1,824
- − HOA
- −$10,428
- − Depreciation
- −$3,782
- Taxable loss
- −$3,476
- Est. tax savings @ 24.0%
- +$834
- After-tax cash flow
- $-899/yr
For passive investors: Depreciation is non-cash, so a rental often shows a tax loss while cash-flowing — sheltering income. Rental losses are passive: they offset passive income freely, and up to $25,000/yr can offset ordinary (W-2) income if you actively participate and your MAGI is under $100k (phasing out to $0 by $150k); unused losses carry forward. On sale, claimed depreciation is recaptured at up to 25%, and gains may owe capital-gains tax (a 1031 exchange can defer both). Figures are a year-1 estimate at your 24.0% rate — not tax advice; consult a CPA.
Schools (NCES district)
No district data.
Livability — Oakhurst
- Score
- 54/100
- State rank
- #911
- US rank
- #24074
Category grades
Schools grade is shown separately in the Schools card above.
Census & demographics
- Census place
- Oakhurst, CA
- Population (ZIP)
- 6,490
Population outlook (Madera County) Hauer SSP2
- Today (2025)
- 157,915 people
- By 2030
- 159,604 · +1.1%
- By 2040
- 163,454 · +3.5%
- By 2050
- 167,071 · +5.8%
- By 2075
- 171,182 · +8.4%
- By 2100
- 162,781 · +3.1%
Race, ethnicity, and origin ACS 2023
- Neighborhood character
- Predominantly White (83%)
- Race & ethnicity
- White 83% Hispanic / Latino 12% Two or more races 6%
- Hispanic origin (detail)
- Mexican 9%
- Common ancestry
- Lithuanian 4% Italian 4% Slovak 4%
- Foreign-born
- 6% · Canada
- Languages at home
- 91% English-only · Spanish 6% Russian/Polish/Slavic 1% German/W. Germanic 1%
Political lean MEDSL · Madera
- 2024 margin
- Strong R (+20.8) · D 38.4% · R 59.2% · Other 2.4%
- 2008→2024 swing
- -7.5pp toward R · 2008: -13.3pp · 2024: -20.8pp
- All cycles
- 2024: R+20.8 2020: R+11.6 2016: R+17.3 2012: R+19.4 2008: R+13.3
Not yet ingested
- Civics
- —
Market trends
- HPI YoY
- ▼ -153.01%
- Current HPI
- 259.017
- Rent YoY
- —
- Metro
- —
- State GDP YoY
- ▲ 3.21%
- F500 in state
- 116
Industry mix (Fortune 500 HQ in CA)
| Industry | F500 HQs | Revenue |
|---|---|---|
| Technology | 27 | $1,492B |
|
||
| Financial Services | 3 | $174B |
|
||
| Retail | 3 | $44B |
|
||
| Insurance | 3 | $26B |
|
||
| Media / Entertainment | 2 | $115B |
|
||
| Pharmaceuticals / Biotech | 2 | $62B |
|
||
Price history
+36.8% since first listed4 events — show timeline
- 2026-05-26 Listed $130,000 FRESNOMLS
- 2021-12-27 Pending — CRMLS
- 2021-12-18 Listing Removed — CRMLS
- 2021-11-07 Listed $95,000 CRMLS
Property tax history
+3.0%/yrLatest (2017): $489 · -2.0% YoY. Source: county tax records.
Cash-flow waterfall
monthlySold comps — $/sqft
last 12 mo · ≤1 miLoading sold comps…